Quick Summary
Finding the right Instagram competitor analysis tool can transform how you benchmark performance and grow engagement. This guide explores the best platforms that help brands monitor Instagram competitors, uncover content insights, and strategically improve their Instagram game.
From comprehensive analytics suites to specialized engagement trackers, we'll break down seven leading tools with real features, honest pricing, and genuine pros and cons. We also show how Shortimize delivers cross-platform tracking for brands serious about short-form content performance.
Why You Need Instagram Competitor Analysis
Your Instagram strategy exists in a vacuum until you compare it to others in your space.
Marketers face a brutal reality: limited visibility into what competitors are actually doing, hours spent manually gathering data from multiple profiles, and zero reliable way to benchmark engagement metrics against industry peers.
You might think your 3% engagement rate is solid, but if your competitors are hitting 7%, you're losing ground without even knowing it.
Research shows that over 90% of brands now use Instagram for marketing, which means the platform is more competitive than ever. Without competitor context, even a strong strategy can underperform simply because you're working blind.
Think about what you could learn from tracking your biggest competitor's posting schedule, their most viral Reels, which hashtags drive their engagement, or how their follower growth accelerates during campaigns. These insights exist in the public data, but extracting them manually is impractical at scale.
This is where Instagram competitor analysis tools step in.
They automate the data collection, organize metrics into comparable formats, and surface patterns you'd never spot on your own. Instead of guessing what works, you see exactly which content formats, posting times, and strategies deliver results in your niche.
In this guide, we'll review the best Instagram competitor analysis tools for 2025 that help you uncover trends, analyze rival strategies, and refine content performance. Each tool offers different strengths, whether you need quick engagement benchmarks or enterprise-level reporting.
By the end, you'll know exactly which solution fits your goals and budget.

Why Listen to Us?
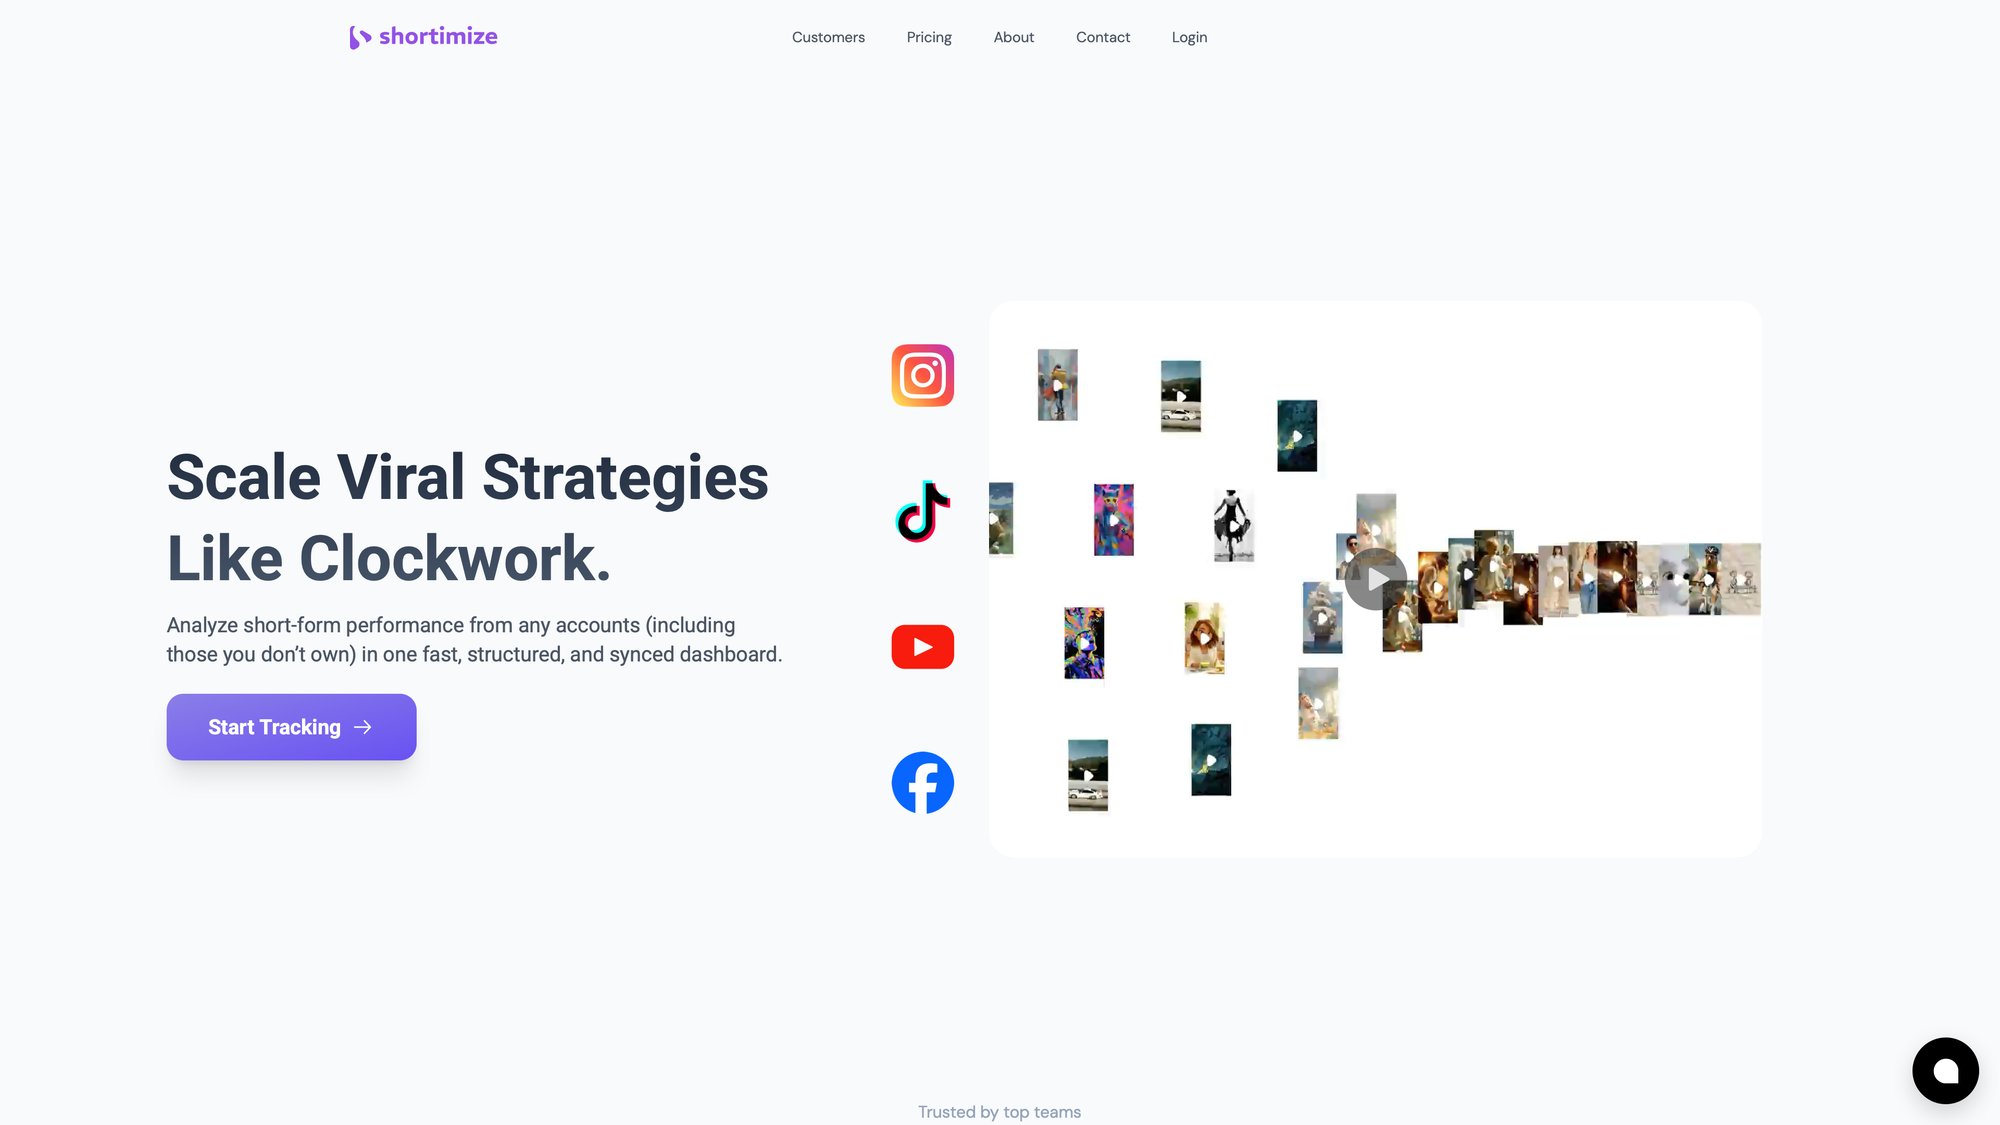
We built Shortimize to solve the exact problem this guide addresses: tracking short-form video performance across platforms without switching between six different dashboards.
Our platform delivers cross-platform analytics for TikTok, Instagram Reels, and YouTube Shorts. Teams at companies like Amo, Airbuds, and Reclip (check our customer stories) use our analytics daily to benchmark performance, spot viral content, and understand what competitors are doing.
We track millions of videos, process engagement data in near real-time, and offer API integrations for teams that need programmatic access.
We've spent years refining performance tracking metrics, working with growth marketers who need precision data they can actually trust. When we talk about competitor analysis tools, we know what works because we've built one ourselves and we understand the workflow challenges brands face when trying to make sense of Instagram analytics.
This guide draws on that experience. We'll give you honest assessments of each tool, including our own, because ultimately the best tool depends on your specific needs, not just feature lists.
What Are Instagram Competitor Analysis Tools?
Instagram competitor analysis tools are software platforms that automatically track and compare public Instagram accounts.
Instead of manually visiting competitor profiles and screenshotting their posts, these tools pull metrics like follower counts, engagement rates, posting frequency, and content performance into organized dashboards.
The core function is simple: you input a competitor's Instagram handle, and the tool continuously collects their public data. You get historical growth charts, engagement breakdowns per post, content type analysis (Reels vs. carousels vs. static posts), and often insights into their hashtag strategies or optimal posting times.
What makes these tools valuable goes beyond just seeing numbers. They help you identify patterns that inform strategic decisions.
For example, if you notice a competitor's engagement spikes every Tuesday at 6 PM, or that their Reels consistently outperform static posts by 4x, you can test similar approaches in your own strategy.
Many platforms now include AI-powered features that categorize content themes, detect viral posts (those performing significantly above an account's baseline), and even suggest similar accounts to monitor. Some tools, like Shortimize, extend beyond Instagram to track TikTok and YouTube Shorts, letting you benchmark short-form performance across all three major platforms from a single dashboard.
The competitive intelligence these tools provide saves hours of manual work while delivering insights you simply couldn't spot without systematic data collection. Instead of reactive guessing about what competitors do well, you gain proactive visibility into their entire content strategy.
How Instagram Competitor Analysis Improves Your Strategy
Competitor analysis isn't about copying what others do. It's about understanding the baseline for success in your space and finding opportunities others miss.
Benchmark your growth: Without context, metrics are meaningless. Is gaining 500 followers this month good? That depends entirely on whether your competitors grew by 200 or 2,000. Competitor tracking gives you the industry baseline. You learn where you actually stand, which metrics need immediate attention, and what growth rate you should target to stay competitive.
Refine your strategy: The fastest way to improve your Instagram performance is to study what already works in your niche. When you track competitors, you see which content formats drive engagement (maybe carousels outperform single images in your industry), which topics resonate (perhaps educational content beats promotional), and which posting cadences work (daily vs. three times per week). This empirical evidence beats guesswork every time.
Monitor trends: Platforms evolve quickly. A format that worked last quarter might be dead now, and new features can explode overnight. By monitoring competitor performance, you catch these shifts early. If you notice multiple competitors suddenly getting higher reach from Reels featuring trending audio, you're alerted to test that format before your own audience moves on.
Optimize posting schedules: Engagement patterns differ across industries and audiences. A B2B software company might see peak engagement at 9 AM on weekdays, while a fitness brand could perform best at 6 PM. Competitor data reveals when similar accounts get the most interaction, helping you align your publishing schedule with proven high-activity windows instead of relying on generic best practices.
Track audience overlap: Understanding if you share followers with competitors (and which ones) helps identify partnership opportunities or gaps in your positioning. If most of your audience also follows Competitor A but ignores Competitor B, that tells you something about your current positioning and where you might find new audience segments by studying what Competitor B does differently.
The value is this: competitor analysis transforms your Instagram strategy from isolated experimentation into informed iteration. You learn from what works across your entire competitive set, adapt proven tactics to your brand, and identify white space others haven't exploited yet.
7 Best Instagram Competitor Analysis Tools (2025)
We've tested and evaluated the leading platforms for Instagram competitor analysis. Each tool serves different needs, from quick engagement checks to enterprise-level benchmarking.
Below is a comparison table covering the essentials, followed by detailed breakdowns of features, pricing, and honest pros and cons.
Comparison Table
| Tool Name | Ideal For | Core Function | Best For | Accessibility | Pricing Model |
|---|---|---|---|---|---|
| Shortimize | Brands, creators, agencies | Cross-platform analytics & competitor tracking | Short-form and Instagram performance insights | Web, API | Free tools + Paid plans (7-day trial) |
| Socialinsider | Agencies, marketing teams | In-depth Instagram benchmarking | Competitor post and engagement analysis | Web | Paid plans only (from ~$99/mo) |
| Iconosquare | Creators, small businesses | Analytics & content planning | Content performance comparison | Web, Mobile | Free trial + Paid plans (from ~$35/mo) |
| Sprout Social | Enterprises | Social analytics & monitoring | Cross-platform insights (includes competitors) | Web | Paid only (from ~$249/mo per user) |
| Keyhole | Agencies, analysts | Hashtag & influencer analytics | Competitive trend tracking (real-time) | Web | Free demo + Paid plans (from ~$89/mo) |
| Phlanx | Small to mid-size brands | Engagement rate checker | Quick competitor engagement benchmarking | Web | Free tools + Paid plans (from ~$49/mo) |
| HypeAuditor | Influencer marketers | Audience authenticity & competitor insights | Influencer benchmarking and audits | Web | Paid only (from ~$299/mo) |
Note: Pricing reflects approximate starting points as of early 2025. Most tools offer annual discounts or custom enterprise pricing.

1. Shortimize
Overview:
Shortimize specializes in cross-platform analytics for short-form video, tracking TikTok, Instagram Reels, and YouTube Shorts from a unified dashboard. Unlike tools focused only on Instagram, we built Shortimize to solve the challenge of monitoring video performance across all major short-form platforms simultaneously.
The workflow is straightforward: input any public Instagram handle or Reels URL, and Shortimize pulls comprehensive performance data. You get follower growth charts, engagement metrics per post, viral content detection (posts performing significantly above the account's baseline), and insights into posting patterns.
What makes this valuable for competitor analysis is the ability to track multiple accounts in Collections, compare their performance side by side, and spot patterns across your competitive set.
For Instagram specifically, Shortimize shows you an account's trajectory over time, which content formats drive the most engagement, and how individual Reels perform relative to their other content. The platform automatically refreshes data (up to hourly on Business plans), so you're working with current metrics, not stale snapshots.
The real differentiator is cross-platform visibility. If your competitors are active on Instagram and TikTok, you can analyze their performance on both platforms from the same interface. This matters because short-form content strategies increasingly span multiple platforms, and understanding where competitors invest effort (and see results) gives you strategic context you won't get from Instagram-only tools.
Key Features:
Cross-Platform Tracking: Monitor competitors across Instagram Reels, TikTok, and YouTube Shorts from one dashboard. Compare performance metrics across platforms to see where competitors focus their efforts and what works best for them.
Automatic Data Refresh: Shortimize refreshes tracked accounts on a schedule (24-hour on Pro, 12-hour on Business, hourly on Enterprise). You don't need to manually update data, and you can track performance changes in near real-time.
Detailed Instagram Insights: View follower growth over time, average engagement rate per post, top-performing content, posting frequency patterns, and breakdowns by content type. Filter by date ranges to analyze specific campaign periods or seasonal trends.
Outlier Detection: Shortimize automatically flags viral posts that significantly outperform an account's baseline metrics. This helps you immediately identify which competitor content resonated most and analyze what made it successful.
Collections & Collaboration: Organize competitors into Collections (grouped by niche, campaign, or strategy). Share these with team members or clients. Collections support collaborative workflows where multiple people need access to the same competitive intelligence.
API & Integrations: API access (available as an add-on) lets you pull Instagram analytics programmatically. Integrate with tools like Slack for alerts, Zapier for automation, or product analytics platforms (Amplitude, Mixpanel, Posthog) to combine social data with other business metrics.
Free AI Tools: Beyond analytics, Shortimize offers free AI-powered tools for content creation (caption generators, script templates). These help you act on competitive insights by quickly testing similar content approaches.
Pricing:
Shortimize offers a 7-day free trial for all paid plans. After that:
Pro Plan: $99/month
-
1 user seat
-
Track up to 1,000 videos across all platforms
-
24-hour data refresh
-
Email support
-
Additional seats at $20/month each
Business Plan: $249/month
-
3 user seats
-
Track up to 5,000 videos
-
12-hour data refresh
-
WhatsApp support
-
API & webhooks add-on available ($150/month)
-
Metered usage after 5,000 videos at $10 per 1,000 videos (optional)
Enterprise Plan: Custom pricing
-
Unlimited seats and videos
-
Hourly data refresh
-
Dedicated success manager
-
Full API access included
-
Custom integrations and white-labeling
The free trial gives full access to features, so you can test the competitor tracking workflow before committing. Annual billing provides additional savings.
Pros:
① Designed for Short-Form: Unlike general social media analytics platforms, Shortimize focuses specifically on short-form video. The metrics, insights, and UI are optimized for understanding Reels, TikToks, and Shorts performance, not buried in a broader social media suite.
② Simple Competitor Onboarding: Adding competitors takes seconds. Paste an Instagram handle or Reels URL, and Shortimize starts tracking automatically. No complex configuration or account linking required.
③ Real-Time Refresh Rates: Business and Enterprise plans offer data updates every 12 hours or hourly. This matters when you need to monitor live campaigns, product launches, or trending content as it happens.
④ Cross-Platform Context: Unique ability to compare an account's Instagram performance alongside their TikTok and YouTube Shorts metrics. See where competitors invest effort, which platform delivers better engagement, and how their strategy differs across channels.
⑤ Collaboration Built-In: Multi-user access, shared Collections, and permission controls make it easy for teams to work together. Create client-facing dashboards or internal competitive tracking boards without technical overhead.
⑥ API Access: Rare in this category, the API lets technical teams build custom reports, automate competitor tracking workflows, or integrate Instagram analytics into broader business intelligence systems.
Cons:
Video-Centric Scope: Shortimize tracks public performance metrics for video content. It doesn't analyze Instagram Stories (unless posted as Reels), manage content publishing, or provide social listening beyond performance data. If you need an all-in-one social media management platform, you'd pair Shortimize with a publishing tool.
2. Socialinsider
Overview:
Socialinsider is a dedicated social media analytics and benchmarking platform used extensively by agencies and marketing teams. It excels at creating detailed competitive reports for Instagram, allowing you to analyze any public business account by simply adding it to your workspace.
The platform retrieves comprehensive metrics including follower growth, reach, impressions, engagement rate per post, and top-performing content.
One standout feature is its benchmarking capability: you can directly compare your brand's performance against multiple competitors across the same time period, seeing side-by-side visualizations of who's winning on engagement, follower growth, or posting frequency.
Socialinsider also analyzes content mix (the ratio of Reels vs. static posts vs. carousels), optimal posting times based on engagement data, and even performs AI-powered content categorization to identify which topics or themes each competitor emphasizes.
For agencies delivering client reports, the platform offers white-label PDF exports that look polished and professional.
The interface is data-rich but well-organized, making it accessible even for marketers who aren't deeply technical. It covers multiple platforms (Instagram, Facebook, TikTok, YouTube, Twitter, LinkedIn), positioning itself as a comprehensive analytics suite rather than an Instagram-only tool.
Key Features:
Comprehensive Instagram Metrics: Track followers, engagement, reach, impressions, and even Instagram Stories data (for accounts you have access to). Historical data shows trends over weeks or months.
Competitor Benchmark Reports: Create multi-account comparison reports showing which competitor leads on specific KPIs. Socialinsider ranks accounts and visualizes performance gaps, making it easy to identify where you're ahead or behind.
Content Analysis: The platform categorizes competitor posts by content themes using AI. You can see what topics each competitor focuses on (product showcases, educational content, user-generated content, etc.) and how each category performs for them.
Hashtag & Caption Insights: Extract the top hashtags competitors use, analyze which hashtags correlate with higher engagement, and evaluate caption lengths or patterns that drive better performance.
PDF and PowerPoint Exports: Generate white-label reports for clients or stakeholders. The exports are presentation-ready, saving hours of manual deck creation.
Multi-Platform Coverage: Beyond Instagram, Socialinsider tracks Facebook, TikTok, YouTube, Twitter, and LinkedIn. Manage all social competitive analysis from one platform.
Pricing:
Socialinsider operates on a paid subscription model with a 14-day free trial. Pricing tiers include:
| Plan | Price | Features |
|---|---|---|
| Starter | ~$99/month | Track 10-20 profiles, 3 months historical data, 1-2 users |
| Growth | ~$149-$199/month | 30-50 profiles, 12 months data, more users, advanced benchmarks |
| Enterprise | Custom pricing | High-volume tracking, unlimited data, dedicated manager |
Annual billing typically saves 15-20%. All plans include unlimited reports and data exports.
Pros:
→ Agency-Ready Reports: The platform's strength is reporting. PDF exports with competitive benchmarks look professional and client-ready without additional design work.
→ Depth of Instagram Data: Socialinsider pulls in Instagram Stories metrics and differentiates organic vs. paid performance (where data is available). This level of detail is uncommon in competitor tools.
→ Industry Benchmark Database: The tool provides industry average engagement rates and growth metrics. This helps contextualize whether a competitor's performance is strong relative to industry norms, not just your own account.
→ Ease of Use: Despite its depth, Socialinsider's interface is intuitive. Adding competitors and generating benchmark reports requires minimal training.
→ Multi-Channel: If you need competitor data across all major social platforms, Socialinsider handles it. Reduce tool sprawl by consolidating analytics in one place.
Cons:
No Free Version: After the 14-day trial, you must subscribe. For small businesses or solo creators, the monthly cost can be significant if you only need occasional competitive checks.
Daily Data Refresh: Updates happen daily, not in real-time. If you need to monitor competitors during live campaigns or trending moments, the lag can be a limitation.
Business Account Focus: For Instagram, Socialinsider works best with Business or Creator profiles. Personal accounts or very small accounts may not pull complete data due to API restrictions.

3. Iconosquare
Overview:
Iconosquare started as an Instagram analytics specialist and has evolved into a full social media analytics and content planning platform. It's popular among creators, small businesses, and social media managers who want both performance insights and scheduling capabilities in one tool.
On the analytics side, Iconosquare lets you track competitors by adding their Instagram profiles to a dedicated "Competitors" section. The platform displays follower evolution, average engagement per post, posting frequency, and an industry benchmark feature that shows how you and competitors compare to typical accounts in your category or size range.
The dashboard is clean and mobile-friendly (Iconosquare offers a mobile app), making it easy to check competitor metrics on the go.
Beyond analytics, Iconosquare includes a content calendar for scheduling Instagram posts and Reels, a unified inbox for managing comments and DMs, and optimization tools like best time to post suggestions and hashtag performance tracking.
This dual focus (analytics + management) makes Iconosquare attractive for teams that want to monitor competitors and execute their own strategy from the same platform. It's less specialized than pure analytics tools but more functional than basic social media schedulers.
Key Features:
Competitor Tracking & Benchmarking: Track up to 5 competitors on basic plans (more on higher tiers). View side-by-side comparisons of follower growth, engagement rates, and posting patterns.
Industry Benchmarks: Compare your performance (and competitors') against industry averages for accounts of similar size. This helps assess whether a competitor's metrics are genuinely strong or just typical for their category.
Content Optimization Tools: Get recommendations on best posting times based on historical engagement data. Track hashtag performance to see which tags drive more visibility and engagement.
Multi-Platform Analytics: Supports Instagram, Facebook, TikTok, Twitter, and LinkedIn. Track competitors across platforms from one interface.
Scheduling & Publishing: Unlike most tools on this list, Iconosquare includes a content calendar for scheduling posts, Reels, and Stories. Publish directly to Instagram or schedule posts in advance with first-comment scheduling.
Mobile App: Access analytics and manage social media from iOS or Android apps. Check competitor metrics or publish content from your phone.
Pricing:
Iconosquare offers a 14-day free trial of all features. Pricing tiers (based on late 2024 updates):
-
Launch Plan: $35 USD when billed annually – 5 social profiles, 1 user seat, basic analytics and scheduling, competitor tracking available
-
Scale Plan: $75 USD annually – 5 profiles, 3 user seats, full competitor and hashtag tracking, priority support
-
Excel Plan: $125 USD annually, or custom pricing – 5+ profiles, unlimited users, advanced analytics and reporting, dedicated account manager
Iconosquare does not offer a permanently free version, but the trial includes full access to test competitor tracking before committing.
Pros:
-
User-Friendly Interface: The dashboard is intuitive and visually clean. Graphs and metrics are easy to interpret, making it accessible for marketers without deep analytics experience.
-
All-in-One Solution: Combines competitor analytics with content scheduling and social inbox management. Fewer tools to juggle if you prefer one ecosystem.
-
Solid Instagram Focus: As an early Instagram analytics partner, Iconosquare has very reliable Instagram data and retains up to 2 years of historical metrics on higher plans.
-
Mobile Access: The ability to check competitor performance or publish content from a mobile app is convenient for on-the-go social managers.
-
Benchmarking Feature: Automated industry benchmarks help contextualize competitor data. You'll know if a competitor's engagement is impressive or just average for their niche.
Cons:
Competitor Tracking Limits: Lower-tier plans restrict how many competitors you can monitor (typically 5). If you have more than five key competitors, you'll need a higher-cost plan or make trade-offs.
Data Retention Caps: Historical data access depends on your plan (1 year on basic, 2 years on higher tiers). Long-term trend analysis requires exporting data periodically or paying for premium plans.
Cost for Full Features: To unlock advanced competitor tracking, multi-user access, and extended data retention, the monthly cost can climb. It may be more expensive than tools focused solely on analytics.

4. Sprout Social
Overview:
Sprout Social is an enterprise-grade social media management platform that combines publishing, engagement, customer care, and analytics. It's designed for large teams and organizations that need a comprehensive solution covering all aspects of social media operations.
Within Sprout's analytics suite, you can create Competitive Reports for Instagram (and other platforms). These reports let you select competitor profiles and compare metrics like followers, posts published, engagement (comments, likes), and engagement rates over specific timeframes. The data is visualized in clean charts and tables, making it easy to present findings to executives or stakeholders.
Sprout also includes a social listening module that goes beyond profile-level metrics. You can track competitor mentions, measure share of voice (how often your brand is discussed compared to competitors), and analyze sentiment in social conversations. This contextual intelligence is valuable for understanding brand perception and competitive positioning beyond just performance metrics.
The platform's interface is polished and the analytics are presentation-ready out of the box. Sprout is widely used by Fortune 500 companies and agencies managing multiple clients, primarily because it integrates publishing, listening, analytics, and team collaboration into one reliable system.
Key Features:
• Competitive Benchmark Reports: Pre-built reports that compare Instagram accounts on key metrics (followers, posts, engagement). Export as PDF or PNG for presentations.
• Content Performance Analysis: Compare your top posts against competitors' top posts. Identify content themes and formats that drive high engagement across your competitive set.
• Social Listening & Share of Voice: Track competitor mentions and sentiment in social conversations. Measure how often competitors are discussed relative to your brand, and whether sentiment trends positive or negative.
• Cross-Platform Coverage: Competitive tracking across Instagram, Facebook, Twitter, LinkedIn, Pinterest, and YouTube (TikTok in beta). Unified analytics for all major social networks.
• Team Collaboration & CRM: Multi-user workflows, message assignment, and CRM-like profiles for social users. While not directly competitor-related, these features support large teams managing competitive intelligence alongside customer engagement.
• Customizable Dashboards: Build your own dashboards with widgets showing competitor vs. your brand metrics. Tailor views to specific KPIs or reporting needs.
Pricing:
Sprout Social uses a per-user subscription model with tiered pricing:
| Plan | Price/User/Month | Key Features |
|---|---|---|
| Standard | $249 | Social publishing, basic analytics, limited competitive reports |
| Professional | $399 | Full competitive reports, advanced analytics, limited social listening |
| Advanced | $499 | Unlimited listening queries, advanced automation, chatbot integrations |
Sprout offers a 30-day free trial to test features. The pricing is per seat, so teams of multiple users face significant monthly costs. Enterprise pricing is available for custom needs, compliance features, or large seat counts.
Pros:
Comprehensive Platform: Sprout consolidates publishing, inbox management, analytics, and listening in one system. Reduces tool sprawl for teams managing complex social operations.
Competitive Insights + Listening: Combines on-profile metrics with off-profile conversations. Understand not just what competitors post, but how people talk about them across social media.
Enterprise Reliability: Sprout is trusted by large organizations for data accuracy, compliance features, and consistent uptime. It's a mature, well-supported product.
Team Collaboration: Built for multi-user teams with approval workflows, task assignment, and role-based permissions. Great for large marketing departments or agencies with multiple clients.
Polished Reports: Sprout's analytics exports are professional and client-ready. Save hours on manual report design.
Cons:
High Cost: Sprout is one of the most expensive tools in this category. The per-user pricing model can become prohibitive for smaller teams, especially when full competitive features require Professional or Advanced tiers.
Overkill for Analytics-Only Needs: If you only need Instagram competitor tracking, Sprout delivers far more functionality than necessary. You'd be paying for publishing, CRM, and other features you may not use.
Competitor Tracking Limits: Even on higher plans, there may be restrictions on how many competitors you can actively track at once. Advanced competitive analysis might require enterprise-level contracts.

5. Keyhole
Overview:
Keyhole is a real-time social media analytics platform known for its strength in hashtag tracking and social listening. It's popular with agencies and analysts who need to monitor campaigns, trending topics, or competitive activity as it happens.
For Instagram competitor analysis, Keyhole lets you track specific accounts and hashtags to monitor engagement, reach, and trending content. You can compare how competing brands perform on shared hashtags, track spikes in engagement when competitors launch campaigns, and measure influencer participation in competitor initiatives.
One of Keyhole's standout features is its live dashboard. Data updates in near real-time, allowing you to spot trends or viral content as they emerge. If a competitor posts something that starts gaining traction quickly, you'll see the spike immediately rather than waiting for next-day reports.
Keyhole also provides historical analytics, so you can review past campaigns and seasonal trends. The platform includes influencer identification features (showing which accounts drive the most engagement with tracked hashtags) and sentiment analysis for broader social listening.
It's a specialized tool focused more on trend monitoring and campaign analysis than general competitive benchmarking, making it ideal for teams that need fast, actionable intelligence during active campaigns.
Key Features:
① Hashtag & Keyword Tracking: Monitor any Instagram hashtag or keyword to see post volume, reach, impressions, and engagement. Track competitor campaign hashtags to measure their impact and identify top contributors.
② Account Monitoring: Add competitor Instagram profiles to track posting frequency, engagement per post, and follower growth. Generate comparative charts showing performance trends over time.
③ Real-Time Analytics: Data updates quickly, often within minutes. Track viral posts, engagement spikes, or trending hashtags as they happen, not in daily batches.
④ Historical Insights: Access past data to analyze competitor campaigns that have already ended. Review historical performance across weeks or months.
⑤ Influencer Identification: Discover which accounts and influencers engage most with specific hashtags or topics. In competitive context, see which influencers promote competitors or participate in their campaigns.
⑥ Sentiment Analysis: For tracked keywords or hashtags, Keyhole provides sentiment breakdowns (positive, neutral, negative). Useful for measuring brand perception and competitive sentiment.
Pricing:
Keyhole's pricing isn't always publicly listed but typically follows this structure:
Basic Plans: ~$79-$89/month
-
Limited hashtag and account tracking
-
Basic analytics and exports
Professional Plans: ~$199-$299/month
-
Multiple tracking slots (hashtags, accounts, keywords)
-
In-depth analytics and historical data
-
Real-time monitoring
-
Team collaboration features
Enterprise Plans: Custom pricing
-
High-volume tracking
-
Dedicated support
-
Advanced integrations
Keyhole usually offers a free demo or limited trial. Some sources mention a very limited free plan, but full competitive analysis requires paid tiers.
Pros:
Real-Time Monitoring: One of the fastest platforms for live data updates. Ideal for tracking competitors during product launches, events, or trending moments.
Hashtag Specialization: If your competitive strategy involves hashtags or challenges (common on Instagram), Keyhole excels at tracking those metrics.
Flexible Analytics: Use it for social listening, influencer tracking, and competitor account monitoring. It's versatile in what you can track and analyze.
Data Exports: Export data to CSV or PDF for further analysis or reporting. Integrate competitive intelligence into broader business reports.
No Account Connection Required: You don't need to link your own Instagram account to track competitors. Simply input what you want to monitor.
Cons:
Interface Complexity: Keyhole's dashboard is data-heavy, which can feel overwhelming. It's designed for analysts rather than casual users, so there's a learning curve.
Pricing for Full Features: To access real-time tracking, historical data, and multiple tracking slots, costs can rival enterprise tools. Smaller teams may find it expensive.
Limited Competitor Slots on Entry Plans: Basic plans may only allow tracking a few accounts or hashtags simultaneously. If you have many competitors, you'll need higher-tier plans.
6. Phlanx
Overview:
Phlanx is best known for its Instagram Engagement Calculator, a free tool used widely for quick benchmarking of Instagram accounts. It's not a full analytics platform like others on this list, but rather a specialized tool for calculating engagement rates and auditing account quality.
The Engagement Calculator works by analyzing an Instagram account's recent posts (typically the last 12) and calculating the average engagement rate (likes + comments divided by follower count). This gives you a fast snapshot of how actively a competitor's audience engages with their content.
Phlanx also offers Instagram Audit reports that evaluate follower quality (detecting likely fake or inactive followers) and provide deeper breakdowns of engagement patterns. For influencer marketers, this helps identify whether a competitor's growth is organic or artificially inflated.
The platform includes broader features like an influencer marketplace and campaign management tools, but for competitor analysis, its primary value is the quick, free engagement checks. Paid plans unlock more detailed reports and the ability to track multiple accounts over time.
Phlanx is ideal for small businesses or marketers who need occasional competitive benchmarks without committing to expensive monthly subscriptions.
Key Features:
Engagement Rate Calculator: Instantly calculate the engagement rate for any Instagram account. Useful for quick competitive benchmarks (e.g., "Competitor A has 2.8% engagement vs. our 3.5%").
Compare Accounts: With a paid subscription, input multiple handles and generate side-by-side comparison reports of engagement metrics and follower growth.
Audit Reports: Get detailed audits showing follower quality, engagement patterns, average likes/comments, and potential red flags (like suspicious follower spikes).
Influencer Directory: Access a database of influencers and brands in various niches. Discover potential competitors or influencers collaborating with competitors.
Simple Interface: Straightforward, no-frills design. Enter a handle, get results. Minimal learning curve.
Pricing:
Free Tools: The Engagement Calculator is free to use without an account. You can run unlimited one-off checks.
Paid Plans:
-
Basic Plan: ~$49/month (track multiple accounts, run detailed audits)
-
Premium Plan: ~$60/month (additional features, campaign tracking)
-
Business Plan: ~$100/month (team features, bulk audits)
Annual billing typically offers discounts. The free tools (engagement calculator, basic audits) remain available to everyone without subscriptions.
Pros:
-
Free and Fast: The engagement calculator delivers immediate competitive insights at no cost. Run quick checks on any competitor anytime.
-
Beginner-Friendly Pricing: Paid plans are affordable compared to enterprise tools. Accessible for small businesses and solo creators.
-
Simplicity: If you only care about engagement rate as a competitive metric, Phlanx provides exactly that without unnecessary complexity.
-
Influencer Insights: The platform helps identify high-engagement influencers in your niche. Useful for spotting which influencers competitors collaborate with.
-
Multi-Platform: The engagement calculator works for Instagram, TikTok, YouTube, and Twitter. Quickly benchmark competitors across platforms.
Cons:
Limited Depth: Phlanx doesn't provide comprehensive analytics like content performance trends, posting schedules, or historical growth. The competitive benchmarking focuses primarily on engagement rate, which may be too narrow for in-depth analysis.
Manual Tracking: The free tool requires you to manually re-run checks to track competitor changes over time. No automated monitoring unless you subscribe.
Dated Interface: The UI is functional but not modern. It can occasionally feel slow or glitchy.
Basic Reporting: Even paid plans offer simpler reports compared to platforms like Socialinsider or Sprout. If you need presentation-ready competitive analysis decks, Phlanx may not suffice.
7. HypeAuditor
Overview:
HypeAuditor is a premium influencer analytics and fraud detection platform designed for brands and agencies deeply invested in influencer marketing. While it's not purely a competitor analysis tool, its detailed account analytics make it excellent for profiling competitor influencer strategies and benchmarking audience quality.
For Instagram competitor analysis, HypeAuditor provides granular data on any public account: audience demographics (age, gender, location, interests), follower authenticity scores (percentage of real vs. fake followers), engagement trends, and influencer ranking within specific niches.
If competitors work with influencers or if your competitors are influencers, HypeAuditor reveals the quality and composition of their audiences.
The platform excels at detecting fraudulent growth. If a competitor shows suspiciously rapid follower growth, HypeAuditor can identify if those followers are likely bots or bought accounts. This helps you differentiate genuine competitive threats from inflated vanity metrics.
HypeAuditor also includes influencer discovery tools (search millions of accounts by niche, location, engagement rate, etc.) and competitive comparison features that let you benchmark multiple accounts side by side.
Reports are detailed and exportable, making them useful for internal strategy sessions or client presentations.
Key Features:
Audience Quality Score: HypeAuditor analyzes what percentage of an Instagram account's followers are real, active users versus bots, mass followers, or inactive accounts. See if a competitor's growth is legitimate or artificially inflated.
Demographics & Interests: Detailed breakdowns of a competitor's audience by country, city, age, gender, and top interests. Understand who their followers are and whether there's overlap with your target audience.
Engagement & Growth Trends: Historical charts showing follower growth (daily/weekly changes) and engagement rate over time. Compare trends across multiple competitors.
Influencer Discovery & Benchmarking: Search HypeAuditor's database for top accounts in your industry. Filter by follower count, engagement rate, location, and other criteria. Benchmark competitors against industry leaders.
Professional Reports: Generate detailed audit reports for any Instagram account. PDF exports are presentation-ready for stakeholder or client meetings.
Multi-Platform Coverage: Beyond Instagram, HypeAuditor covers YouTube, TikTok, Twitter, and Twitch. Analyze competitor presence across social platforms.
Pricing:
HypeAuditor operates on a premium subscription model:
Basic Plans: ~$299-$399/month
-
Limited reports/searches per month
-
Core analytics features
-
Audience quality and demographics
Advanced Plans: ~$499+/month or custom pricing
-
Higher report quotas
-
Full feature access
-
Campaign tracking and fraud detection
HypeAuditor may use a credit system where each account report consumes credits. Higher plans offer more credits per month. A limited free version or free trial is sometimes available for basic reports.
Pros:
Unmatched Audience Depth: No other tool provides this level of detail about who follows a competitor. Demographics, authenticity, and interest data reveal opportunities others miss.
Fraud Detection: If competitors' growth seems suspicious, HypeAuditor can confirm it by showing follower quality. Differentiate real competitive threats from inflated accounts.
Comprehensive Benchmarking: Compare multiple accounts on audience quality, engagement, growth velocity, and more. Go beyond surface metrics to understand true competitive positioning.
Constantly Updated Data: HypeAuditor maintains a massive database and regularly refreshes profiles. You often don't need to manually query accounts; the data is already available.
Industry Trust: Widely used by top agencies and brands for influencer vetting and competitive research. It's a recognized standard in influencer marketing analytics.
Cons:
High Cost: HypeAuditor is expensive, especially for full feature access. The pricing is justified for influencer marketing professionals but can be overkill if you only need basic competitive benchmarks.
Analytics-Only: It's a pure analytics platform. You can't publish content, manage campaigns, or reply to comments. It complements other tools rather than replacing them.
Learning Curve: The depth of data requires some learning to interpret effectively. Understanding audience authenticity scores or demographic insights takes time.
Credit/Report Limits: Depending on plan, you may have monthly limits on how many accounts you can analyze. If you have dozens of competitors, you'll need a higher tier or make strategic choices about which accounts to track.

How to Choose the Right Tool for Your Needs
Selecting the best tool comes down to matching features to your specific goals, budget, and workflow. Use this step-by-step framework to evaluate options:
1. Define your analysis goals
Start by clarifying what you actually need. Are you looking for quick engagement benchmarks once a month, or do you need continuous monitoring with daily updates?
Is this for a one-time competitive audit, or ongoing strategic planning? A solo creator checking competitors quarterly has very different needs than an agency running competitive reports for ten clients every week.
Write down your specific use case: "I need to track 5 competitors' Reels performance and posting frequency to inform our content calendar" or "We need detailed audience demographics to understand competitor positioning."
2. Check supported metrics
Make sure the tool tracks metrics that matter to you. If follower count and engagement rate are enough, lightweight tools like Phlanx work. If you need reach, impressions, audience demographics, and content theme analysis, you'll need advanced platforms like Socialinsider, HypeAuditor, or Shortimize.
List your must-have metrics. Then eliminate tools that don't provide them. No point paying for a feature-rich platform if it doesn't track what you actually need.
3. Evaluate reporting depth
How will you use the data? If you present competitive findings to executives or clients, prioritize tools with strong visualization and exportable reports (Sprout Social, Socialinsider, HypeAuditor).
If you're analyzing data for internal strategy only, a simpler dashboard (Iconosquare, Keyhole) might suffice.
Check sample reports during trials. Ensure the output format matches your workflow (PDF exports, CSV downloads, shareable dashboards, etc.).
4. Look for real-time updates
Data freshness matters if you monitor live campaigns or trending content. Tools like Keyhole and Shortimize (with hourly refresh on higher tiers) provide near real-time data.
Others update daily or weekly, which works fine for long-term strategic analysis but not for reactive monitoring.
Decide how fresh your data needs to be, then filter tools accordingly.
5. Assess integrations and API access
Consider how the tool fits into your broader workflow. Do you need to pull data into Google Sheets, Tableau, or custom dashboards? Some platforms offer API access (Shortimize's API, for example) or integrations with Slack, Zapier, or product analytics tools (Amplitude, Mixpanel).
If you want automated alerts when competitors hit milestones or integrate social data with other business metrics, check what integrations exist. Tools without APIs or exports limit your ability to build custom workflows.
6. Test usability and visualization
During free trials, pay attention to the interface. Is it intuitive? Can you quickly find the metrics you care about? Are visualizations clear and actionable?
A tool might have all the right features but feel clunky or overwhelming. For example, Keyhole is data-rich but complex; Iconosquare is simpler but less detailed. Choose what matches your comfort level and team's technical sophistication.
7. Compare scalability and pricing
Think ahead. If your needs grow (more competitors to track, additional team members, expanded platforms), can the tool scale without massive cost jumps? Review pricing tiers carefully.
Some tools (like Sprout Social) charge per user, which can get expensive for teams. Others (like Shortimize or Socialinsider) charge based on tracked accounts or data volume.
Calculate what your cost would be at different scale levels (5 competitors vs. 20, solo user vs. 5-person team).
8. Ensure data accuracy and reliability
Trust matters. Research the tool's reputation. Does it use official APIs (more reliable) or scraping (riskier and potentially less accurate)? Check reviews, case studies, or ask for references.
A tool with slightly fewer features but highly accurate data beats a feature-rich platform with unreliable metrics. Your strategy is only as good as the data informing it.
Walk through these steps methodically. You'll likely narrow down to 2-3 options that fit your needs. Take advantage of free trials to test them in your actual workflow before committing.
(And remember: you can start with one tool and switch later if your needs evolve. Many teams use a combination, like a free engagement calculator for quick checks plus a robust platform for monthly deep analysis.)
Start Tracking Instagram Competitors Today
Instagram competitor analysis has moved from "nice to have" to essential for any serious social media strategy. The tools we've covered give you systematic ways to benchmark performance, uncover competitive insights, and spot opportunities before your rivals do.
From lightweight engagement calculators like Phlanx to comprehensive enterprise suites like Sprout Social, each platform serves different needs.
If you want quick competitive checks, free tools work fine. If you're managing agency clients or running large marketing teams, you'll need robust analytics with professional reporting.
And if short-form video performance matters across Instagram, TikTok, and YouTube, a cross-platform solution like Shortimize delivers the unified visibility you need.
The right tool transforms how you approach Instagram strategy.
Instead of guessing what works, you see exactly which content formats drive engagement in your niche, when competitors post for maximum impact, and how your growth compares to industry benchmarks. This intelligence lets you iterate faster, invest in proven tactics, and find white space others overlook.
For brands serious about short-form content, Shortimize offers the competitive edge that comes from tracking all major platforms in one dashboard. Start your 7-day free trial to see how your Instagram Reels performance stacks up against competitors, monitor their posting patterns, and spot viral content trends across TikTok, Instagram, and YouTube Shorts simultaneously.
Stop flying blind. Start tracking competitors systematically, and turn competitive intelligence into your strategic advantage.
Explore more resources:
-
Shortimize Features for detailed cross-platform analytics capabilities
-
Free AI Tools for content creators to test new formats inspired by competitive research
-
Pricing Plans to find the right tracking capacity for your needs
-
Customer Stories showing how growth teams use competitive analytics daily