Running user-generated content campaigns without proper measurement is like driving blindfolded. You might move forward, but you have no idea if you're heading in the right direction.
Most teams are measuring UGC campaigns wrong. They count views, celebrate likes, and move on. But views changed on YouTube Shorts in March 2025 (they now count as soon as a Short starts to play), and Instagram deprecated impressions and Reel plays in April 2025, replacing them with "views" metrics. Plus, Meta has been standardizing "views" as a primary metric across formats, where a view can count repeated exposures.
Translation? Your metrics aren't as stable as you think. What looked like growth might just be a definition change.
This guide cuts through the noise. We'll show you how to measure UGC campaign success using metrics that actually matter, build systems that separate signal from noise, and prove ROI without getting trapped by vanity metrics or platform accounting tricks.
Why UGC Metrics Matter More Than Vanity Numbers
You don't need another article telling you "UGC builds trust." You know that. What you need is a framework that answers three questions clearly:
Did the campaign create incremental value? Not correlation. Causality.
What caused the results? So you can repeat wins and avoid mistakes.
What should we do now? Scale, iterate, or kill the campaign?
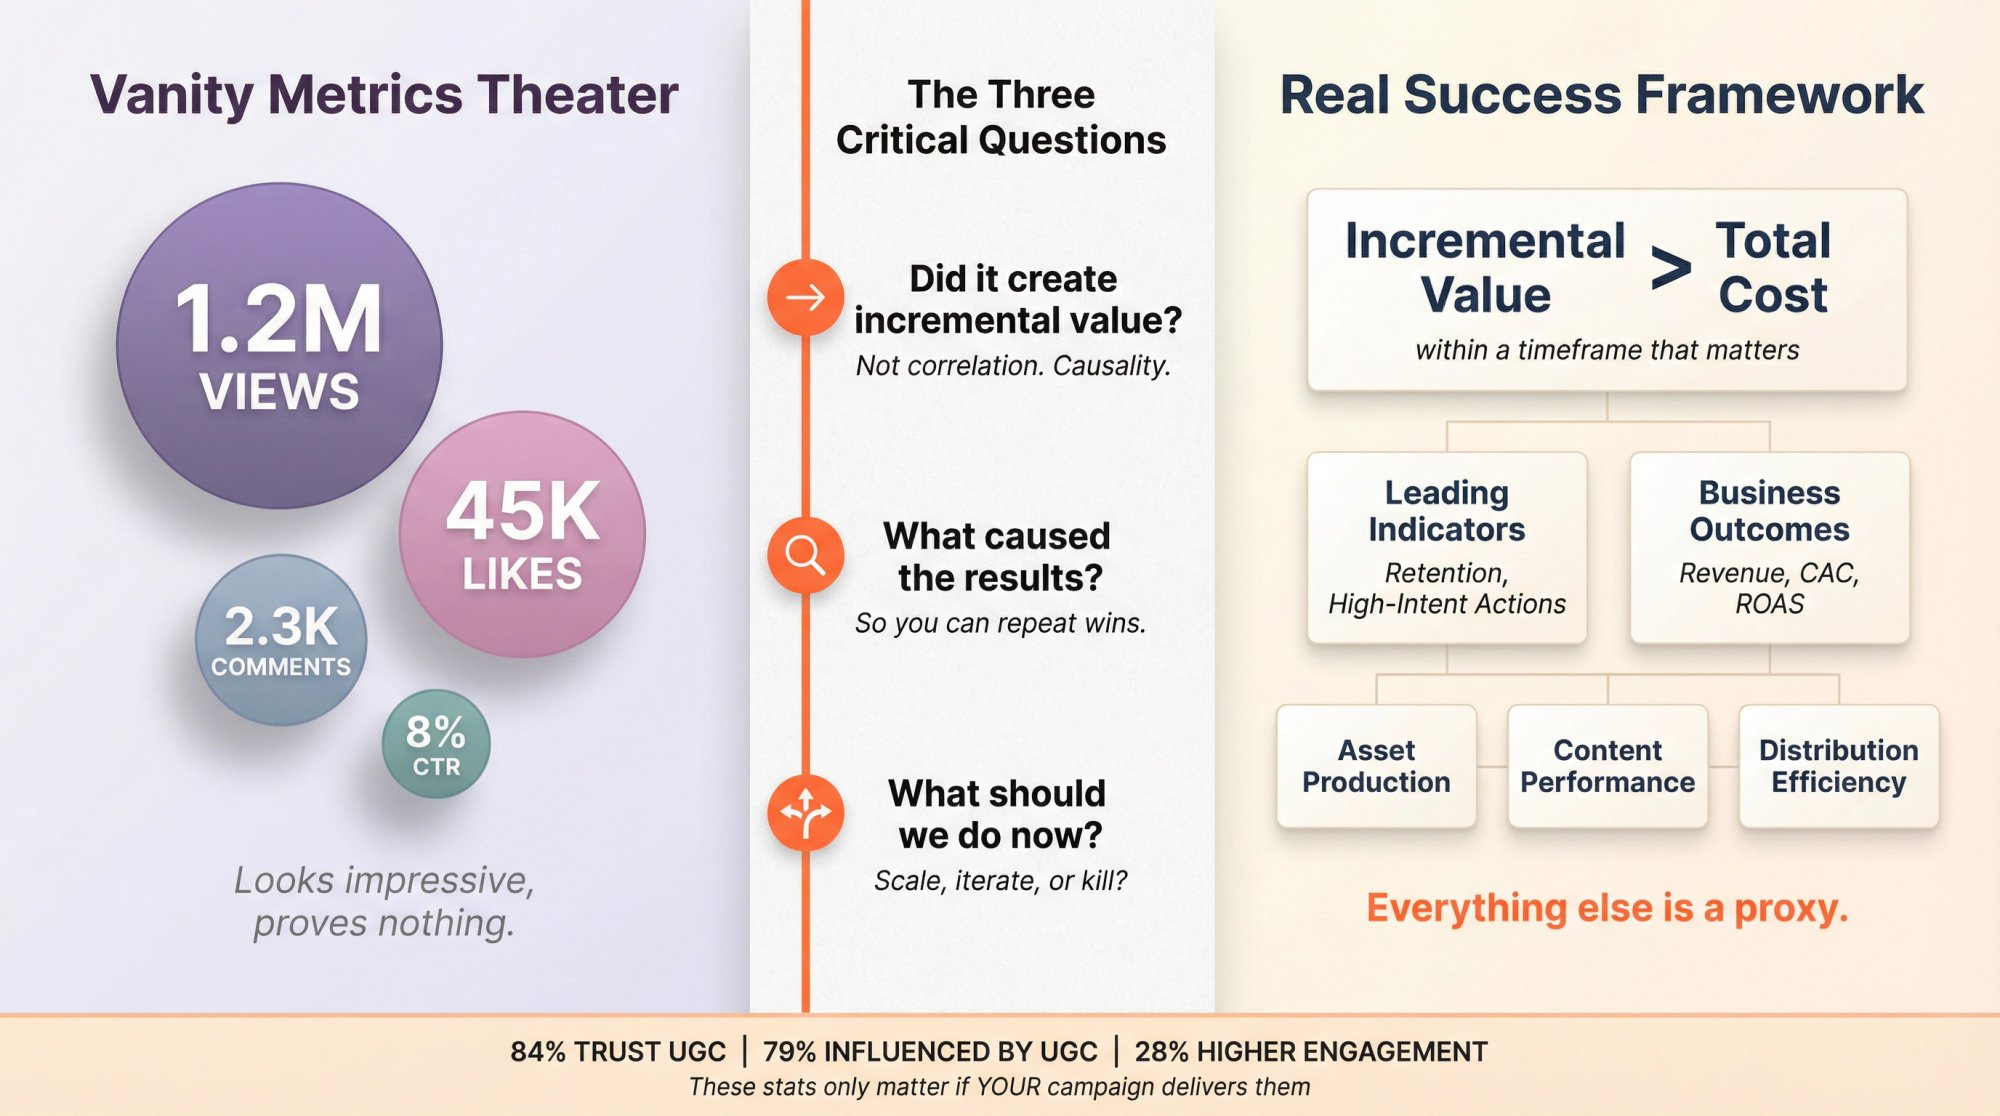
The data backs up why this matters. Research shows that 84% of consumers trust content from real people over polished brand ads, and 79% say UGC highly influences their buying decisions. Social posts from real customers deliver about 28% higher engagement than traditional brand content.
Most reports won't tell you this: those stats mean nothing if you can't measure whether your campaign delivered those results.
Your UGC campaign isn't successful because it exists. It's successful when it creates incremental value that exceeds its total cost, within a timeframe that actually matters to your business.
Everything else (views, likes, comments, even CTR) is a proxy.
What Type of UGC Campaign Are You Running?
Before diving into metrics, you need to understand what type of UGC campaign you're actually running. Measurement gets messy because people lump very different things under "UGC," and the goal and data access change dramatically.
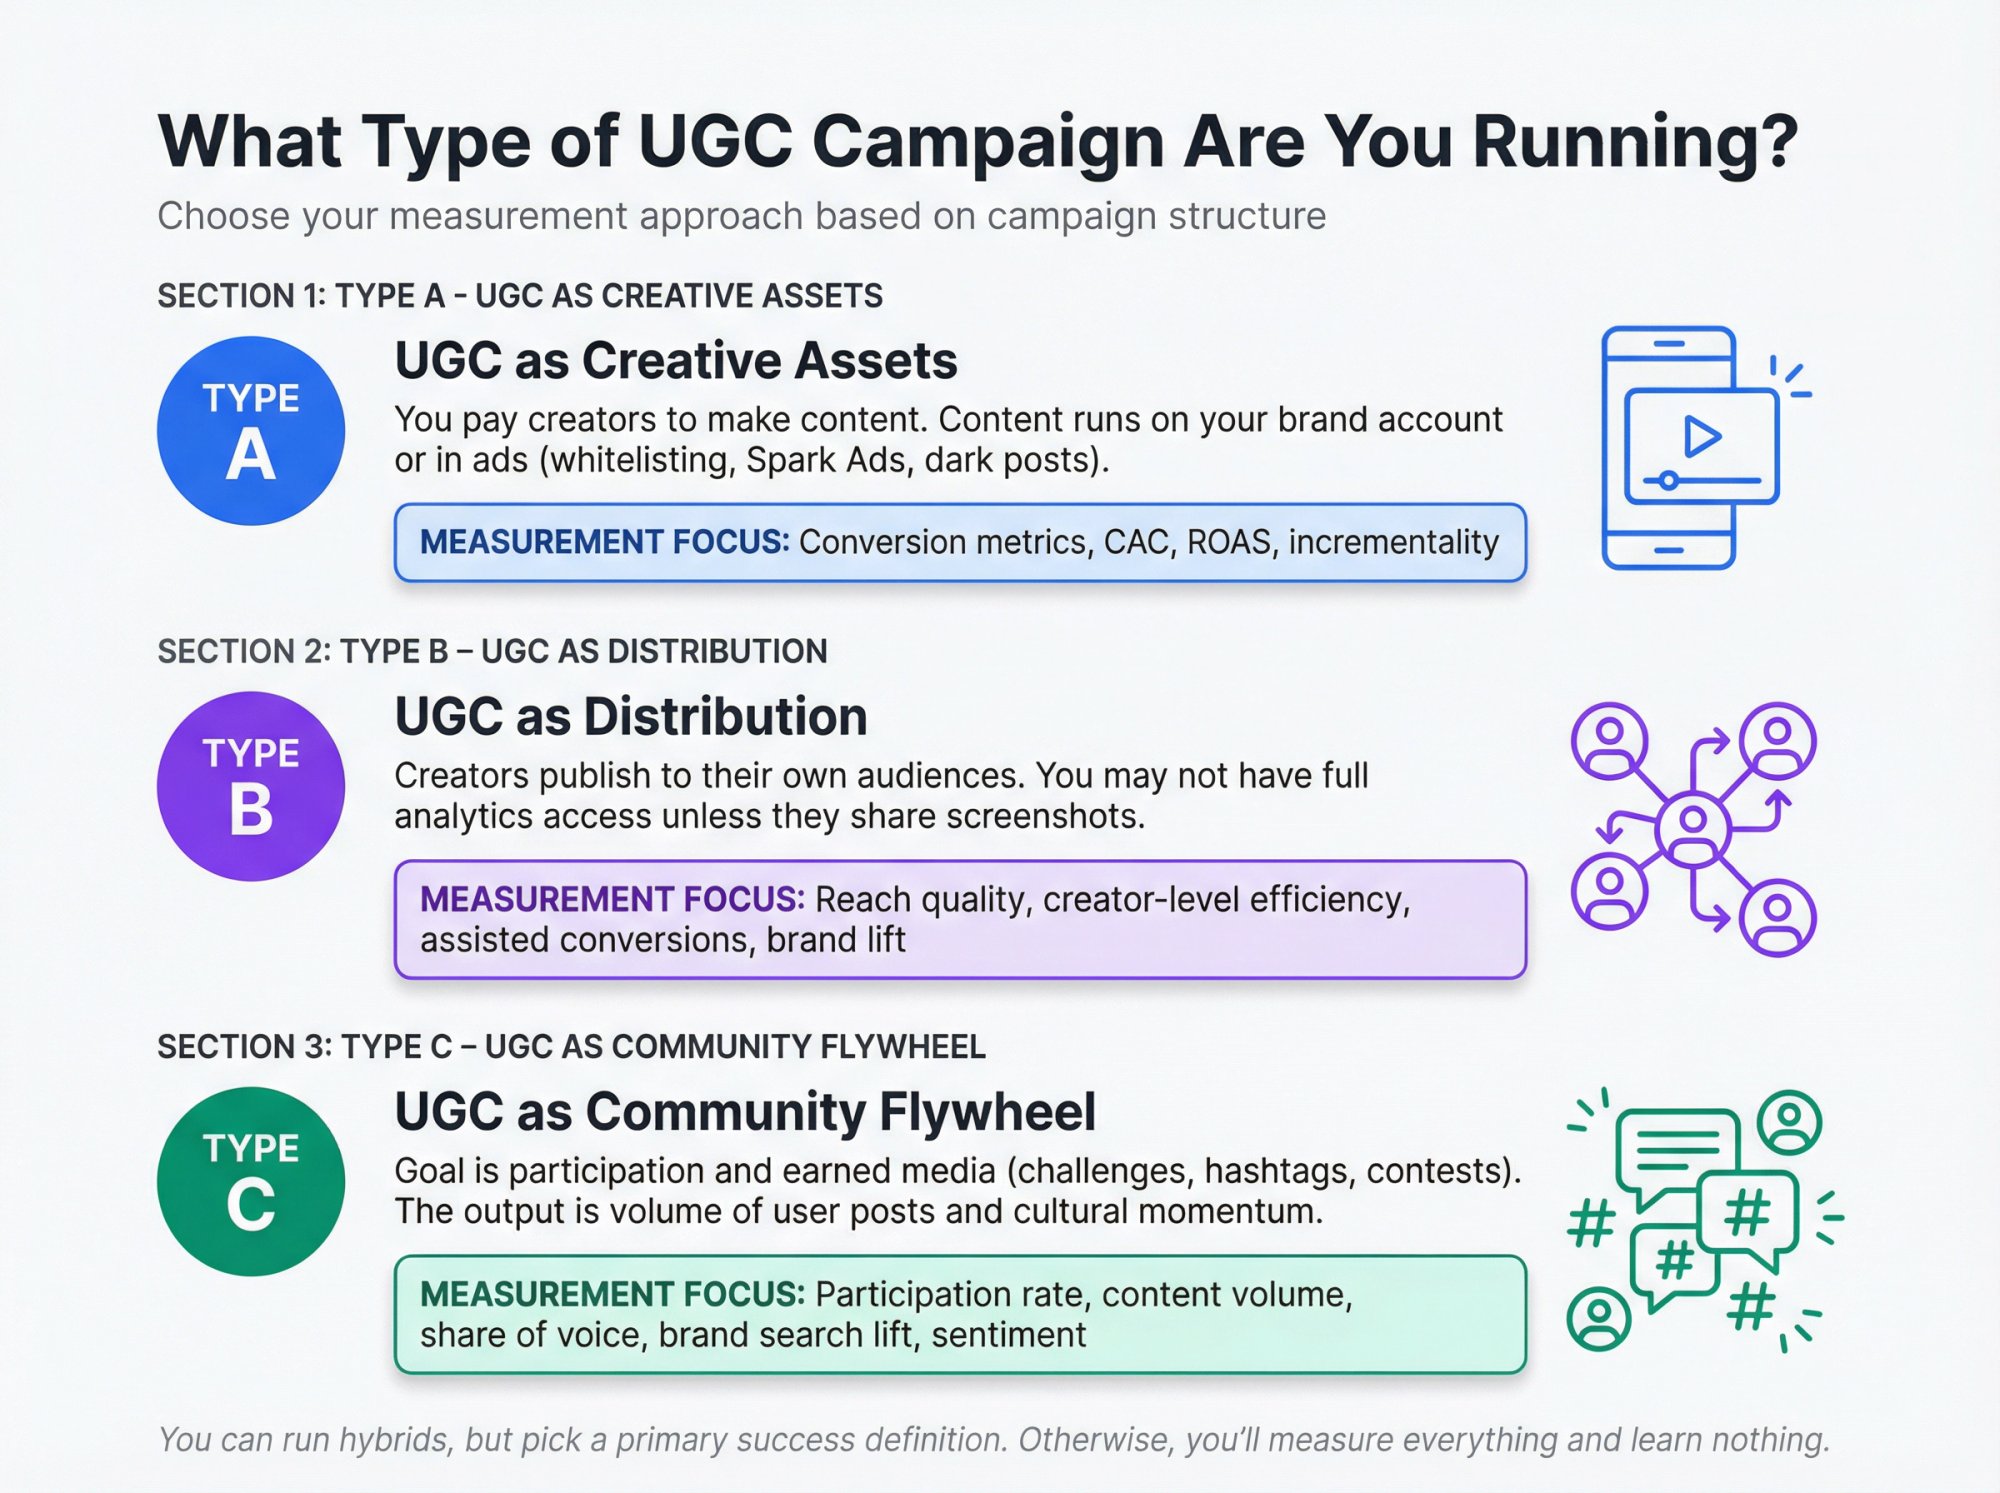
Type A: UGC as Creative Assets
You pay creators to make content. The content usually runs on your brand account or in ads (whitelisting, Spark Ads, dark posts).
→ Measurement center of gravity: Conversion metrics, CAC, ROAS, incrementality.
Type B: UGC as Distribution
Creators publish to their own audiences. You may not have full analytics access unless they share screenshots.
→ Measurement center of gravity: Reach quality, creator-level efficiency, assisted conversions, brand lift.
Type C: UGC as Community Flywheel
Goal is participation and earned media (challenges, hashtags, contests). The "output" is a volume of user posts and cultural momentum.
→ Measurement center of gravity: Participation rate, content volume, share of voice, brand search lift, sentiment, downstream conversions.
You can run hybrids, but you still need to pick a primary success definition. If you don't, you'll measure everything and learn nothing.
Why You Can't Trust Platform "Views" Anymore
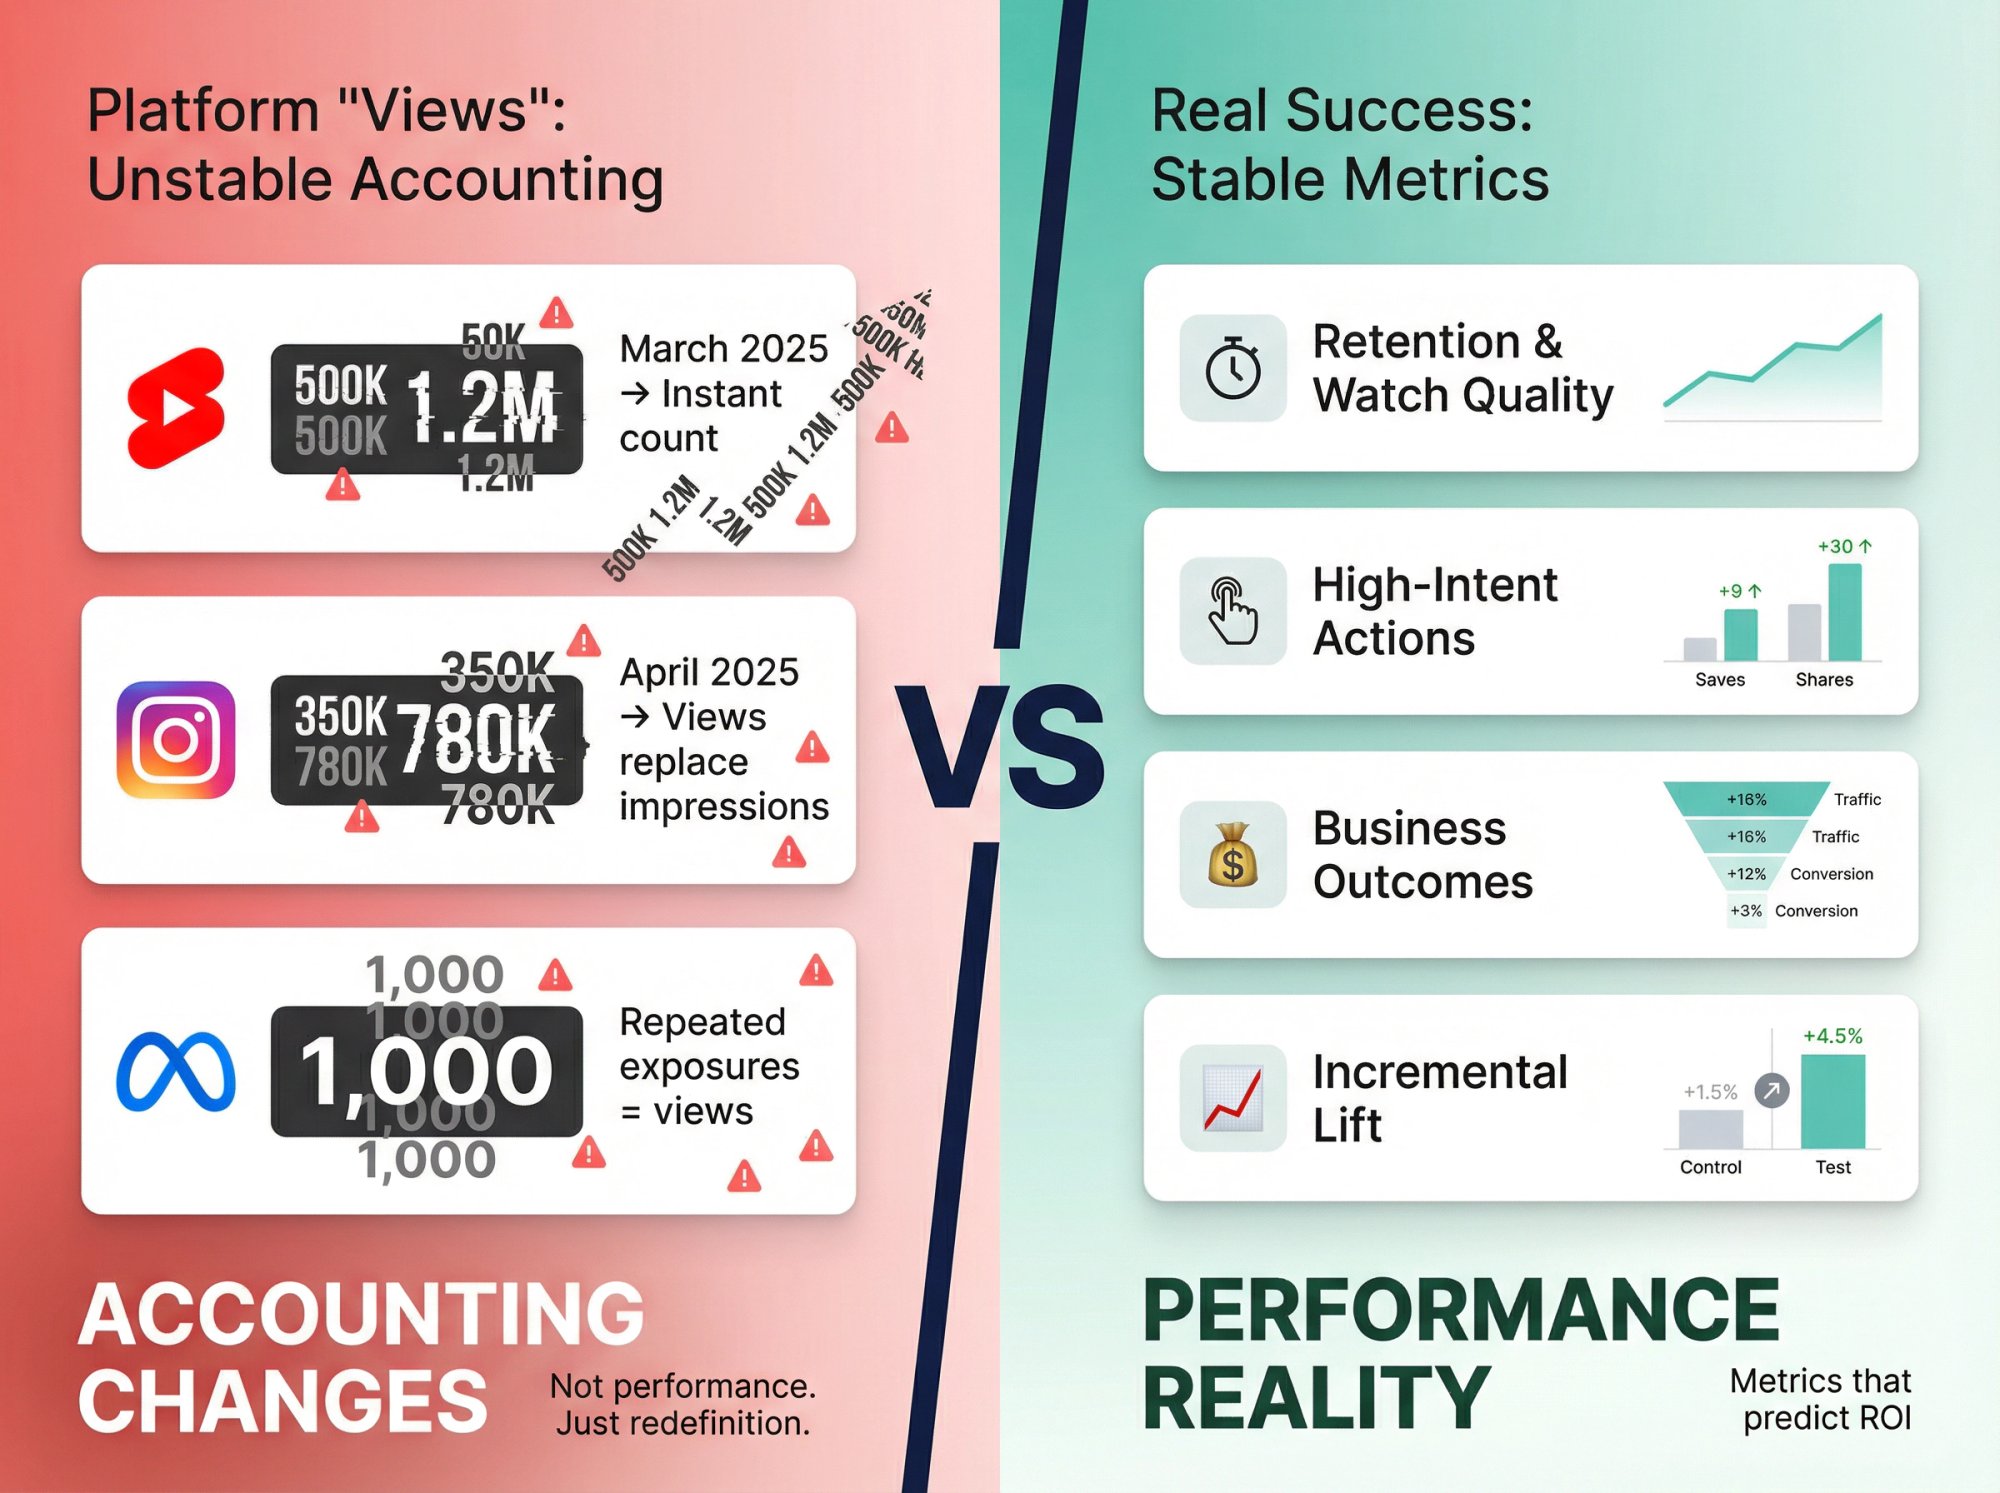
Platform "views" are no longer a stable unit of measurement. They're a UI choice, not a performance metric.
YouTube Shorts changed how views are counted starting March 31, 2025. A Shorts view now counts as soon as a Short starts to play or replay, even if someone scrolls past quickly. YouTube kept the old metric as "engaged views" in analytics.
Your Shorts "views" may jump without your content getting better. That's not performance. That's accounting.
Meta moved to "views" as the primary metric across formats, and a view can count repeated exposures. "Views" is drifting closer to "exposures," not "people reached."
Instagram's API reporting changed around April 2025. Impressions and Reel plays were deprecated and replaced by views metrics in many tools.
If your team reports year-over-year based on older metrics, you can accidentally manufacture a performance drop or increase that's purely definitional.
What Metrics Should You Track Instead of Views?
Treat "views" like a top-of-funnel exposure signal, not success.
For actual success, you need:
Retention and watch quality (average watch time, completion rate)
High-intent actions (shares, saves, profile visits, link clicks)
Business outcomes (signups, purchases, revenue)
Incremental lift (when needed)
The 4 Layers of UGC Campaign Success
A UGC campaign is a pipeline. If you only measure the last step, you miss the bottlenecks.
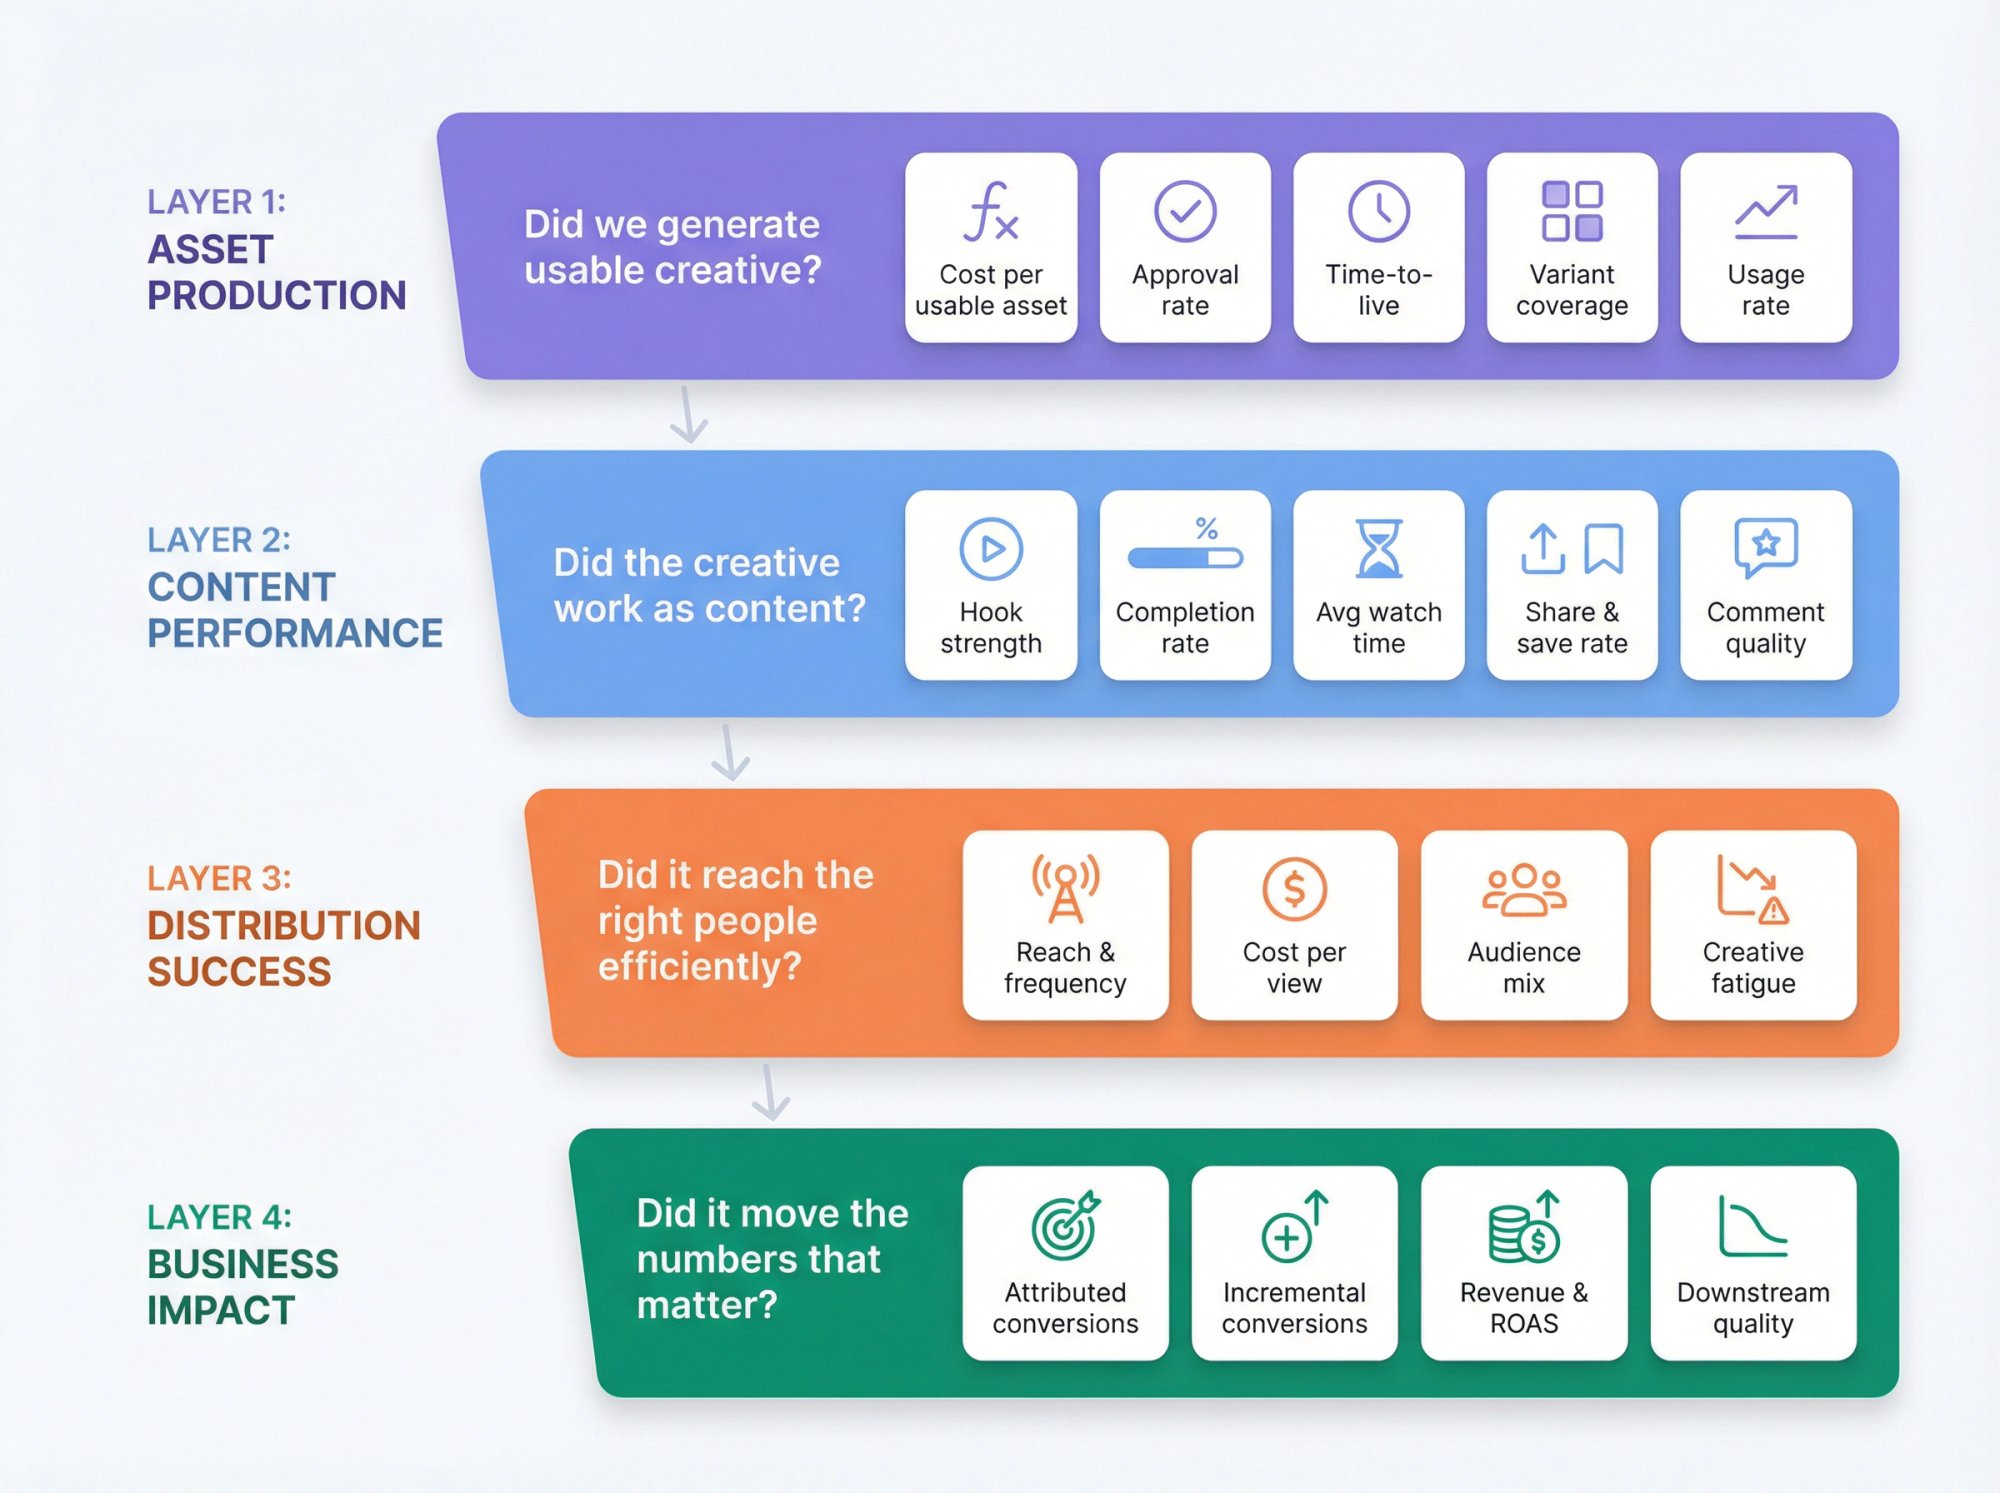
Layer 1: How to Measure Asset Production Success
Did we generate usable creative?
This is where UGC campaigns quietly fail. You pay, but the content is unusable, late, off-brief, or non-compliant.
Track:
Cost per usable asset = total creator cost ÷ approved assets
Approval rate = approved assets ÷ delivered assets
Time-to-first-draft and time-to-live
Variant coverage = how many hooks, CTAs, styles, personas did we actually produce?
Usage rate = assets that actually got posted or spent behind ÷ total assets
If you don't measure this, you can't improve creator sourcing and briefing.
Layer 2: How to Measure Content Performance Success
Did the creative work as content?
This is where you judge whether the video is good, independent of media buying.
Track:
Hook strength (early retention, 2-second views ÷ video starts)
Completion rate (100% completions ÷ video starts)
Average watch time (seconds)
Share rate and save rate (per 1,000 views)
Comment quality (not count; are comments "where can I get this?" or "cringe"?)
Layer 3: How to Measure Distribution Success
Did it reach the right people efficiently?
Track:
Reach and frequency (especially in paid)
Cost per view / cost per engaged view
Audience mix (new vs returning viewers, geo, placements where possible)
Diminishing returns / creative fatigue
Layer 4: How to Measure Business Impact Success
Did it move the numbers that matter?
Track:
Attributed conversions (UTMs, codes, pixels)
Incremental conversions (lift tests / geo holdouts when justified)
Revenue, CAC, ROAS
Downstream quality (activation, retention, refund rate)
How to Build a KPI Tree for UGC Campaigns
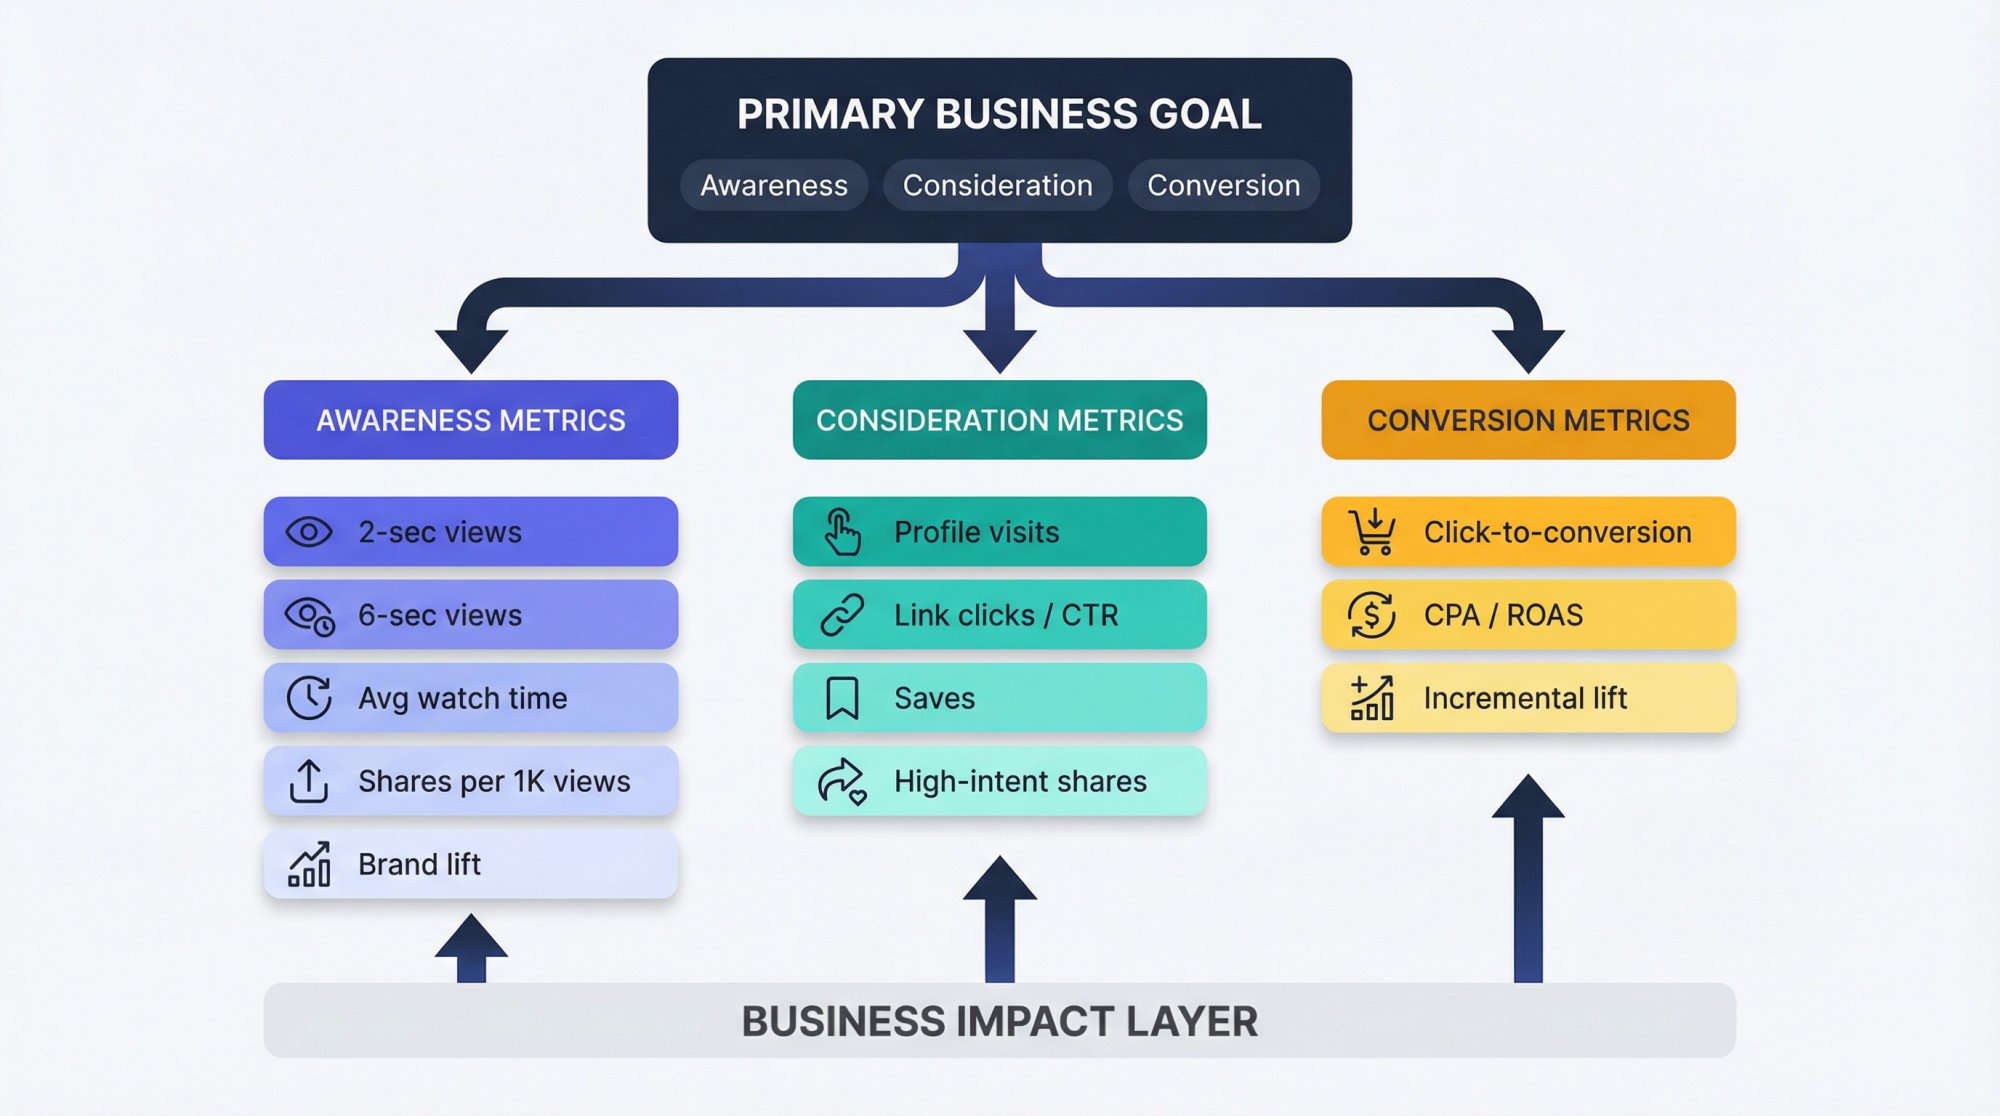
A KPI tree forces clarity. Every "content metric" exists only to predict a business outcome.
① Choose Your Primary Campaign Goal
Pick one primary goal or you'll argue forever:
Awareness (you want more relevant people to know you exist)
Consideration (you want them to engage, visit, click, install)
Conversion (you want purchases, signups, revenue)
② Define the Win Condition in One Sentence
Examples:
"This campaign is a win if it drives 1,000 incremental trials at less than $12 incremental CPA."
"This campaign is a win if it increases branded search volume by 20% and lifts ad recall."
③ Add Leading Indicators That Predict the Goal
Strong defaults for short-form UGC:
If the goal is awareness:
2-second views, 6-second views
Average watch time
Shares per 1,000 views
Brand lift (if you run it)
If the goal is consideration:
Profile visits
Link clicks / CTR
Saves, shares (high-intent sharing matters more than likes)
If the goal is conversion:
Click-to-conversion rate
CPA / ROAS
Incremental lift test results (when feasible)
Which UGC Metrics Actually Predict Success?
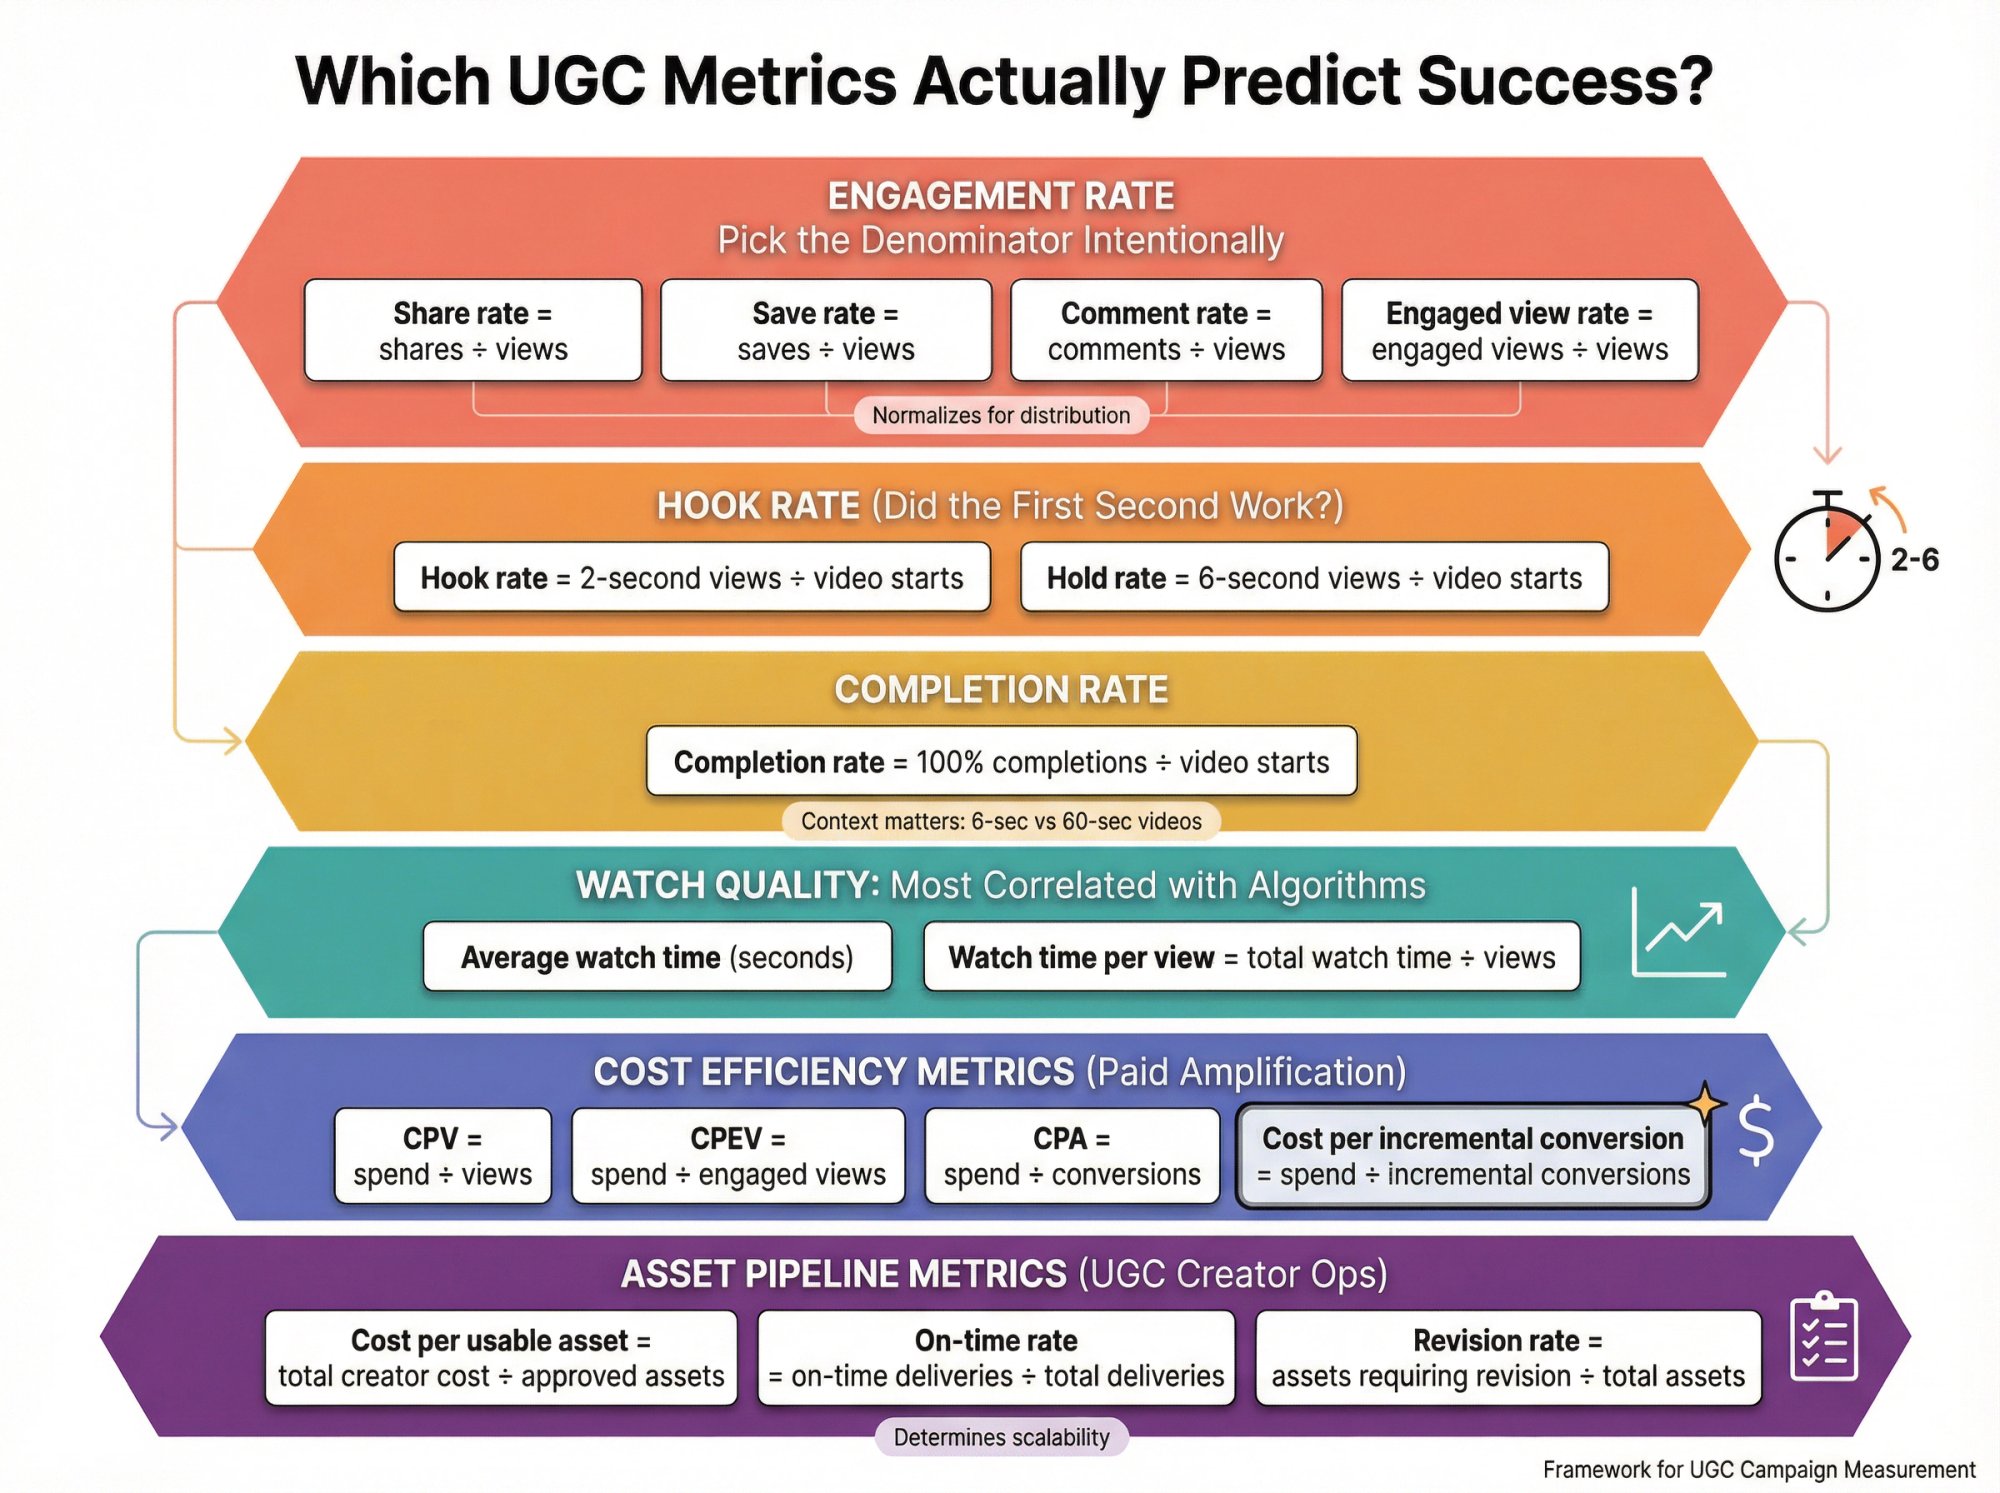
1) Engagement Rate: Pick the Denominator Intentionally
This sounds basic, but it's where teams get fooled.
Industry benchmarks might define engagement rate differently across platforms, which is useful for comparing accounts, not necessarily for campaign ROI.
Recommended for UGC creative evaluation: Use per-view rates when you can, because they tie actions to exposure.
Share rate = shares ÷ views
Save rate = saves ÷ views
Comment rate = comments ÷ views
Engaged view rate (if available) = engaged views ÷ views
Why this works: it normalizes for distribution so you can evaluate creative quality.
2) Hook Rate (Did the First Second Work?)
For paid placements, platforms often provide short view thresholds.
Hook rate = 2-second views ÷ video starts
Hold rate = 6-second views ÷ video starts
If you can't get "starts," use views as a rough proxy.
3) Completion Rate
Completion rate = 100% completions ÷ video starts
Completion rate isn't "always good." A 6-second video should have high completion. A 60-second narrative might win with lower completion but strong watch time.
4) Watch Quality: The Metric Most Correlated with Recommendation Systems
Average watch time (seconds)
Watch time per view = total watch time ÷ views
When "views" definitions shift, watch time tends to remain a better signal.
5) Cost Efficiency Metrics (for Paid Amplification)
CPV (cost per view) = spend ÷ views
CPEV (cost per engaged view) = spend ÷ engaged views
CPA (cost per acquisition) = spend ÷ conversions
Cost per incremental conversion = spend ÷ incremental conversions (best, when you can measure incrementality)
6) Asset Pipeline Metrics (UGC Creator Ops)
These determine whether you can scale UGC sustainably:
Cost per usable asset = total creator cost ÷ approved assets
On-time rate = on-time deliveries ÷ total deliveries
Revision rate = assets requiring revision ÷ total assets
If you don't measure these, your "UGC program" becomes chaos as it grows.
When to Call a UGC Video a Winner (or a Dud)
Short-form distribution has fast feedback loops, but not instant truth.
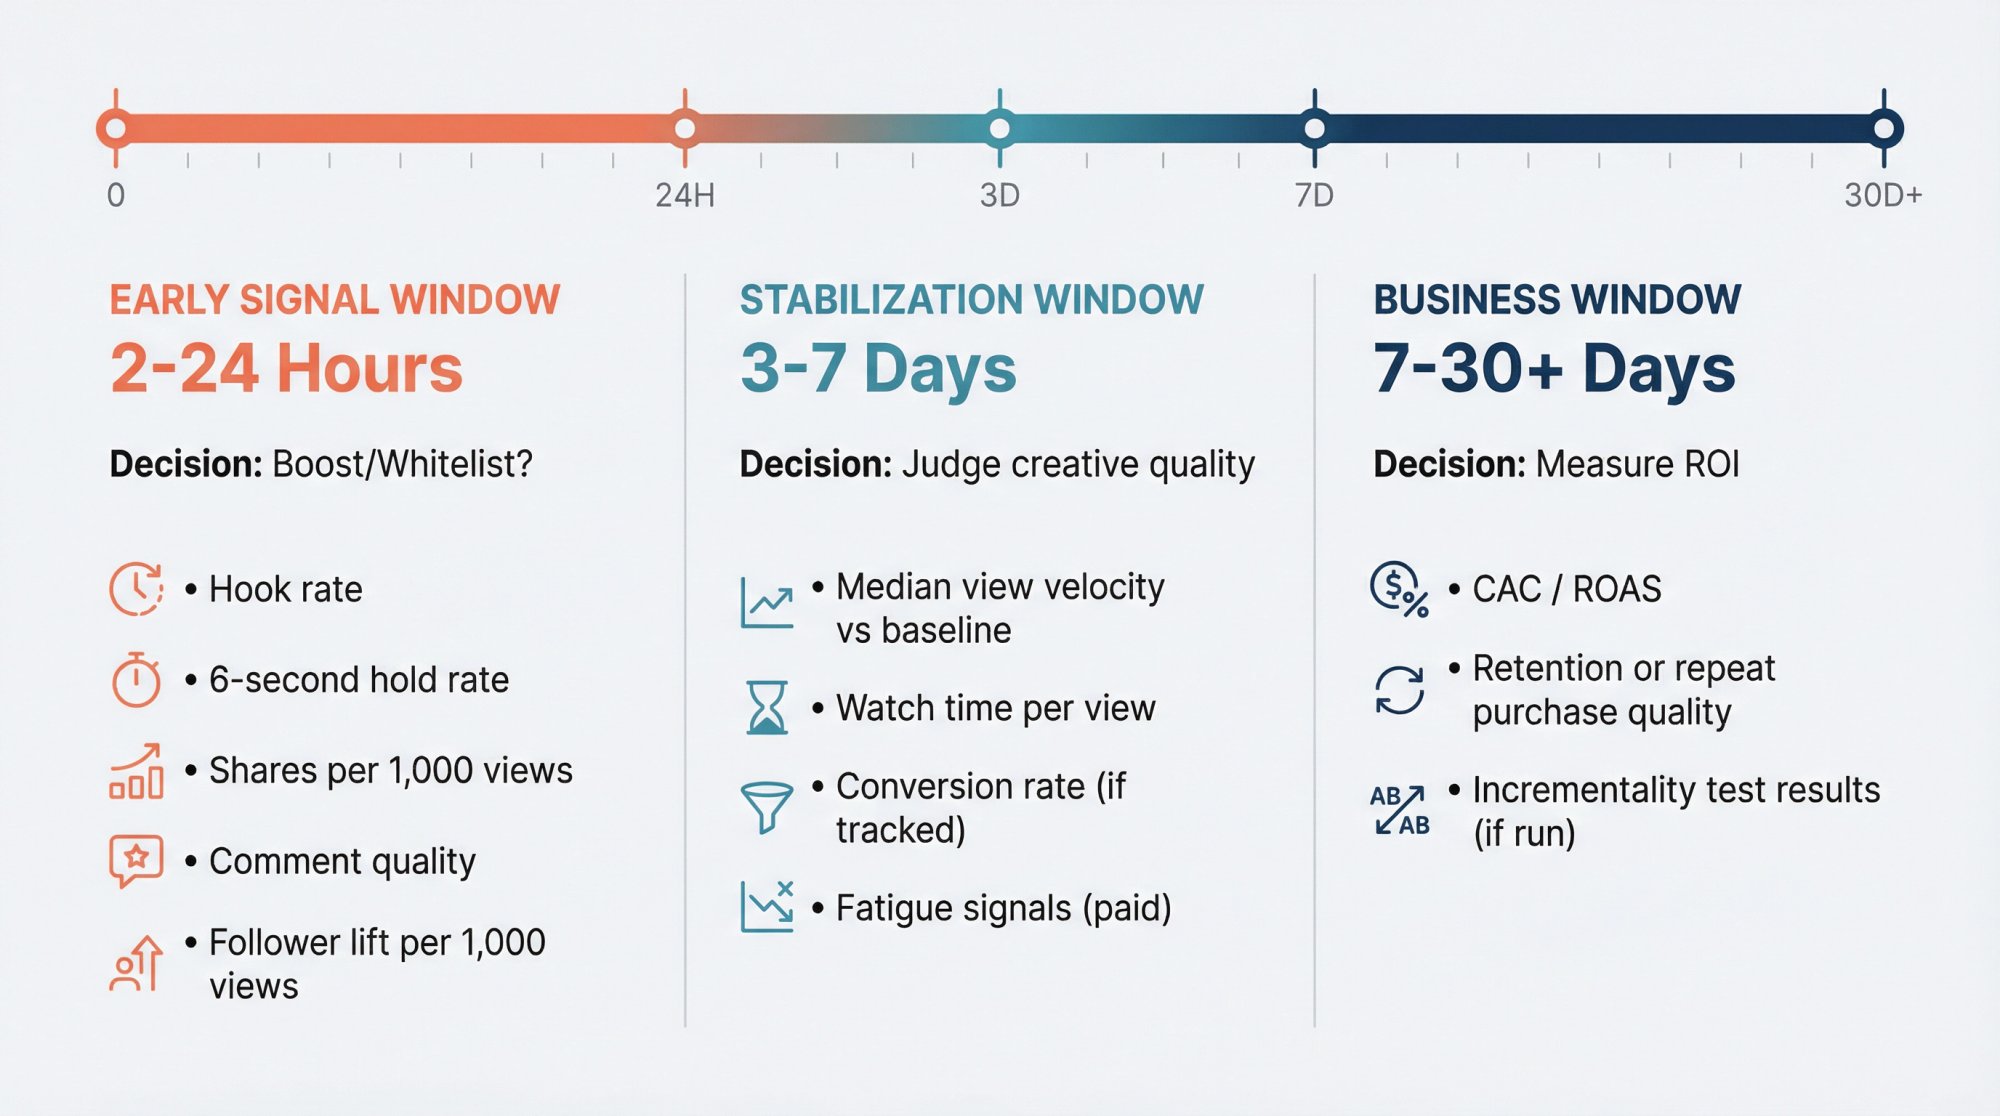
The Early Signal Window (First 2 to 24 Hours)
Use this to decide whether to boost/whitelist/clone the hook:
Hook rate
6-second hold rate
Shares per 1,000 views
Comment quality
Follower lift per 1,000 views (if posting on brand)
The Stabilization Window (3 to 7 Days)
Use this to judge creative more fairly:
Median view velocity vs your baseline
Watch time per view
Conversion rate (if tracked)
Fatigue signals (paid)
The Business Window (7 to 30+ Days)
Use this to judge ROI:
CAC / ROAS
Retention or repeat purchase quality
Incrementality test results (if run)
Attribution vs Incrementality: Which One Do You Need?
| Measurement Type | What It Answers | Tools | When to Use |
|---|---|---|---|
| Attribution | "What path did users take?" | UTMs, pixels, promo codes, MMPs, multi-touch | Fast iteration, creative tweaks, understanding customer journey |
| Incrementality | "What happened because of the campaign?" | Lift tests, geo holdouts, randomized experiments | Scaling decisions, proving causality, 2-10x budget increases |
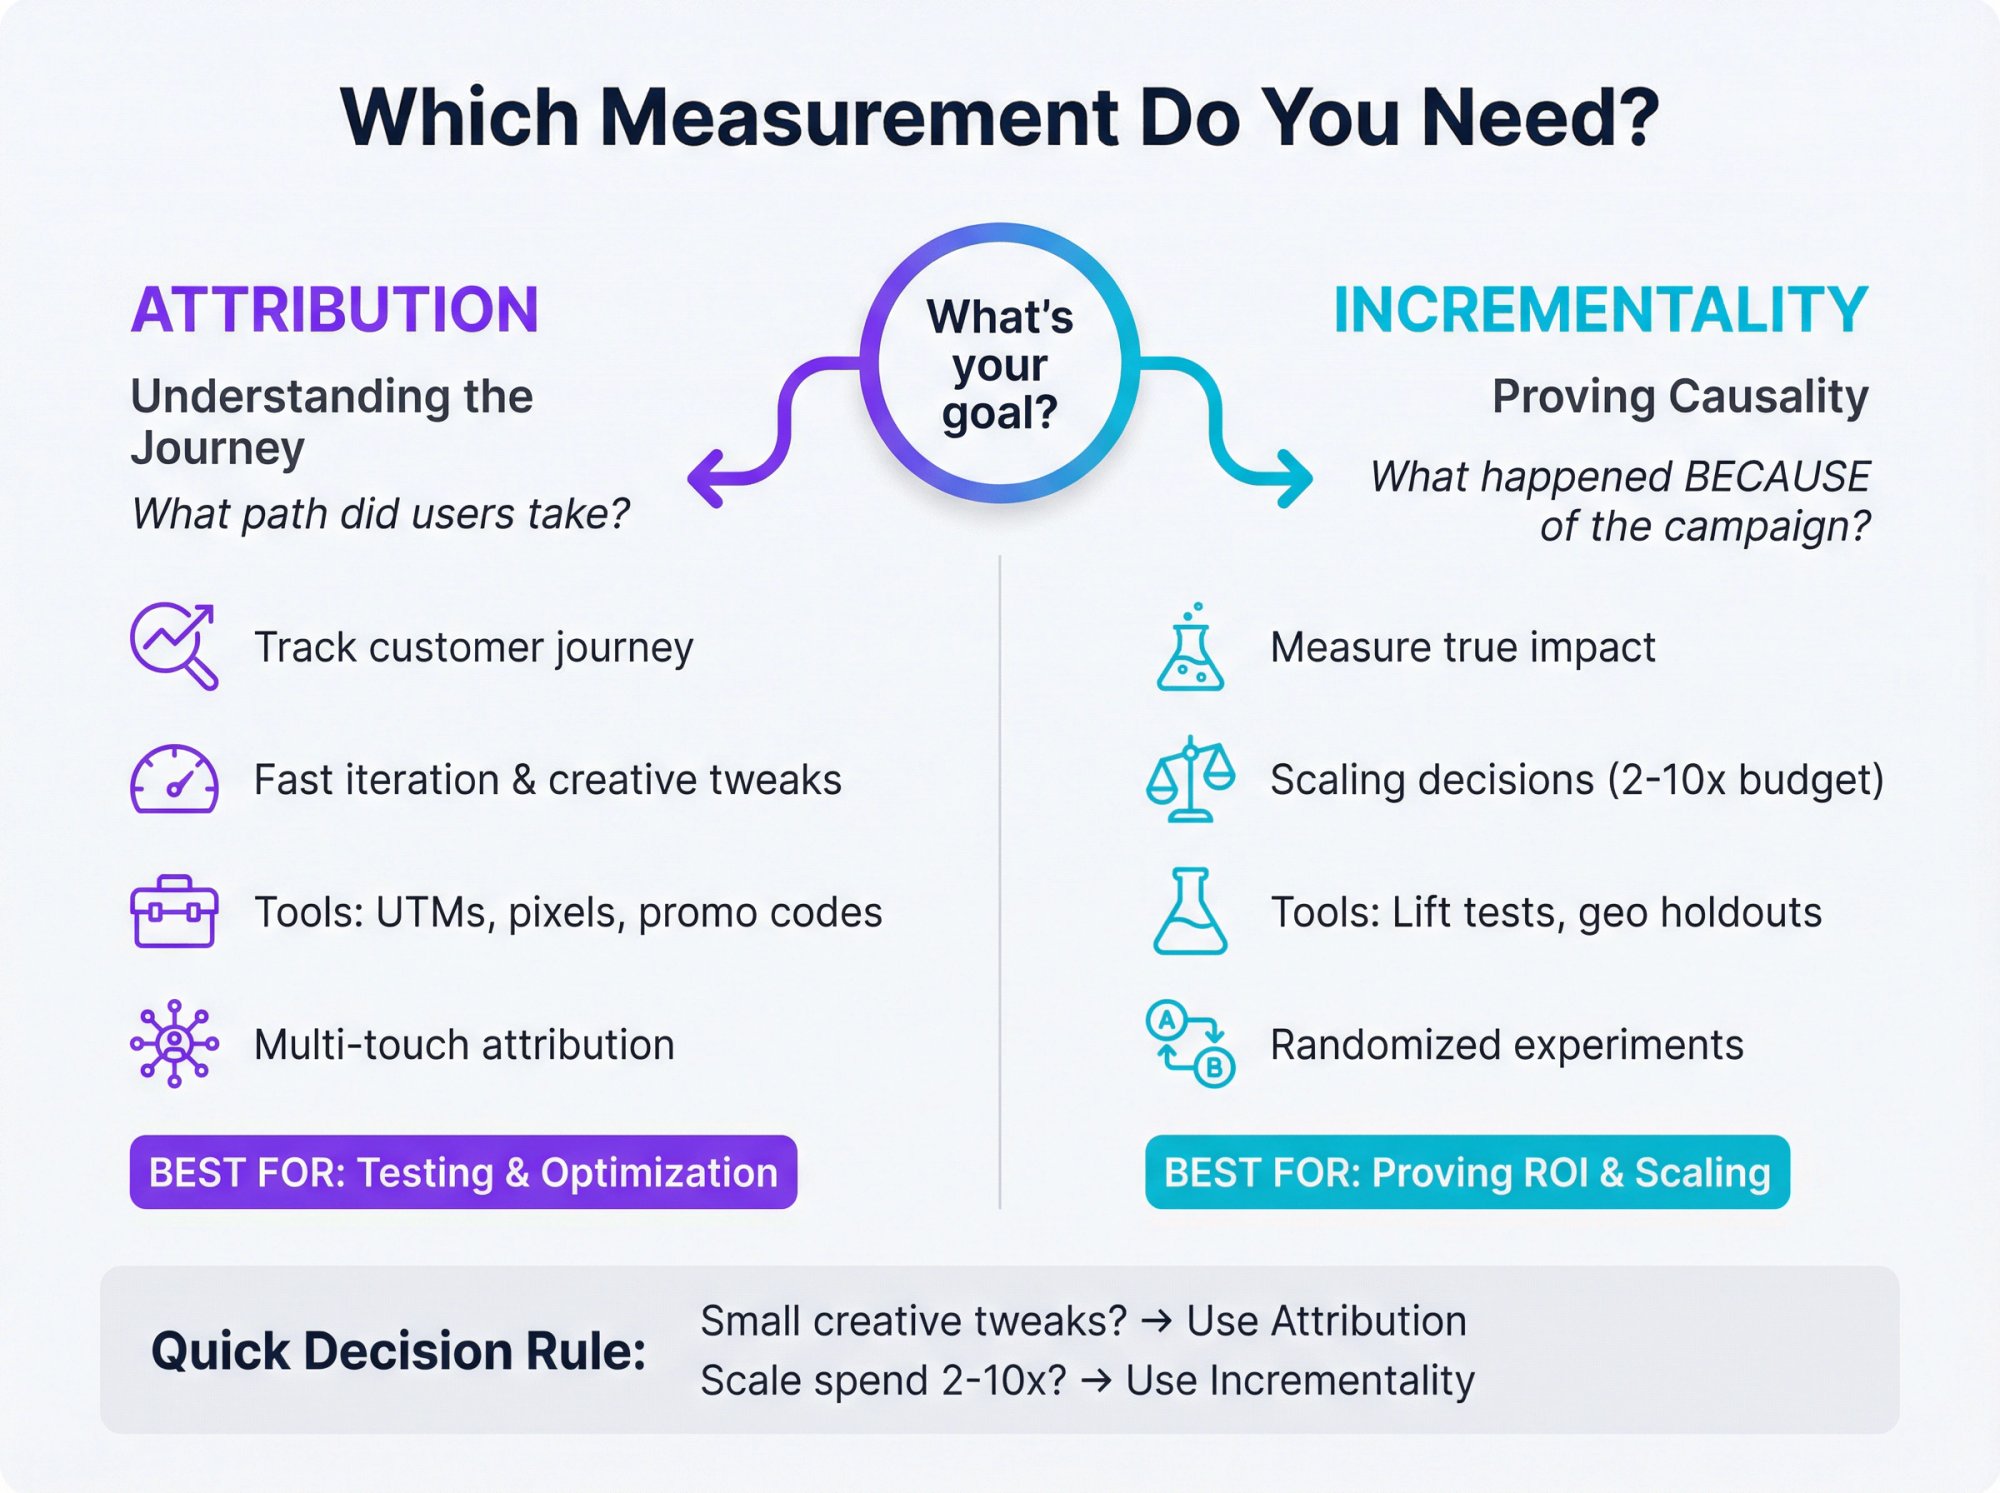
Rule of thumb:
If you're deciding between small creative tweaks, attribution is usually enough.
If you're deciding whether to scale spend 2 to 10x, you want incrementality.
How to Measure Incremental Lift for UGC Campaigns
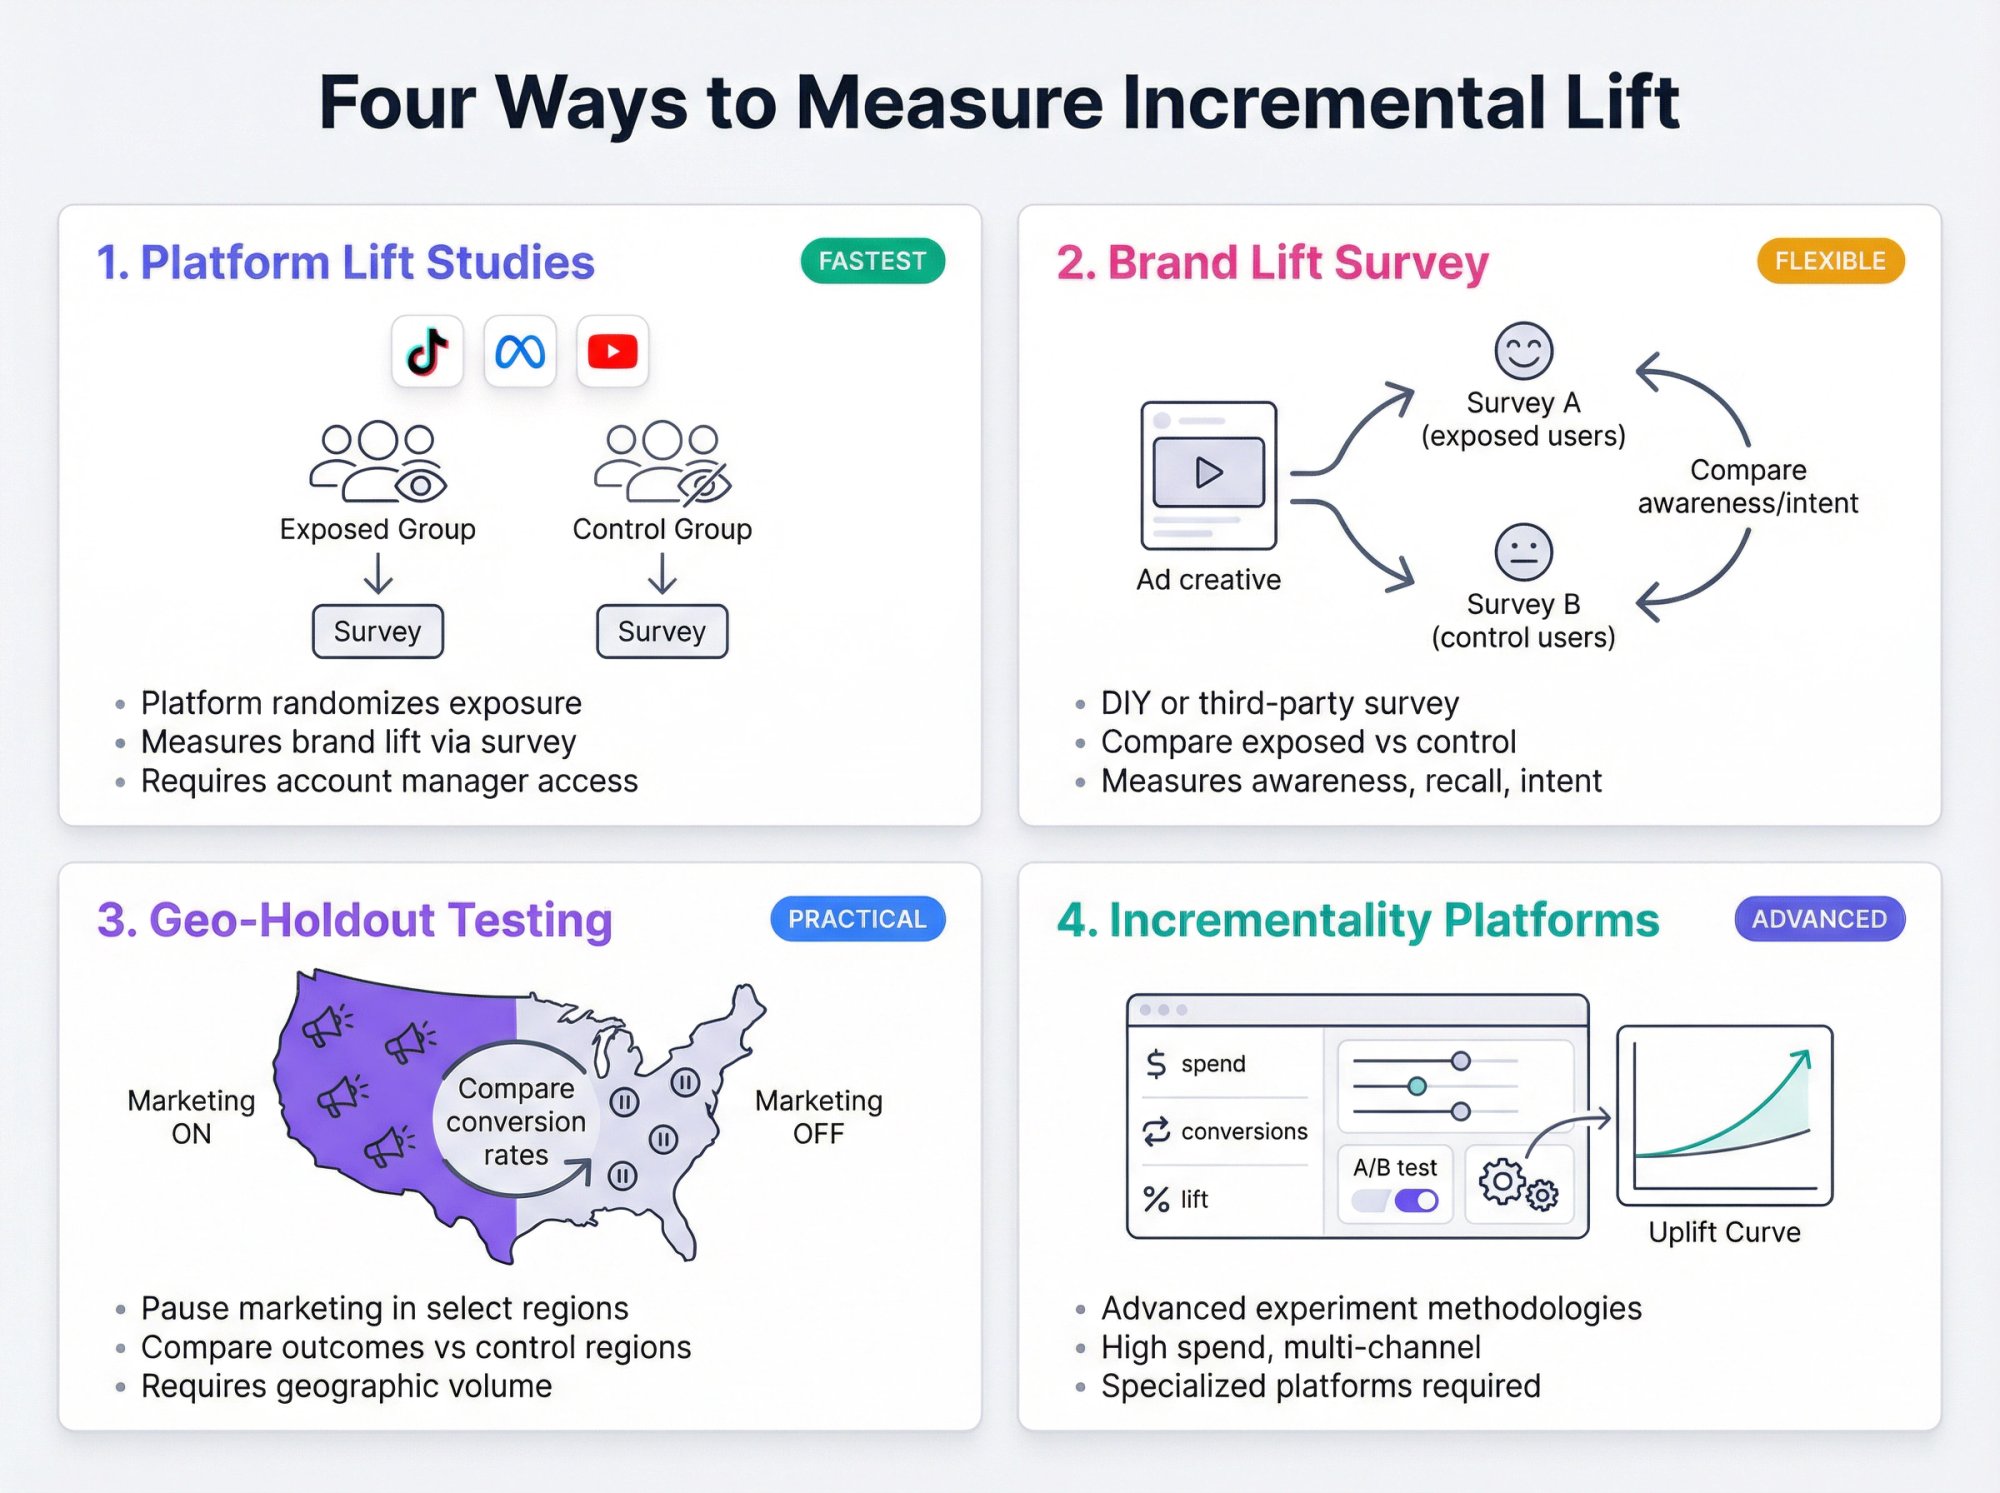
Option 1: Platform Lift Studies (Fastest, If You Qualify)
TikTok Brand Lift Study runs alongside sponsored content to measure incremental brand impact (TikTok notes it can only be set up by an account manager as of its April 2025 update)
Meta-managed Brand Lift tests exist if you work with a Meta representative
Google has been expanding measurement in the Shorts environment, including Brand Lift surveys in Shorts
These are great when you can access them because the platform can randomize exposure more cleanly than you can.
Option 2: Randomized Brand Lift Survey (DIY or Third-Party)
A brand lift study is basically: show surveys to people exposed to ads vs a control group and compare awareness/recall/intent.
Option 3: Geo-Holdout Testing (Practical for Many Brands)
Geo-holdout testing: pause or reduce marketing activity in certain regions and compare outcomes vs control regions.
This is powerful when:
You have enough geographic volume
Your conversion tracking is solid
Your business isn't heavily seasonal week-to-week
Option 4: Incrementality Experiments Platforms (Advanced)
If you are already sophisticated (high spend, lots of channels), you can use specialized incrementality and geo experiment methodologies.
What Do Good UGC Metrics Look Like in 2026?
Benchmarks are useful for sanity checks, not for declaring victory.
Industry benchmark reports analyzing millions of posts across TikTok, Instagram, Facebook, and X provide directional insights for engagement rates.
Directional takeaways from recent reports:
| Platform | Engagement Rate (2025) | Trend |
|---|---|---|
| TikTok | 3.70% | Up YoY |
| 0.48% | Roughly flat | |
| 0.15% | N/A |
The trap here: engagement rate definitions vary by platform. In these reports, Instagram engagement rate is likes plus comments divided by followers, while TikTok includes likes, comments, shares, and saves divided by followers.
Also note: broader reports show engagement volatility with significant engagement rate declines on several platforms over the prior year.
Use Benchmarks Like This:
Compare your account vs your history first
Compare against benchmarks only after aligning definitions
Use benchmarks to set ranges, not targets
High-value benchmark move: Build your own internal benchmark set:
Your past 90 days
Paid vs organic split
That becomes your true performance compass.
Your Pre-Launch Measurement Checklist
Before Launch: Instrumentation (Do This or Your "ROI" Will Be Fiction)
1) Creative ID System
Every asset gets an ID (UGC-001, UGC-002…)
Track hook, CTA, persona, offer, length, creator
2) Attribution Plumbing
UTMs for every link
Unique codes per creator if you sell direct
Pixel events or MMP events mapped to a conversion definition
3) Baseline Definition
What would "normal" have been without the campaign?
Pick a pre-period or comparable cohort
4) Decision Rules
What early metrics trigger boosting?
What triggers killing a creative?
What triggers a creator re-hire?
During Launch: Monitoring
Watch early signals (hook, hold, shares). If a video wins, your job is to replicate the underlying structure, not worship the exact edit.
After Launch: Reporting That Drives Decisions
Your report should include:
What happened (content and business outcomes)
What caused it (creative patterns, creator patterns)
What to do next (clear action plan)
A Simple UGC Success Scorecard You Can Use Immediately
Score each campaign on a 0 to 100 scale across four pillars:
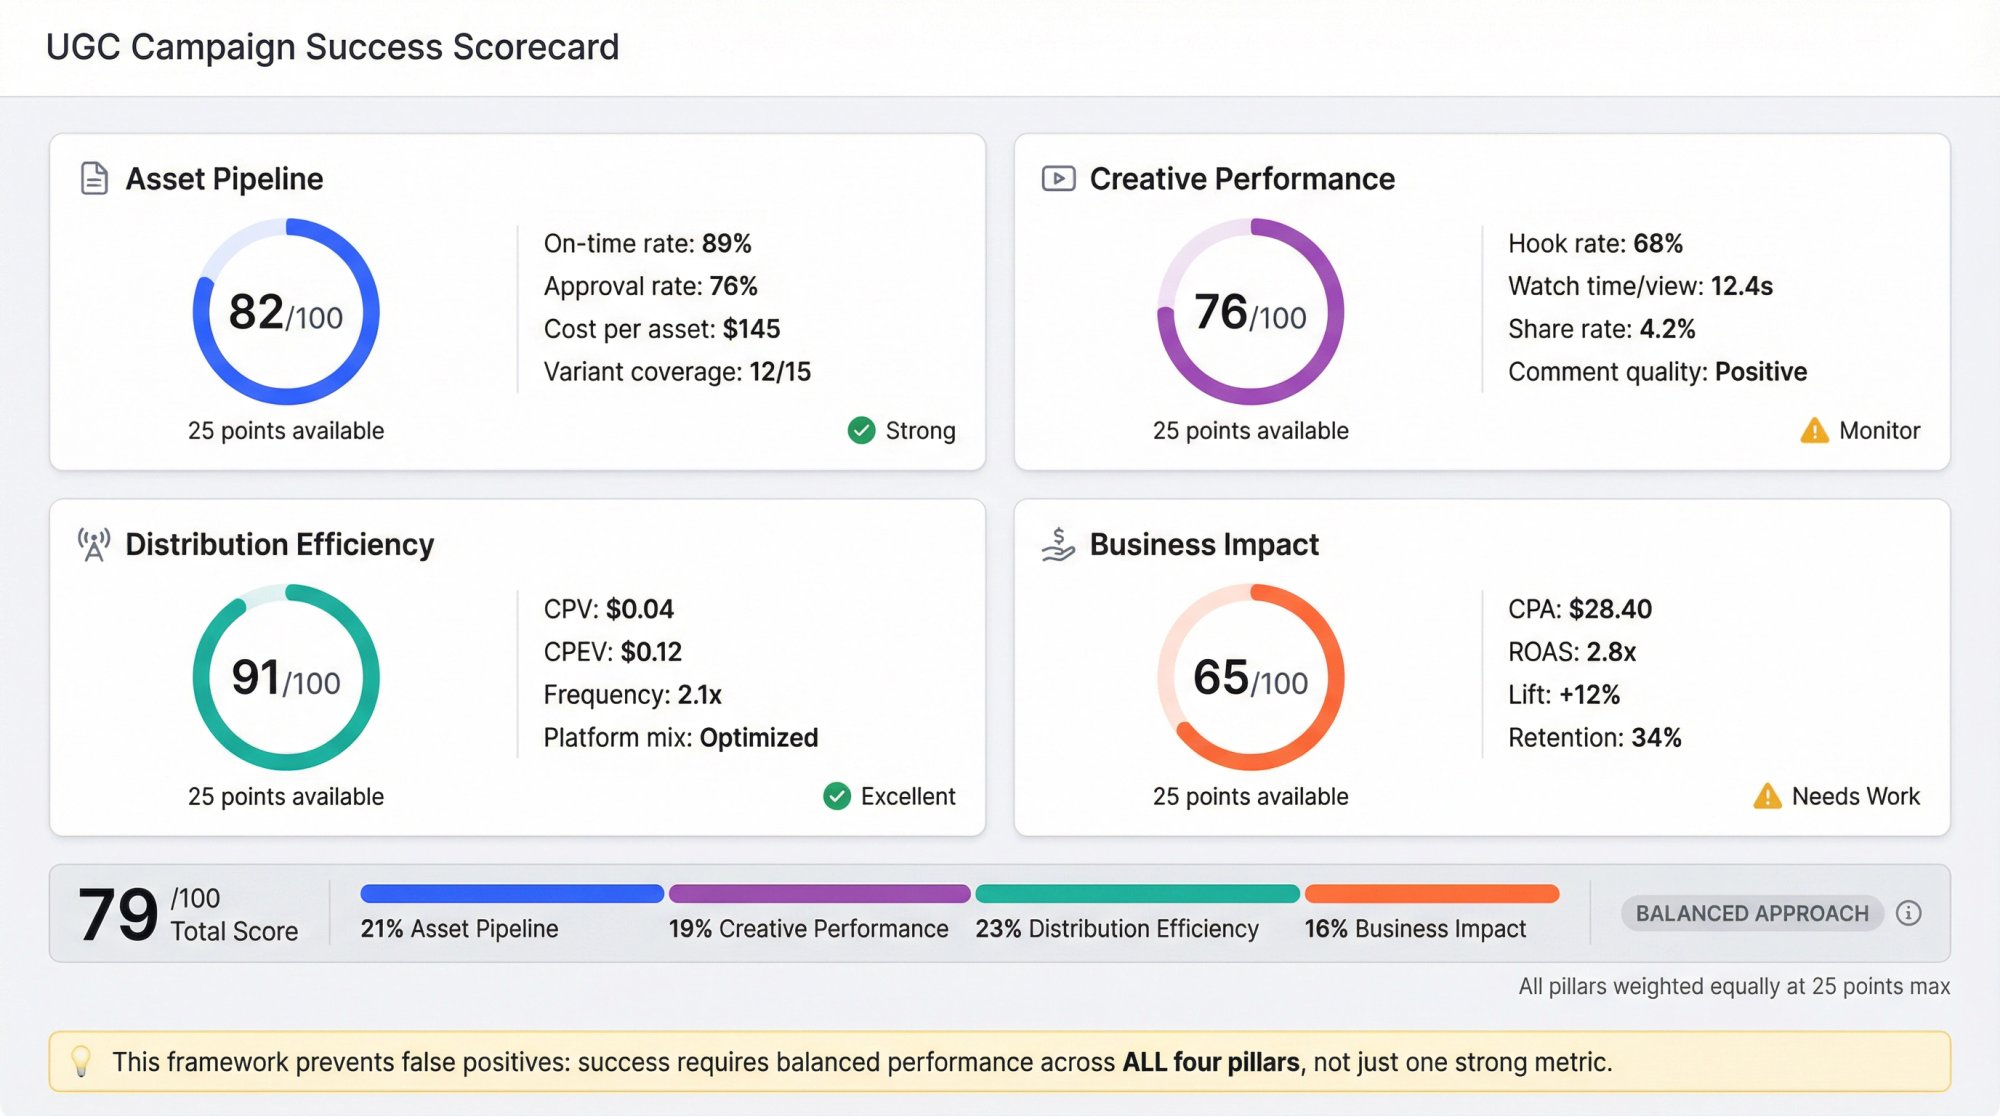
| Pillar | Weight | What to Measure |
|---|---|---|
| Asset Pipeline | 25 points | On-time rate, approval rate, cost per usable asset, variant coverage |
| Creative Performance | 25 points | Hook rate, watch time per view, share rate and save rate, comment quality |
| Distribution Efficiency | 25 points | CPV / CPEV, frequency vs fatigue, platform mix performance |
| Business Impact | 25 points | CPA / ROAS, incremental lift (if measured), downstream quality (activation, retention) |
Why this works: it prevents you from declaring success because one metric looks good while the system is failing elsewhere.
How to Track UGC Across TikTok, Reels, and Shorts
Cross-platform measurement breaks because:
Metrics are inconsistent
Definitions change (as you saw with Shorts views and Meta's views shift)
Data lives in different dashboards
You need a "single source of truth" layer that:
Pulls comparable video-level metrics
Lets you group by creator, hook, concept, time period
Exports cleanly into your reporting or BI
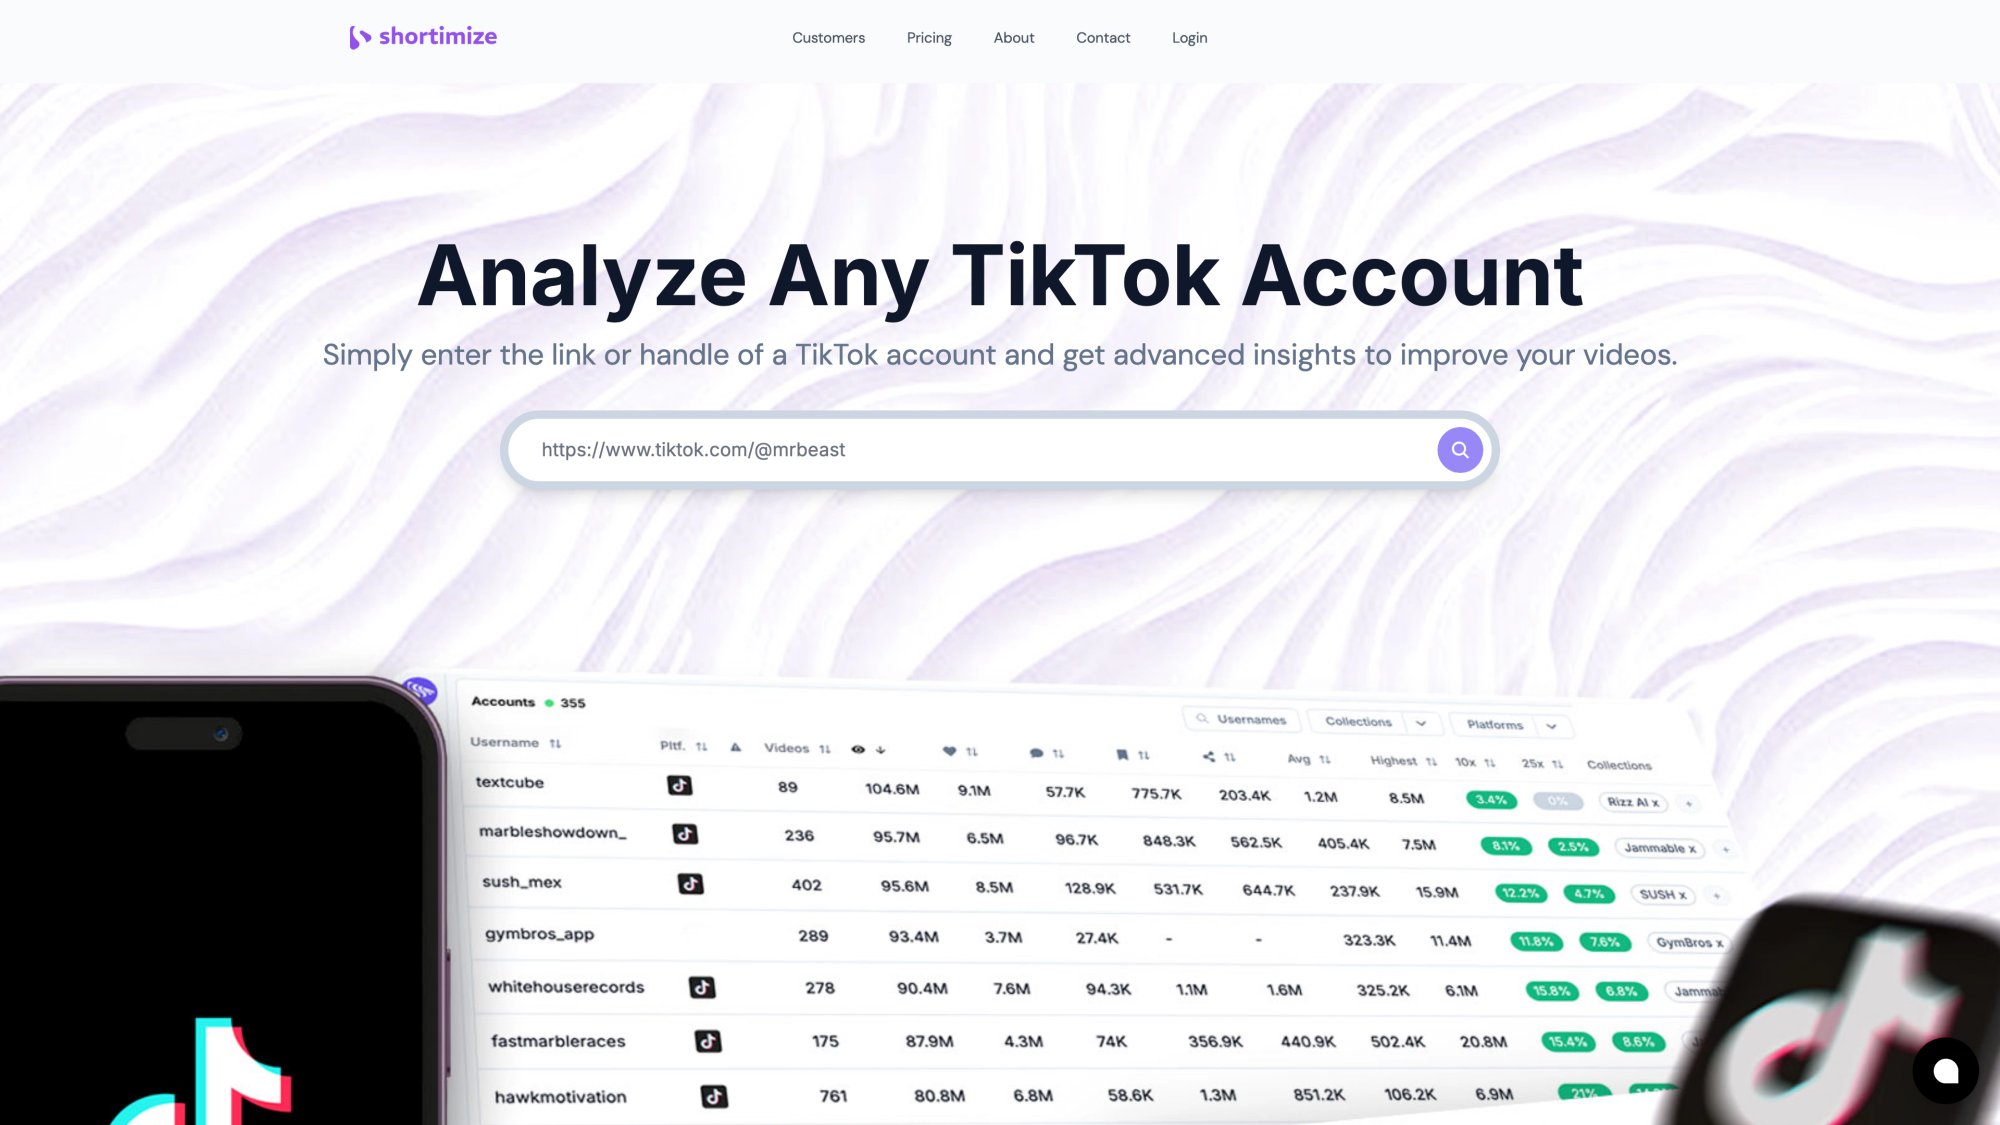
That's exactly the problem Shortimize is built for. We track public TikTok, Instagram, and YouTube accounts and videos, and let teams analyze performance across platforms in one place.
The platform provides a unified view for multi-platform tracking, letting you monitor creators, campaigns, and content performance without switching between native dashboards.
How to Use Shortimize for UGC Campaign Measurement
This is the cleanest way to use Shortimize for UGC measurement without turning it into a "dashboard museum."
1) Track the Campaign Universe
Depending on your campaign type:
If creators post on their accounts: track each creator account across TikTok, Reels, Shorts. Shortimize's influencer tracking flow is built around entering a public URL and pulling account and content metrics.
If UGC runs on your brand account: track your brand accounts and tag the campaign time window.
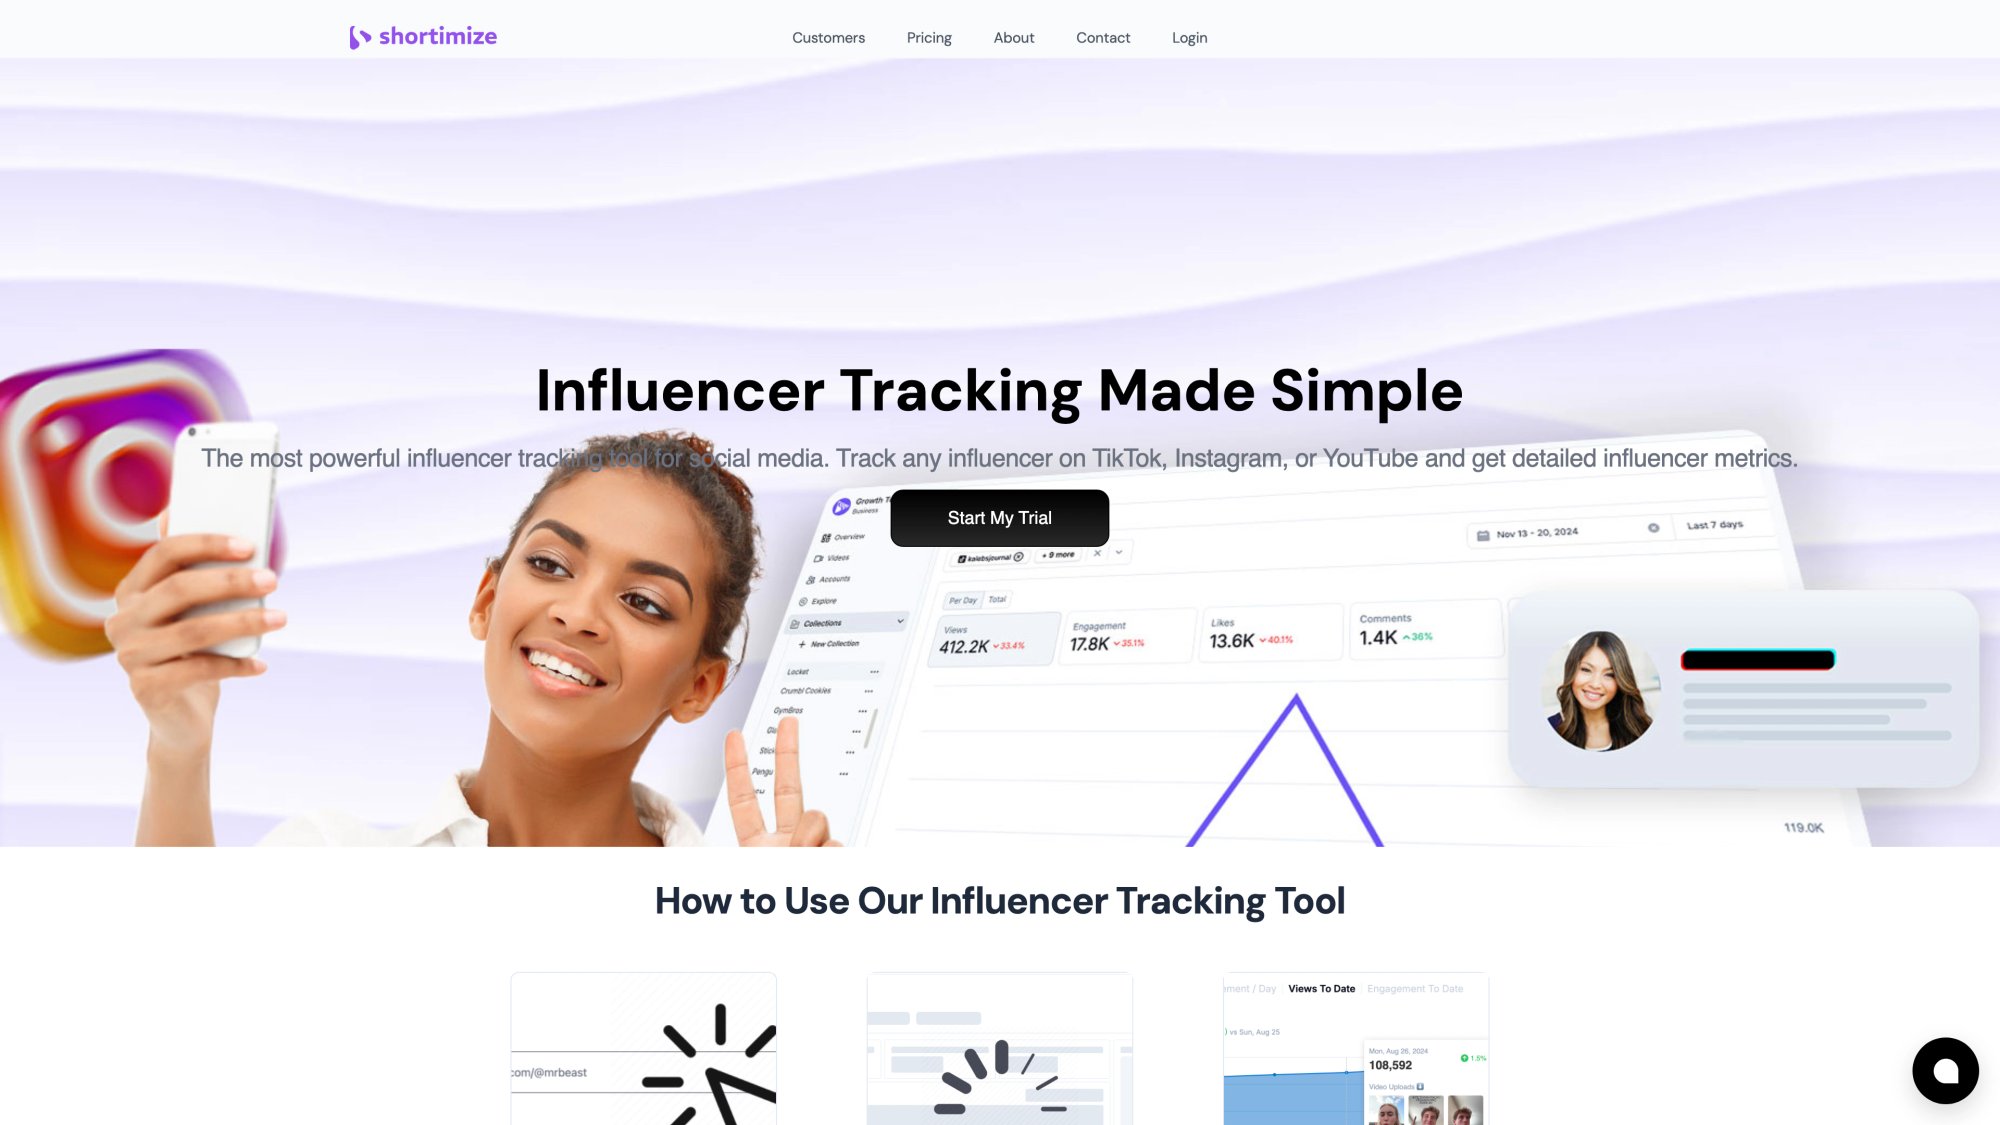
The influencer tracking interface lets you organize creators into collections, monitor performance across platforms, and export data for campaign analysis.
2) Organize Into Collections That Match How Decisions Get Made
Your collections should mirror decisions, not org charts:
"UGC Campaign Jan 2026"
"Creators: Top performers"
"Hooks: Problem-solution"
"UGC Ads: Test 1"
Shortimize explicitly supports organizing accounts at scale (collections) and exporting tables.
3) Set Up Alerting for "Winners"
UGC campaigns move fast. You want to know when a video is taking off so you can:
Whitelist it
Duplicate the hook
Add spend behind it
Shortimize supports Slack and Discord notifications, plus integrations for automation.
4) Connect Content Performance to Downstream Product Outcomes
Shortimize offers integrations with Mixpanel, Amplitude, and PostHog, plus API access and webhooks.
The winning setup looks like:
Shortimize tracks video performance (top of funnel)
Your product analytics tracks activation and retention
You join them by campaign IDs, timestamps, UTMs, or creative IDs
5) Respect Data Latency
Shortimize pricing references default refresh rates like 12 to 24 hours depending on plan, with possible upgrades.
So use it for:
Cross-platform reporting
Trend detection
Competitive and creator benchmarking
Not for second-by-second bidding decisions.
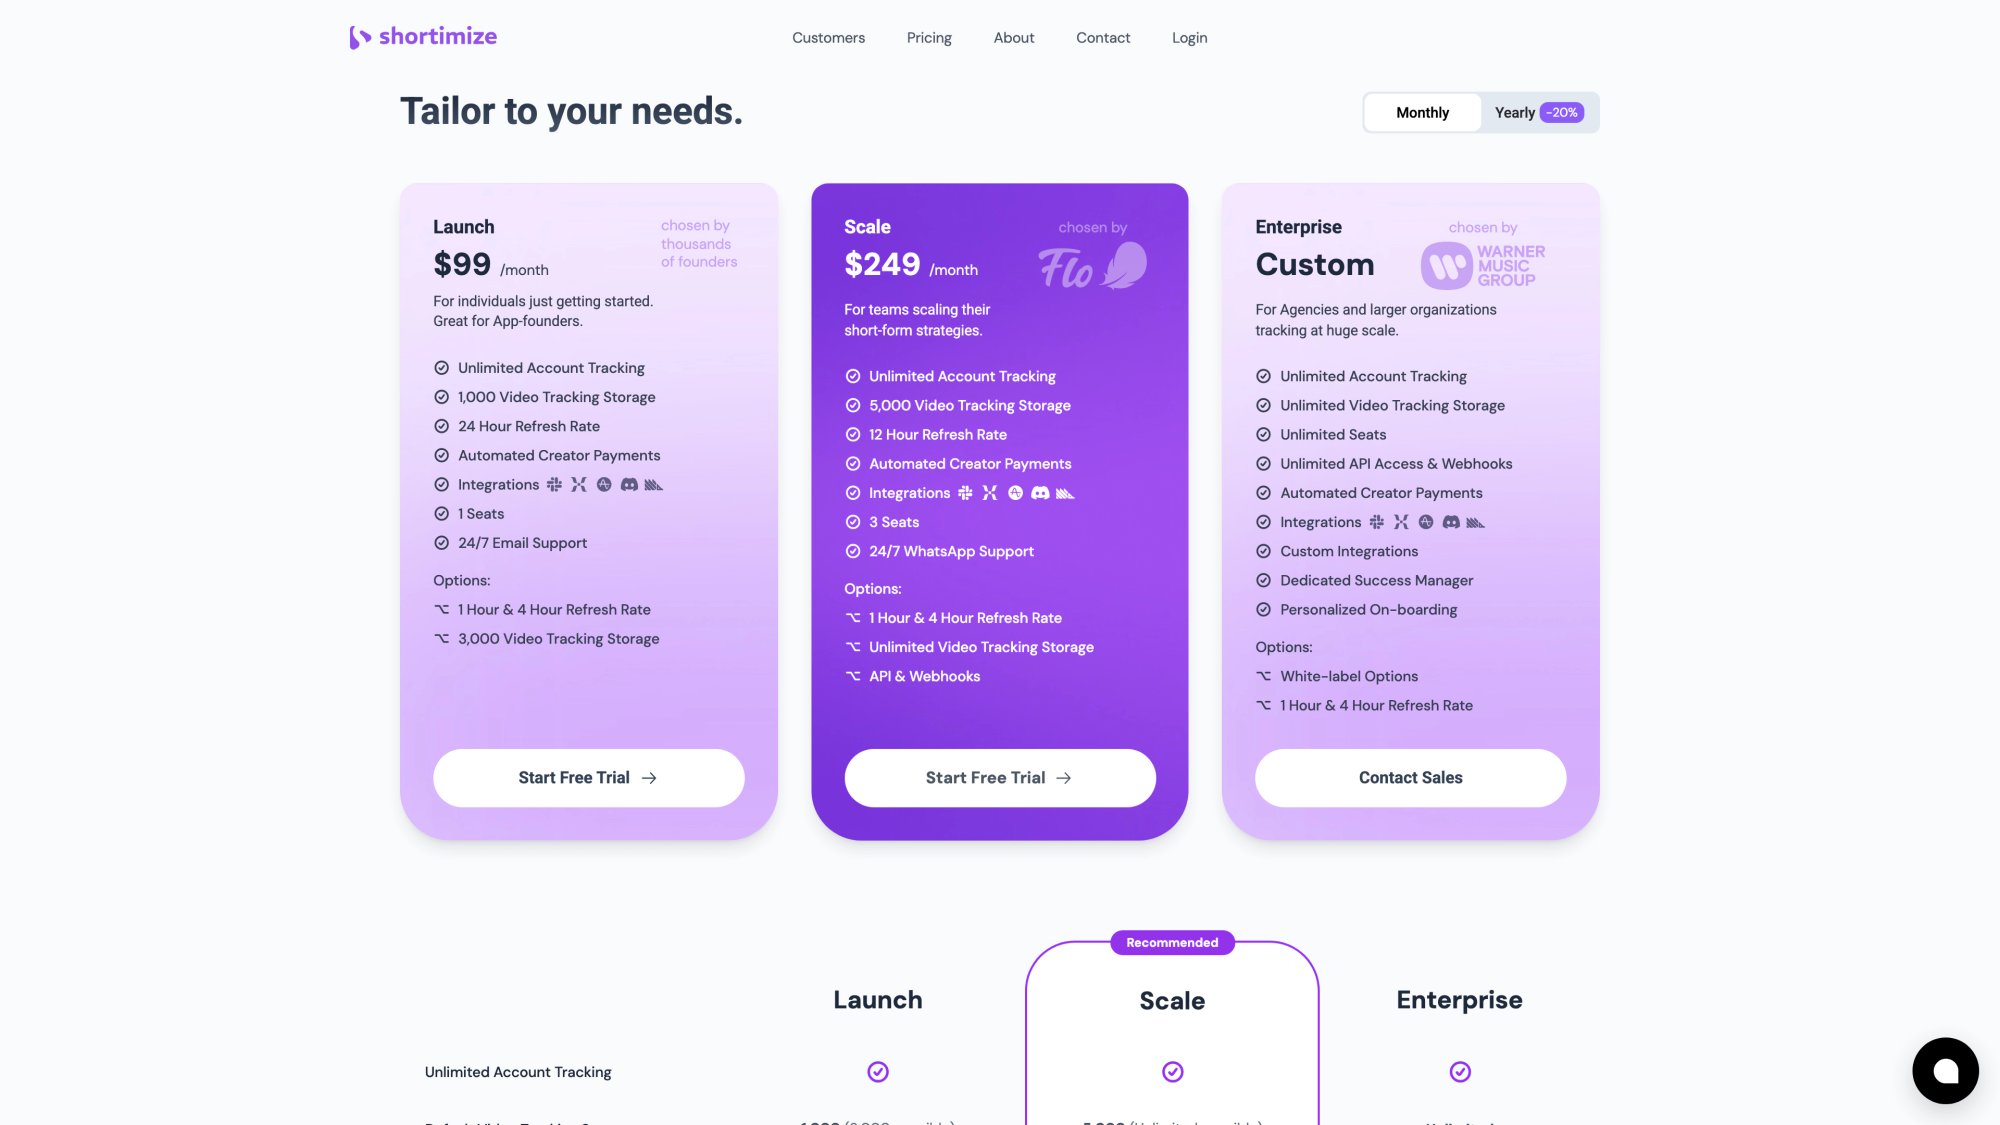
Plans scale from individual creators to enterprise teams, with all tiers offering unlimited accounts and varying refresh rates depending on your operational needs.
5 UGC Measurement Mistakes That Make ROI "Impossible"
Mistake 1: Declaring Victory Based on Views
Views changed on Shorts, and views definitions differ across platforms.
Fix: Treat views as exposure, then judge creative with retention and high-intent actions.
Mistake 2: Mixing "UGC That Performs as Content" with "UGC That Performs as Ads"
Some videos are great organic content but mediocre ads, and vice versa.
Fix: Keep two scorecards:
Organic scorecard
Paid scorecard
Mistake 3: No Creative Tagging, So You Learn Nothing
If you don't label hook type, CTA type, and persona, you can't extract patterns.
Fix: Creative ID system.
Mistake 4: Confusing Attribution with Incrementality
Attribution tells you a path. Incrementality tells you causality.
Fix: Use attribution for iteration, incrementality for scaling decisions.
Mistake 5: Ignoring Operational KPIs
If creator ops are messy (late content, low approval), your CAC will look bad even if UGC "works."
Fix: Measure asset pipeline KPIs.
Your UGC Campaign Report Template
UGC Campaign Report: [Name]
Dates:
Primary goal:
Win condition:
Spend:
Creators:
Assets produced:
Assets live:
1) Executive Summary (5 Bullets)
What happened
What worked
What failed
What we learned
What we'll do next
2) Asset Pipeline
Cost per usable asset
Approval rate
On-time rate
Variant coverage
3) Content Performance (By Creative Pattern, Not Just By Post)
Top 5 hooks (with metrics)
Top 5 CTAs
What patterns correlate with high share rate and watch time?
4) Distribution
Organic vs paid split
CPV / CPEV
Fatigue signals
5) Business Impact
Attributed conversions and CPA
Lift test results (if run)
Downstream quality (activation, retention)
6) Decisions
Creators to rehire
Hooks to clone
Assets to boost
Experiments to run next
The Bottom Line
Measuring UGC campaign success isn't about finding the "right" metric. It's about building a measurement system that:
1) Defines success as incremental value (not activity)
2) Uses leading indicators (retention and high-intent actions) to make fast creative decisions
3) Uses business metrics (CPA, ROAS, retention) to decide whether to scale
4) Uses incrementality when the decision is expensive and uncertainty is high
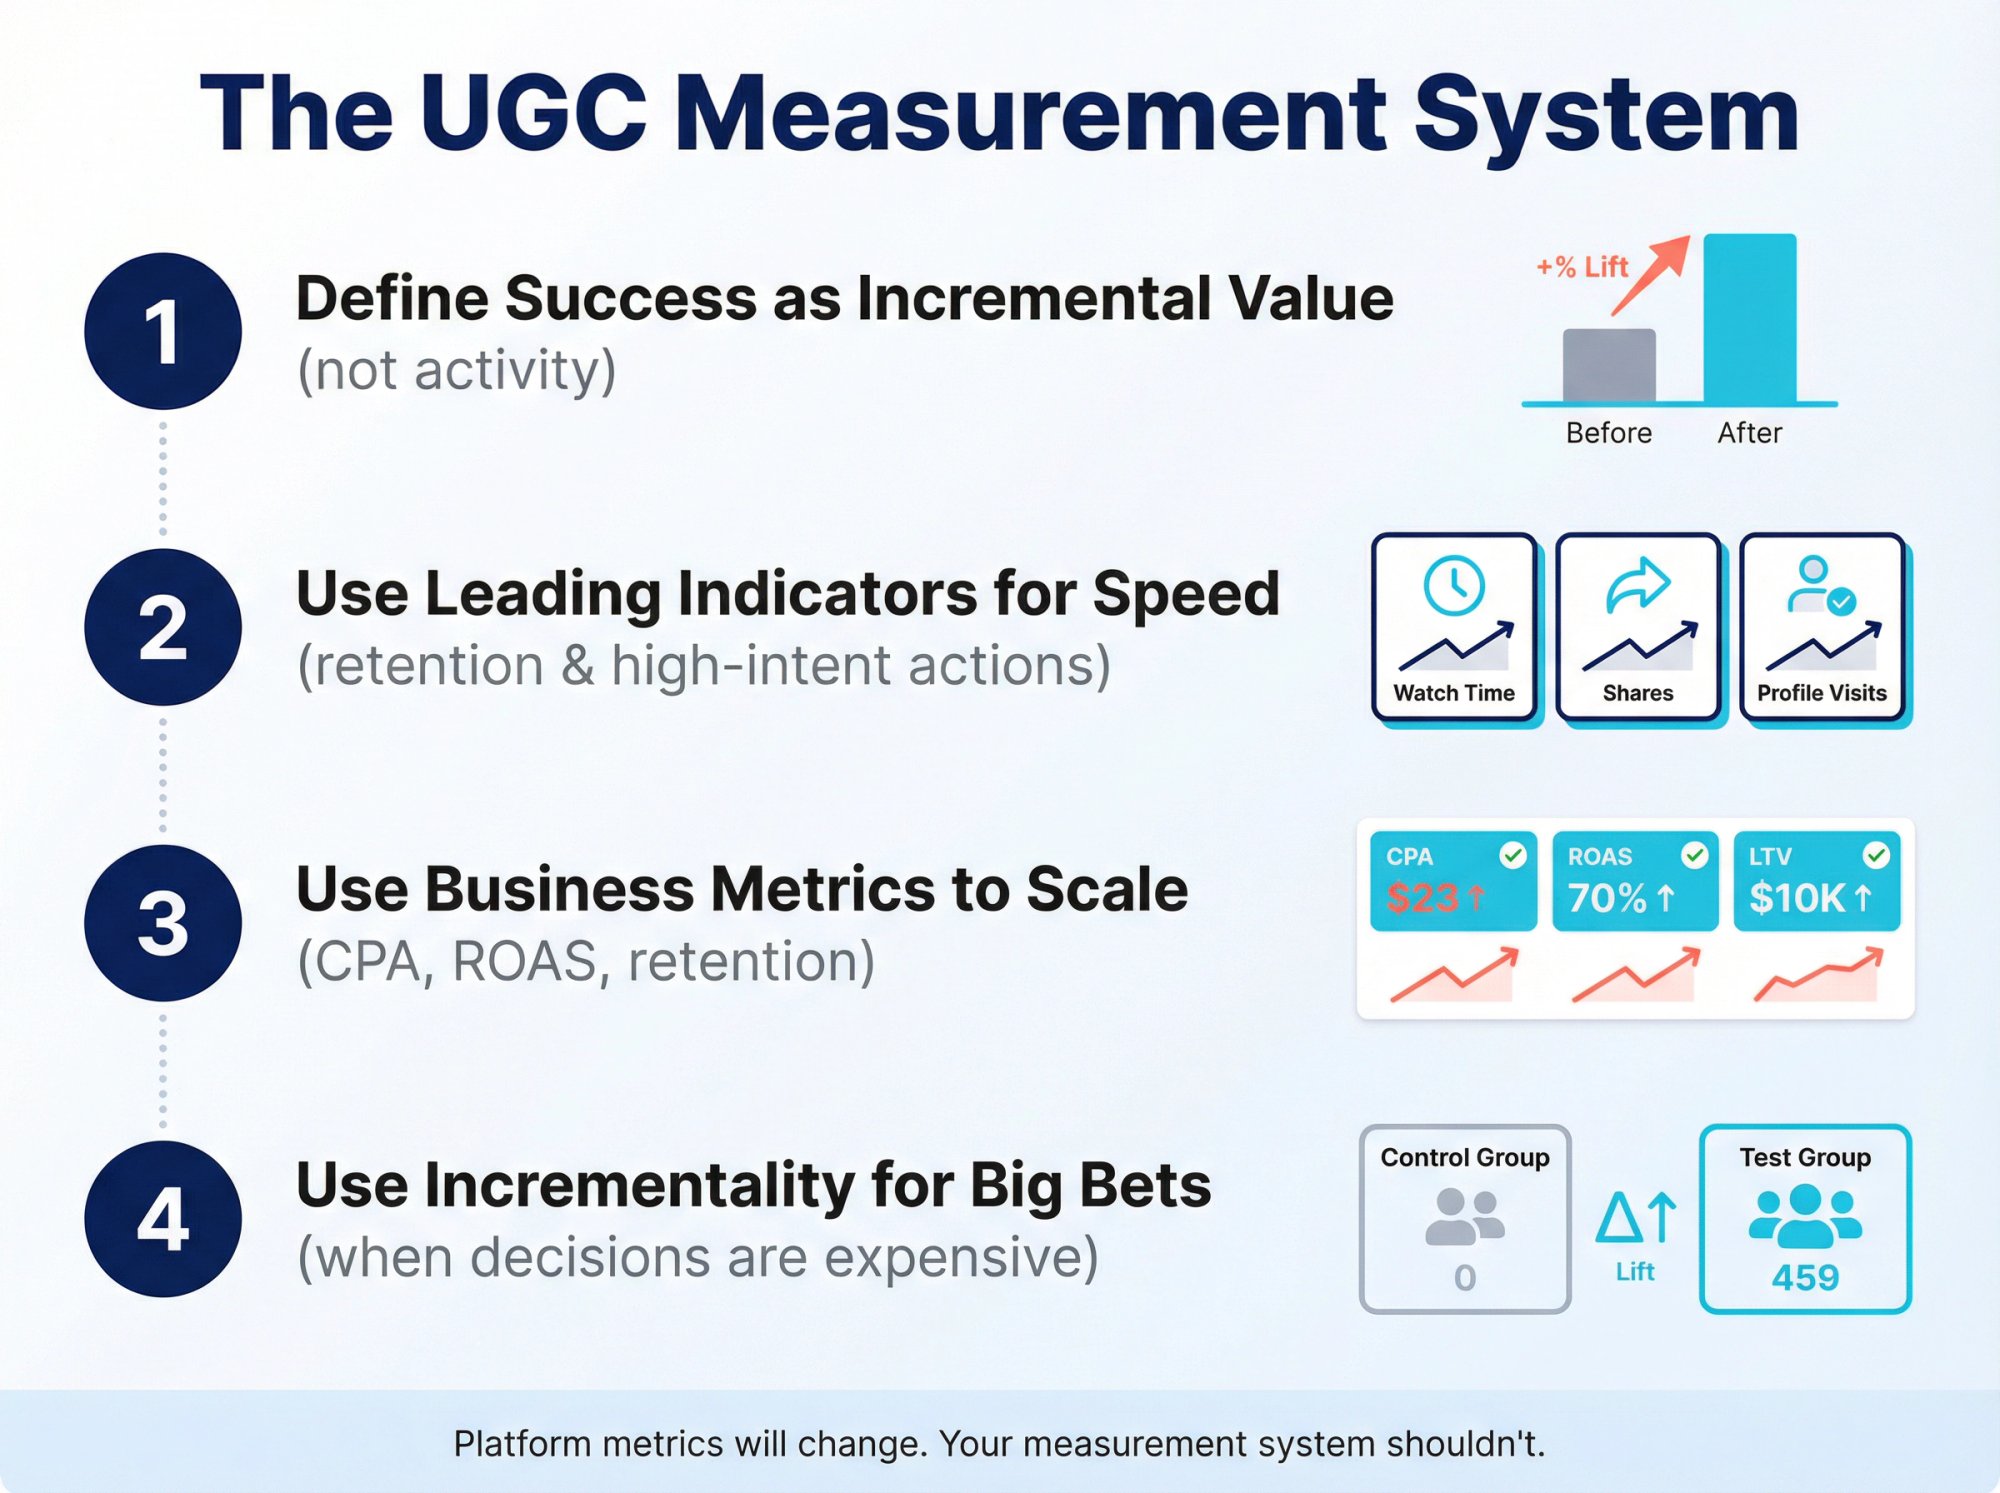
The platforms will keep changing how they count views. The algorithms will keep shifting. But if you build a measurement system that separates signal from noise and ties everything back to incremental business value, you'll know exactly what's working.
And more importantly, you'll know what to do next.
Looking to track your UGC campaign performance across TikTok, Instagram, and YouTube? Shortimize provides cross-platform video analytics in one dashboard. Track any public account or video, organize campaigns into collections, and export data for analysis. Start your 7-day free trial.