Influencer marketing has become a $32+ billion industry, and if you're running campaigns on TikTok and Instagram, you're dealing with the two biggest platforms for creator partnerships. Research from 2025 shows that 57% of brands run influencer promotions on Instagram, while 52% use TikTok.
But the reality is this: most teams can't answer basic questions about campaign performance. Which creators actually drove sales? Should you spend more on TikTok or Instagram next quarter? What did that $10,000 investment actually return?
The problem isn't a lack of data (platforms throw metrics at you constantly). The problem is getting clean, comparable data you can actually use to make decisions.
This guide shows you how to build a tracking system that works across TikTok and Instagram. You'll learn which metrics matter, how to collect data from both platforms, and how to create reports that executives trust. By the end, you'll have a repeatable process for measuring influencer ROI.
Why You Can't Afford to Run Influencer Campaigns Without Tracking
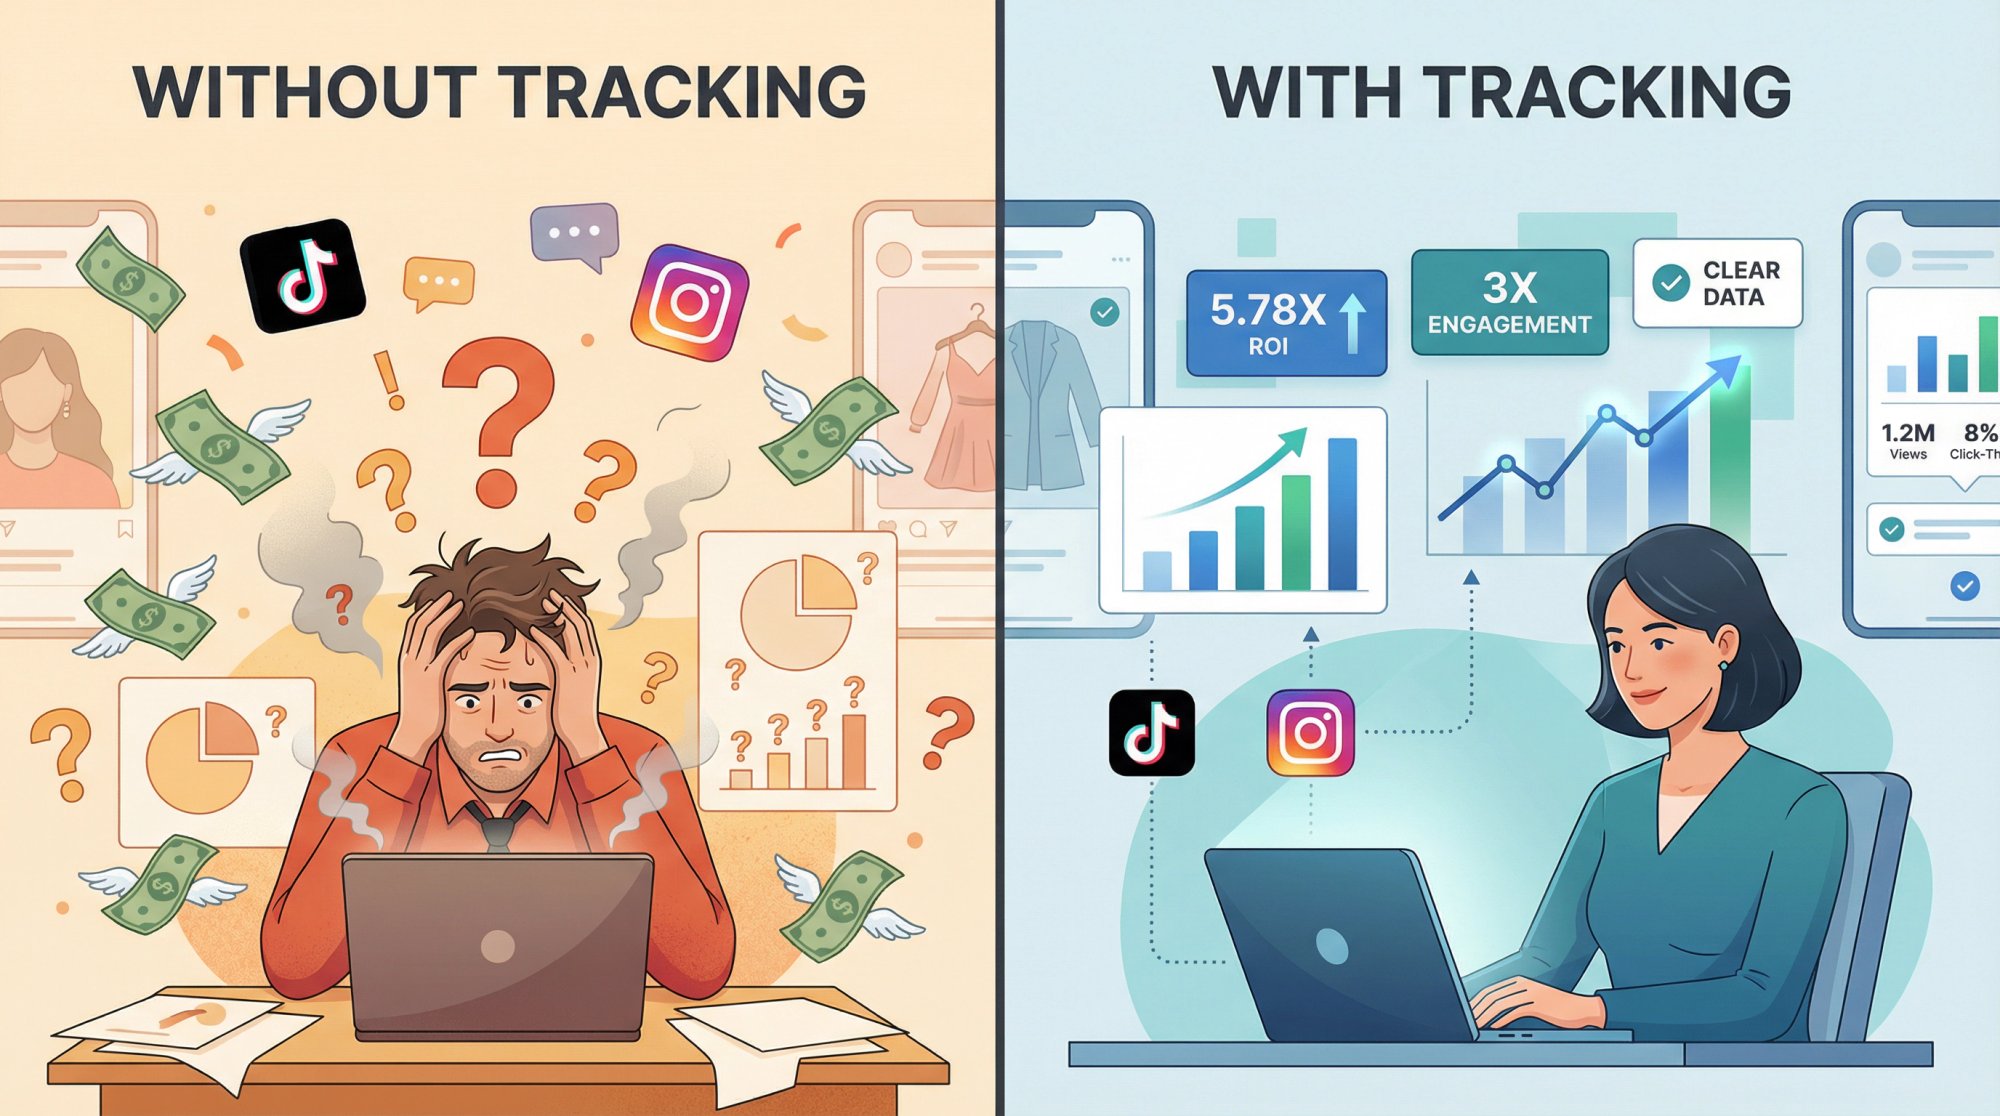
Running influencer campaigns without proper tracking is expensive guesswork. You're essentially paying creators to post content and hoping something good happens.
Things change when you track performance correctly.
You identify your best performers. When you can see that one TikTok creator delivers 3X the engagement of another on similar budgets, you know where to allocate future spend. Tracking lets you pinpoint top-performing campaigns and double down on what works.
You measure real ROI. Industry research indicates that brands earn about $5.78 for every $1 spent on influencer marketing on average. But that's just an average. Your campaigns might deliver 10X returns or lose money entirely. Without tracking conversions, clicks, and sales, you'll never know which category you're in.
You optimize budget allocation. Maybe Instagram partnerships drive cheaper cost-per-click while TikTok delivers explosive reach. Cross-platform performance data shows where your money works hardest. Recent data shows that 73% of brands prefer working with micro-influencers specifically because their engagement-to-cost ratio is strong (but you only discover who's cost-effective by measuring results).
You hold everyone accountable. If you negotiated for a 5% engagement rate or specific story views, tracking lets you verify those deliverables. When managing multiple influencers simultaneously, you can see who meets expectations on engagement, impressions, and conversions.
Without tracking, you can't separate real impact from hype. The creators with the loudest pitches aren't always the ones who drive results.
How to Set Clear Campaign Goals and KPIs Before Launch
Tracking starts with knowing what you're measuring.
Before any influencer posts content, define exactly what success looks like for your campaign. Common influencer marketing objectives break down into distinct categories, each requiring different measurement approaches.
Brand Awareness Campaign Metrics
If your goal is increasing visibility and reach, focus on:
• Impressions and Reach (how many people saw the content)
• Video Views on TikTok and Instagram Reels
• Engagement metrics like likes, shares, and comments that signal content resonance
• Story impressions on Instagram or video shares on TikTok
Audience Engagement Campaign Metrics
When you're building community and deeper connections:
• Engagement rate (percentage of viewers who interact)
• Comments quality (not just quantity: are people tagging friends or asking product questions?)
• Saves on Instagram and Favorites on TikTok
• Follower growth during and after the campaign period
Traffic and Lead Generation Campaign Metrics
For campaigns designed to drive action:
• Link clicks and click-through rate (CTR)
• Referral traffic to your website from social platforms
• Lead capture (sign-ups, app installs, email collection)
• Landing page conversions from influencer-driven traffic
Sales and Conversion Campaign Metrics
When the goal is direct revenue:
• Conversion count (actual purchases or desired actions)
• Conversion rate (what percentage of clicks became customers)
• Revenue generated from trackable sources
• Promo code redemptions tied to specific influencers
• Return on ad spend (ROAS) and overall campaign ROI
Pick 1-2 primary goals per campaign. If your main objective is sales, you'll still track reach and engagement, but you'll weight conversions most heavily when evaluating success. If you're focused on brand buzz, impressions and engagement take priority over immediate conversions.
Without clear objectives, you can't assess whether a campaign succeeded or failed. Define specific targets upfront: "reach 500,000 people across TikTok and Instagram" or "generate $10,000 in revenue at 5:1 ROI."
These targets transform subjective opinions into objective measurements.
What Metrics Actually Matter on TikTok vs Instagram
TikTok and Instagram each offer distinct data, and understanding what you can (and can't) track on each platform is crucial.
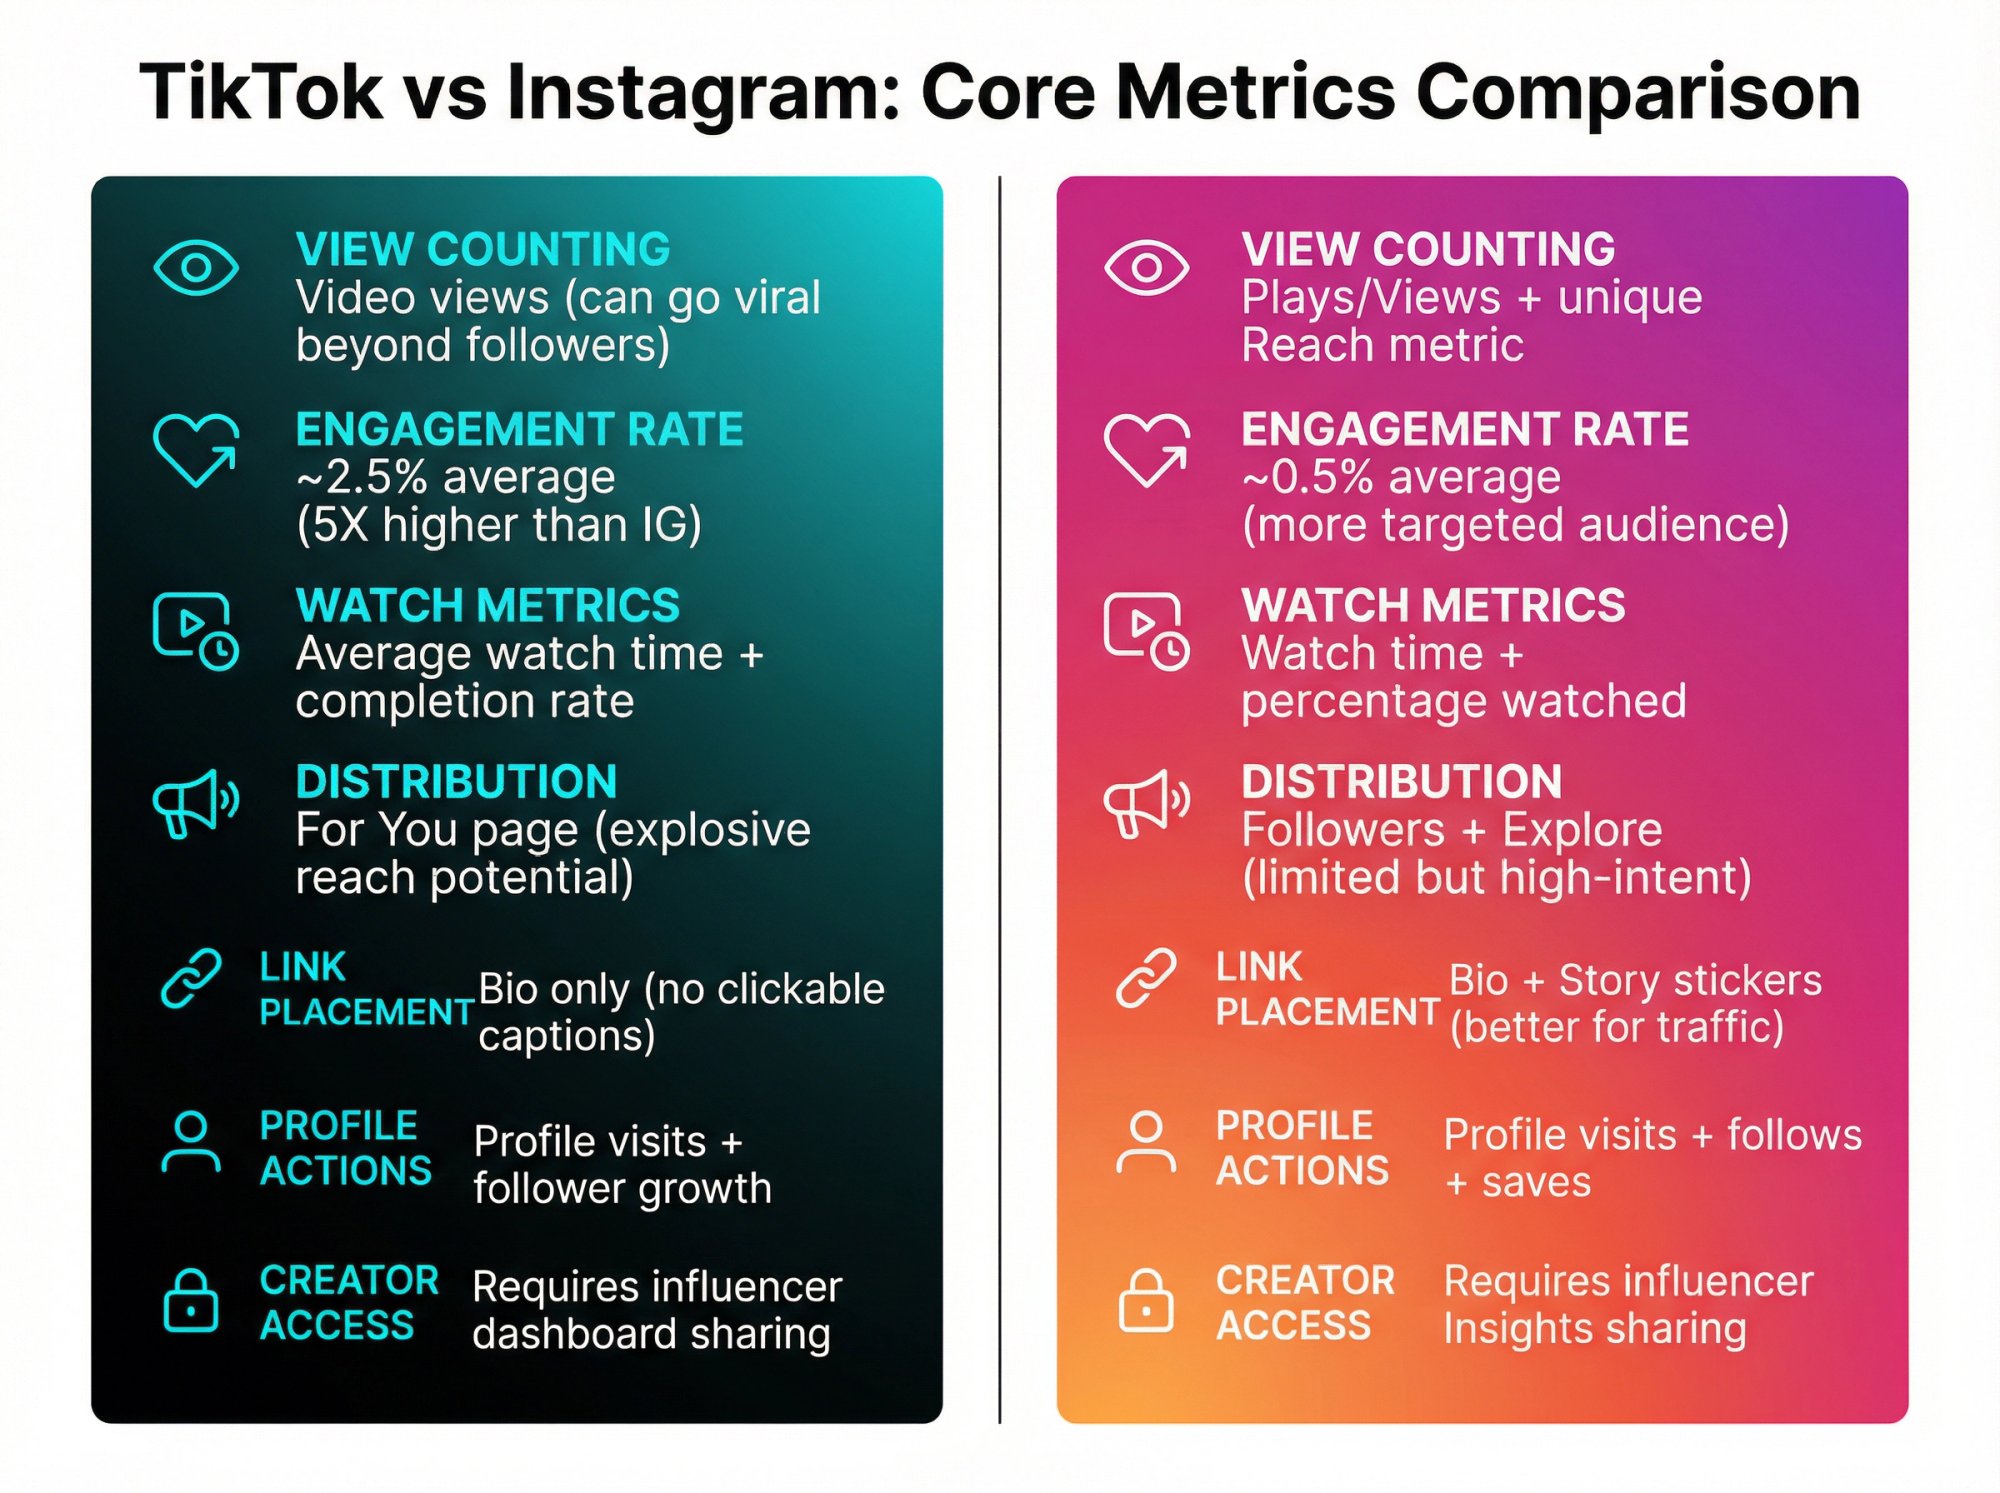
TikTok vs Instagram: Core Metrics Comparison
| Metric Category | TikTok | |
|---|---|---|
| View Counting | Video views (can go viral beyond followers) | Plays/Views + unique Reach metric |
| Engagement Rate | ~2.5% average (5X higher than IG) | ~0.5% average (more targeted audience) |
| Watch Metrics | Average watch time + completion rate | Watch time + percentage watched |
| Distribution | For You page (explosive reach potential) | Followers + Explore (limited but high-intent) |
| Link Placement | Bio only (no clickable captions) | Bio + Story stickers (better for traffic) |
| Profile Actions | Profile visits + follower growth | Profile visits + follows + saves |
| Creator Access | Requires influencer dashboard sharing | Requires influencer Insights sharing |
TikTok Performance Metrics Worth Tracking
Video Views are TikTok's most visible metric, but views alone don't tell you much. TikTok's algorithm can push content viral to millions beyond an influencer's followers, which means view counts often exceed Instagram by significant margins.
What you really want to track:
• Average watch time and completion rate (did people actually watch, or just scroll past?)
• Likes, comments, and shares (public engagement signals)
• Profile visits and follower growth (indicating genuine interest)
• Traffic source breakdown (views from For You page vs. followers)
The challenge? Many of these metrics are creator-only. You'll need influencers to share their TikTok Analytics dashboard data.
Recent research shows that TikTok leads social media with an average engagement rate around 2.5%, five times higher than Instagram's ~0.5%. Small creators often see double-digit engagement rates on TikTok, making it powerful for authentic-feeling promotions.
Instagram Performance Metrics Worth Tracking
Instagram provides Impressions and Reach (unique viewers), which helps you understand true audience exposure versus repeated views. For Reels specifically:
• Plays/Views (similar to TikTok views)
• Watch time and average percentage watched
• Likes, comments, shares (public metrics)
• Saves (Instagram-specific, signaling deep interest)
• Profile visits and follows gained
• Link clicks from bio or Story stickers
Instagram's reach tends to be more limited to followers plus Explore page traffic, whereas TikTok's For You page can deliver explosive unpredictable reach. But Instagram often converts better (users who click through tend to show higher purchase intent).
How to Calculate Engagement Rate That Actually Matters
Engagement rate typically follows this formula: (total engagements ÷ follower count) × 100%
For example, 10,000 likes on an account with 100,000 followers equals a 10% like rate (excellent performance on Instagram). But you can also calculate engagement per view or per impression, which normalizes for viral reach.
Compare engagement rates between platforms carefully. If an influencer has 8% engagement on TikTok but only 1% on Instagram, their TikTok audience is clearly more responsive. That's valuable insight for future collaborations.
Important benchmark: Research shows that TikTok nano-influencers average ~10% engagement while Instagram nanos average ~1.7%. Always compare an influencer's campaign performance to their typical baseline. If they normally get 5% engagement and your campaign post got 2%, it underperformed relative to their standard.
How to Build Your Attribution Foundation With Trackable Links
The biggest challenge in influencer marketing is connecting outcomes (sales, sign-ups, traffic) to specific creators and platforms.
Trackable links solve this problem.
How to Use UTM Parameters for Cross-Platform Tracking
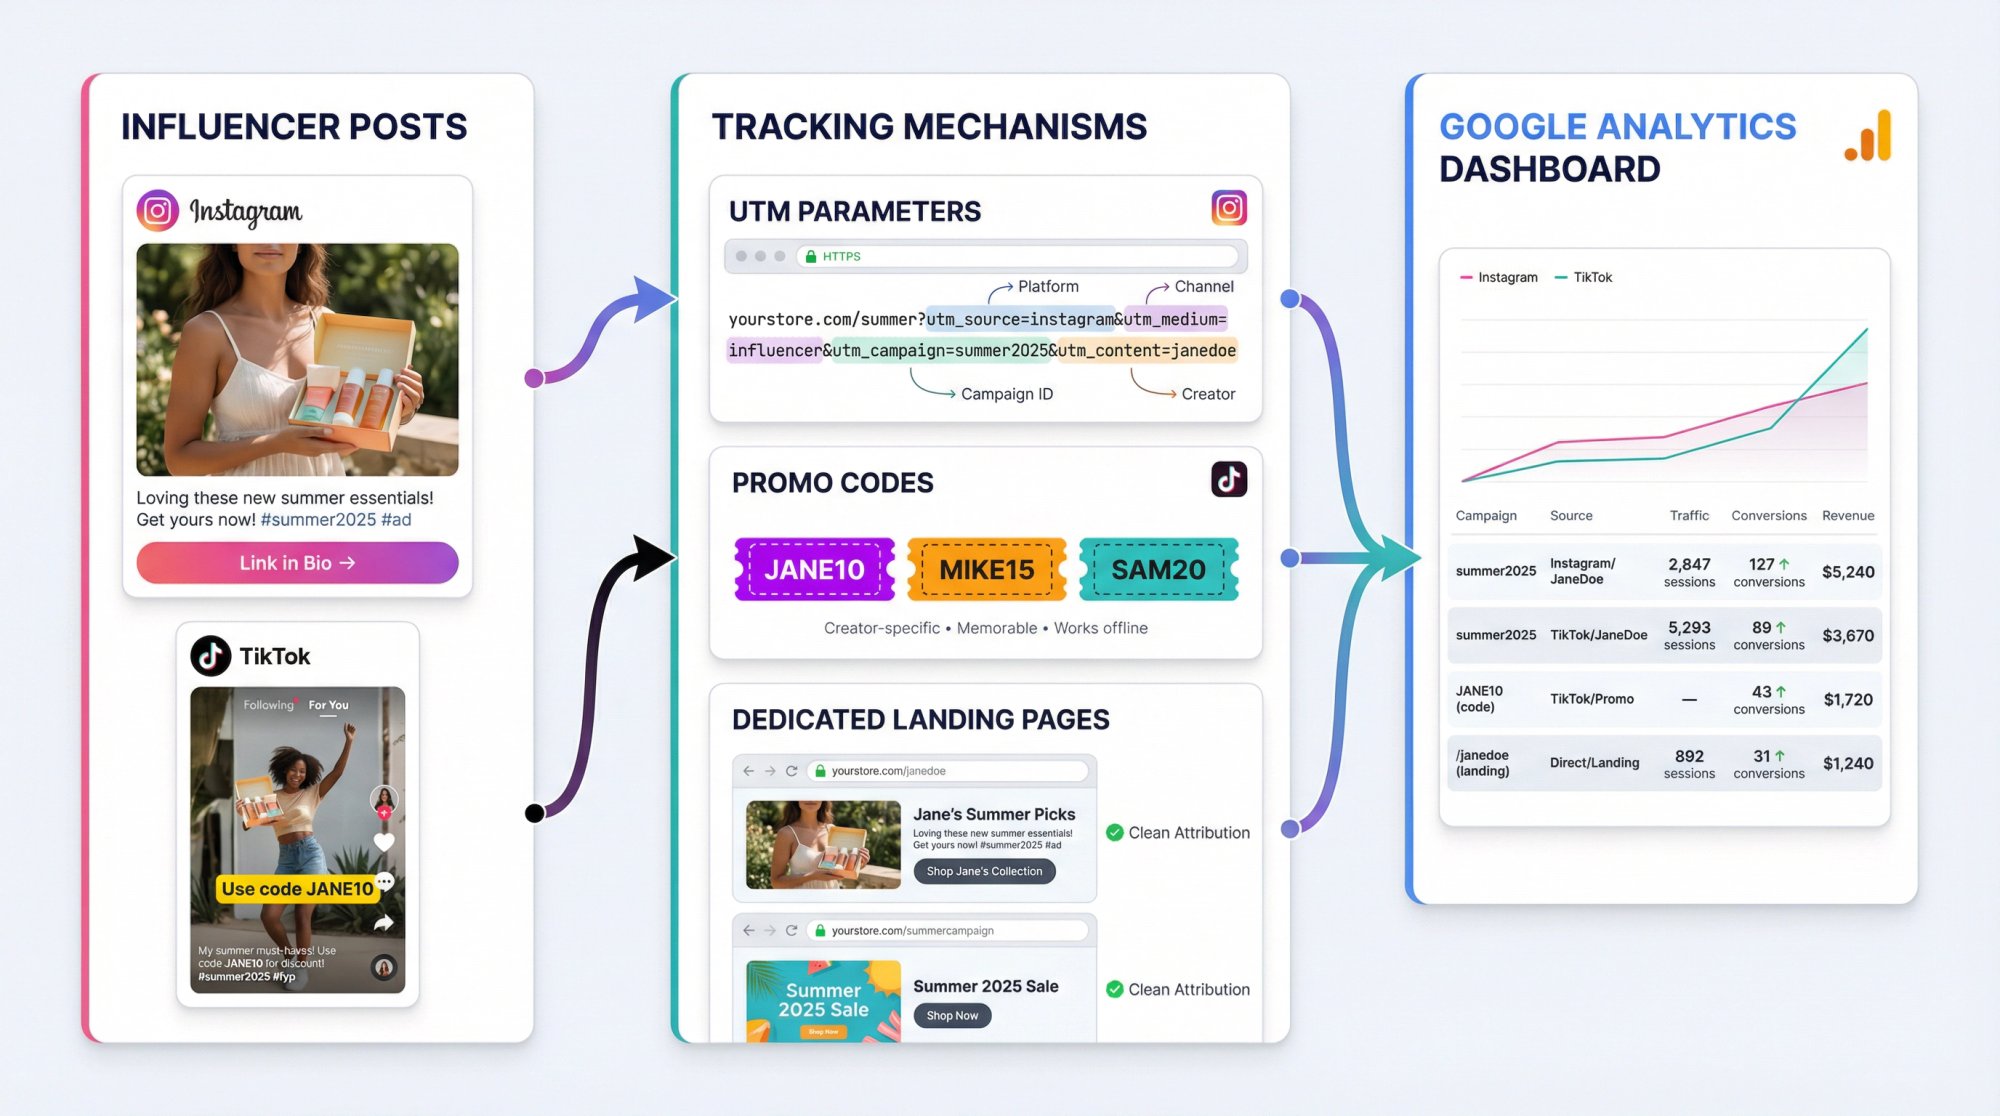
UTM parameters are text tags you add to URLs that tell your analytics exactly where traffic came from. Create unique UTM-tagged URLs for each influencer and platform.
A practical structure:
For an Instagram campaign:
yourstore.com/summer?utm_source=instagram&utm_medium=influencer&utm_campaign=summer2025&utm_content=janedoe
For the same influencer on TikTok:
yourstore.com/summer?utm_source=tiktok&utm_medium=influencer&utm_campaign=summer2025&utm_content=janedoe
Notice only utm_source changes (Instagram vs. TikTok). This setup lets Google Analytics separate the traffic streams while keeping campaign data unified.
UTM best practices:
• Use consistent naming (all lowercase, no spaces)
• Include campaign ID, creator name, and platform in your structure
• Create UTMs before the campaign launches, not after
• Shorten long UTM links with Bit.ly or branded domains for cleaner presentation
Once your UTM links are active, monitor them in Google Analytics under Acquisition > Campaigns. You'll see entries like "summer2025 – Instagram – JaneDoe" with complete metrics: users, sessions, bounce rate, conversions.
This is where you discover insights like "Instagram drove more traffic, but TikTok traffic converted at a higher rate."
Why Promo Codes Work Better Than Links on TikTok
Promo codes work brilliantly for TikTok, where links in captions aren't clickable and users often see content but purchase later.
Make codes creator-specific and memorable:
• JANE10, MIKE15, SAM20
People who see an influencer's content but later search your brand directly will still use the code at checkout. Track redemptions in your e-commerce platform to catch these delayed conversions.
Codes also incentivize purchases (everyone loves a discount), creating a win-win for tracking and conversion optimization.
When to Use Dedicated Landing Pages for Attribution
When spending serious money, don't send everyone to your homepage. Create unique landing pages or use personalized URLs:
• /janedoe (only Jane shares this URL, all traffic is attributable)
• /summercampaign (campaign-specific, easier to scale across multiple creators)
• Deep links for apps (best for mobile conversion optimization)
Dedicated landing pages let you isolate an influencer's impact completely. You can count every visit and conversion without complex analytics queries.
Pro tip: Use UTMs, promo codes, AND dedicated landing pages together. UTMs capture immediate clicks. Codes catch delayed conversions. Landing pages provide clean attribution when other methods fail.
How to Get Creator-Only Analytics Data From Influencers
You won't have direct access to an influencer's Instagram Insights or TikTok Analytics dashboard. But professional influencers expect to share this data as part of campaign deliverables.
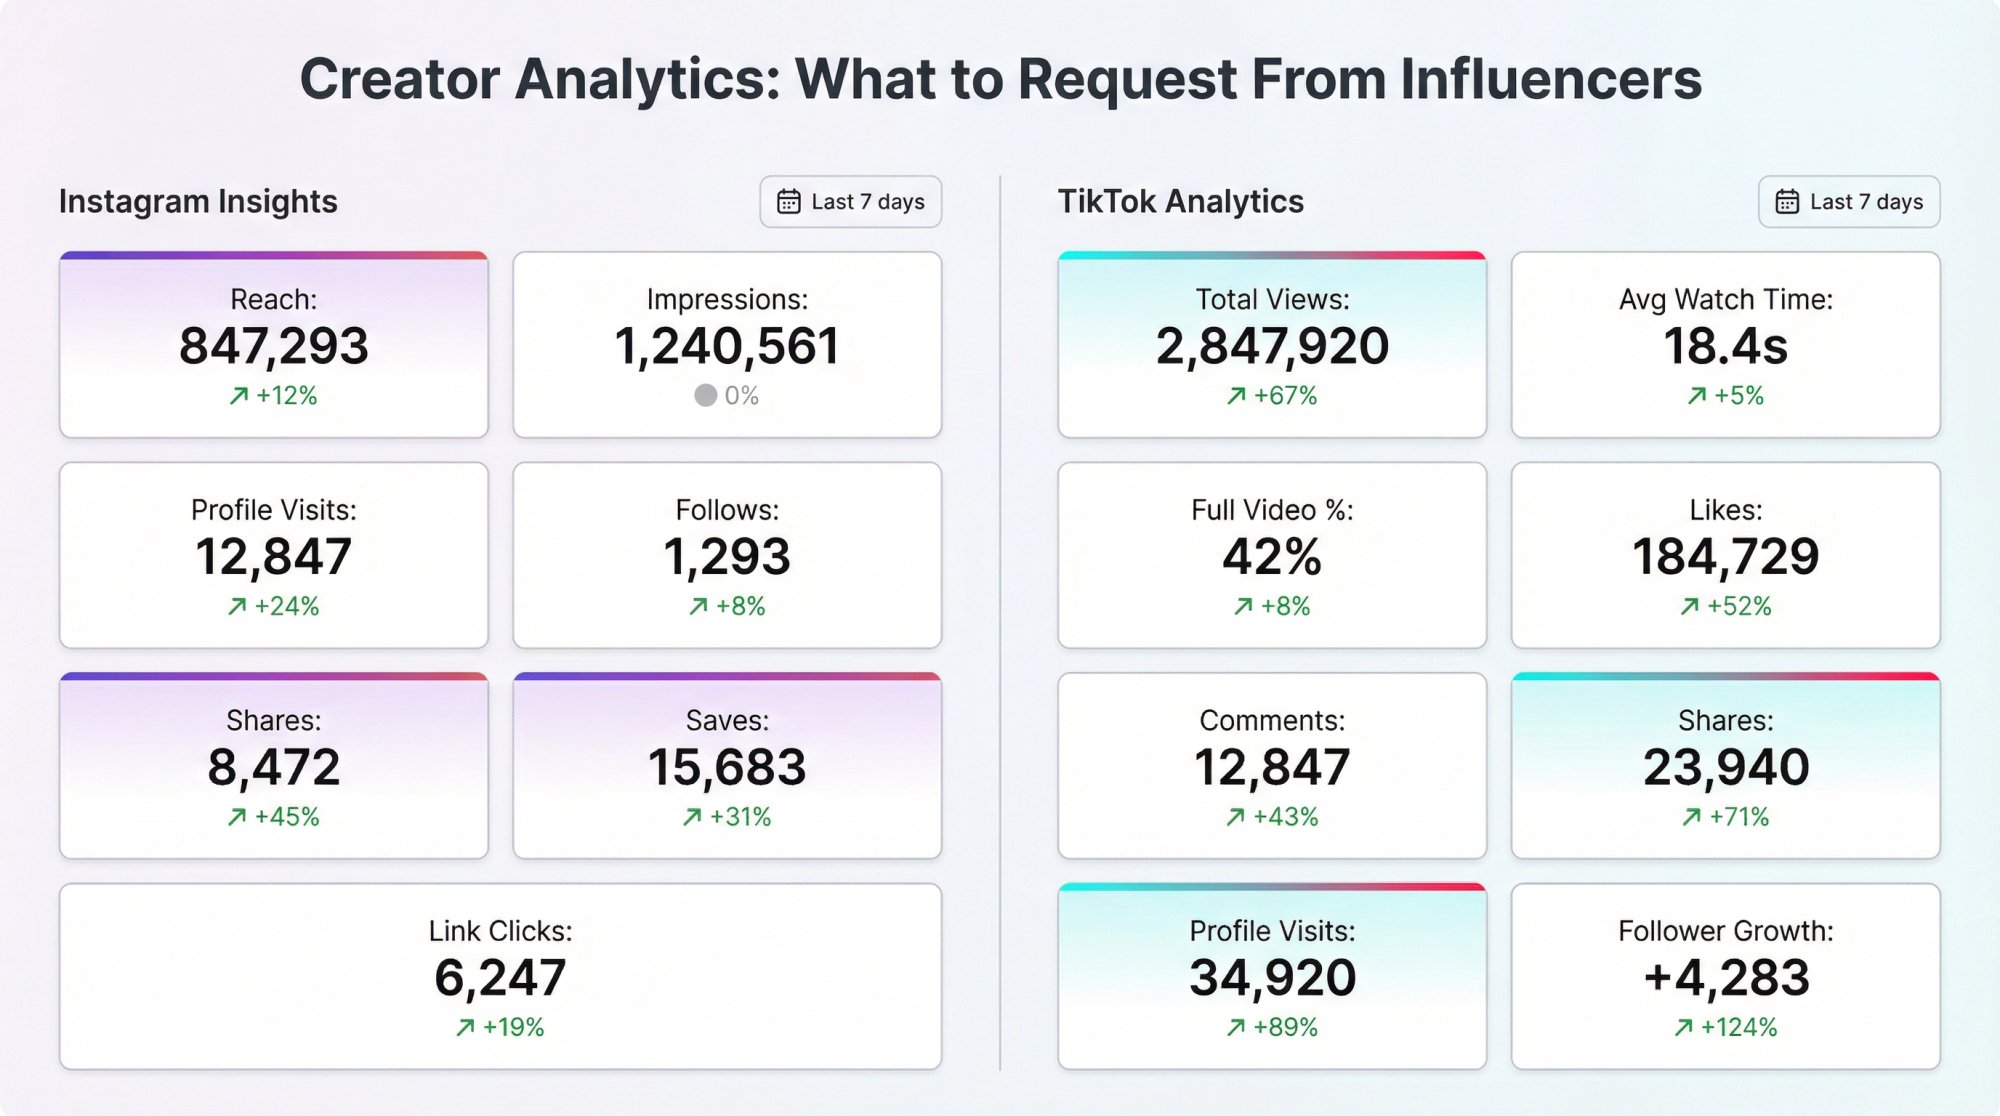
Instagram Insights You Should Request From Creators
For each branded post or Story, influencers can access detailed metrics:
| Metric | What It Tells You |
|---|---|
| Reach | Unique accounts who saw the content |
| Impressions | Total times content was viewed |
| Profile Visits | People who checked the influencer's profile after seeing the post |
| Follows | New followers gained from this specific content |
| Shares | Times the post was shared (incredibly valuable for virality tracking) |
| Saves | Users who bookmarked the post (signal of high-value content) |
| Link Clicks | Taps on Story links or bio links (critical for traffic campaigns) |
Instagram's audience insights also show demographic breakdowns (age, location, gender), helping you validate whether the campaign reached your target audience.
TikTok Analytics You Should Request From Creators
For TikTok videos, creators with Pro or Business accounts can share:
| Metric | What It Tells You |
|---|---|
| Total Views | Overall video plays |
| Average Watch Time | How long viewers actually watched |
| Watched Full Video % | Completion rate (critical quality indicator) |
| Likes, Comments, Shares | Public engagement metrics |
| Profile Visits | Interest signals beyond the video itself |
| Follower Growth | New followers attributed to this video |
| Traffic Source Types | Views from For You page vs. followers (shows algorithm pickup) |
| Audience Territories | Geographic breakdown of viewers |
TikTok's analytics reveal whether content gained traction on the For You page (the ultimate distribution win) or stayed confined to existing followers.
The Insights Request Template That Gets Results
Put this into your influencer agreements to streamline data collection:
"Influencer will provide post-performance screenshots from platform analytics, including Reach, Impressions, Engagement metrics, Link Clicks, and Audience Demographics, within 7 days of posting."
Make it easy. Create a simple Google Form or template spreadsheet where creators can upload screenshots or input numbers.
How to Use Branded Content Tools for Direct Analytics Access
Both platforms offer partnership features that give brands direct analytics access:
Instagram Branded Content: When creators tag your brand as a partner, you can view insights through Facebook Business Manager. This requires setup in advance but eliminates the screenshot-chasing process.
TikTok Creator Marketplace: Official campaign collaborations through TikTok's system provide brands with automatic performance reports including views, engagement, and audience data.
If you're running frequent influencer programs, these official partnership tools save hours of manual data collection.
Best Cross-Platform Tracking Tools for TikTok and Instagram
Managing data from multiple influencers across TikTok and Instagram in spreadsheets gets messy fast. Dedicated tracking tools save time and surface insights you'd otherwise miss.
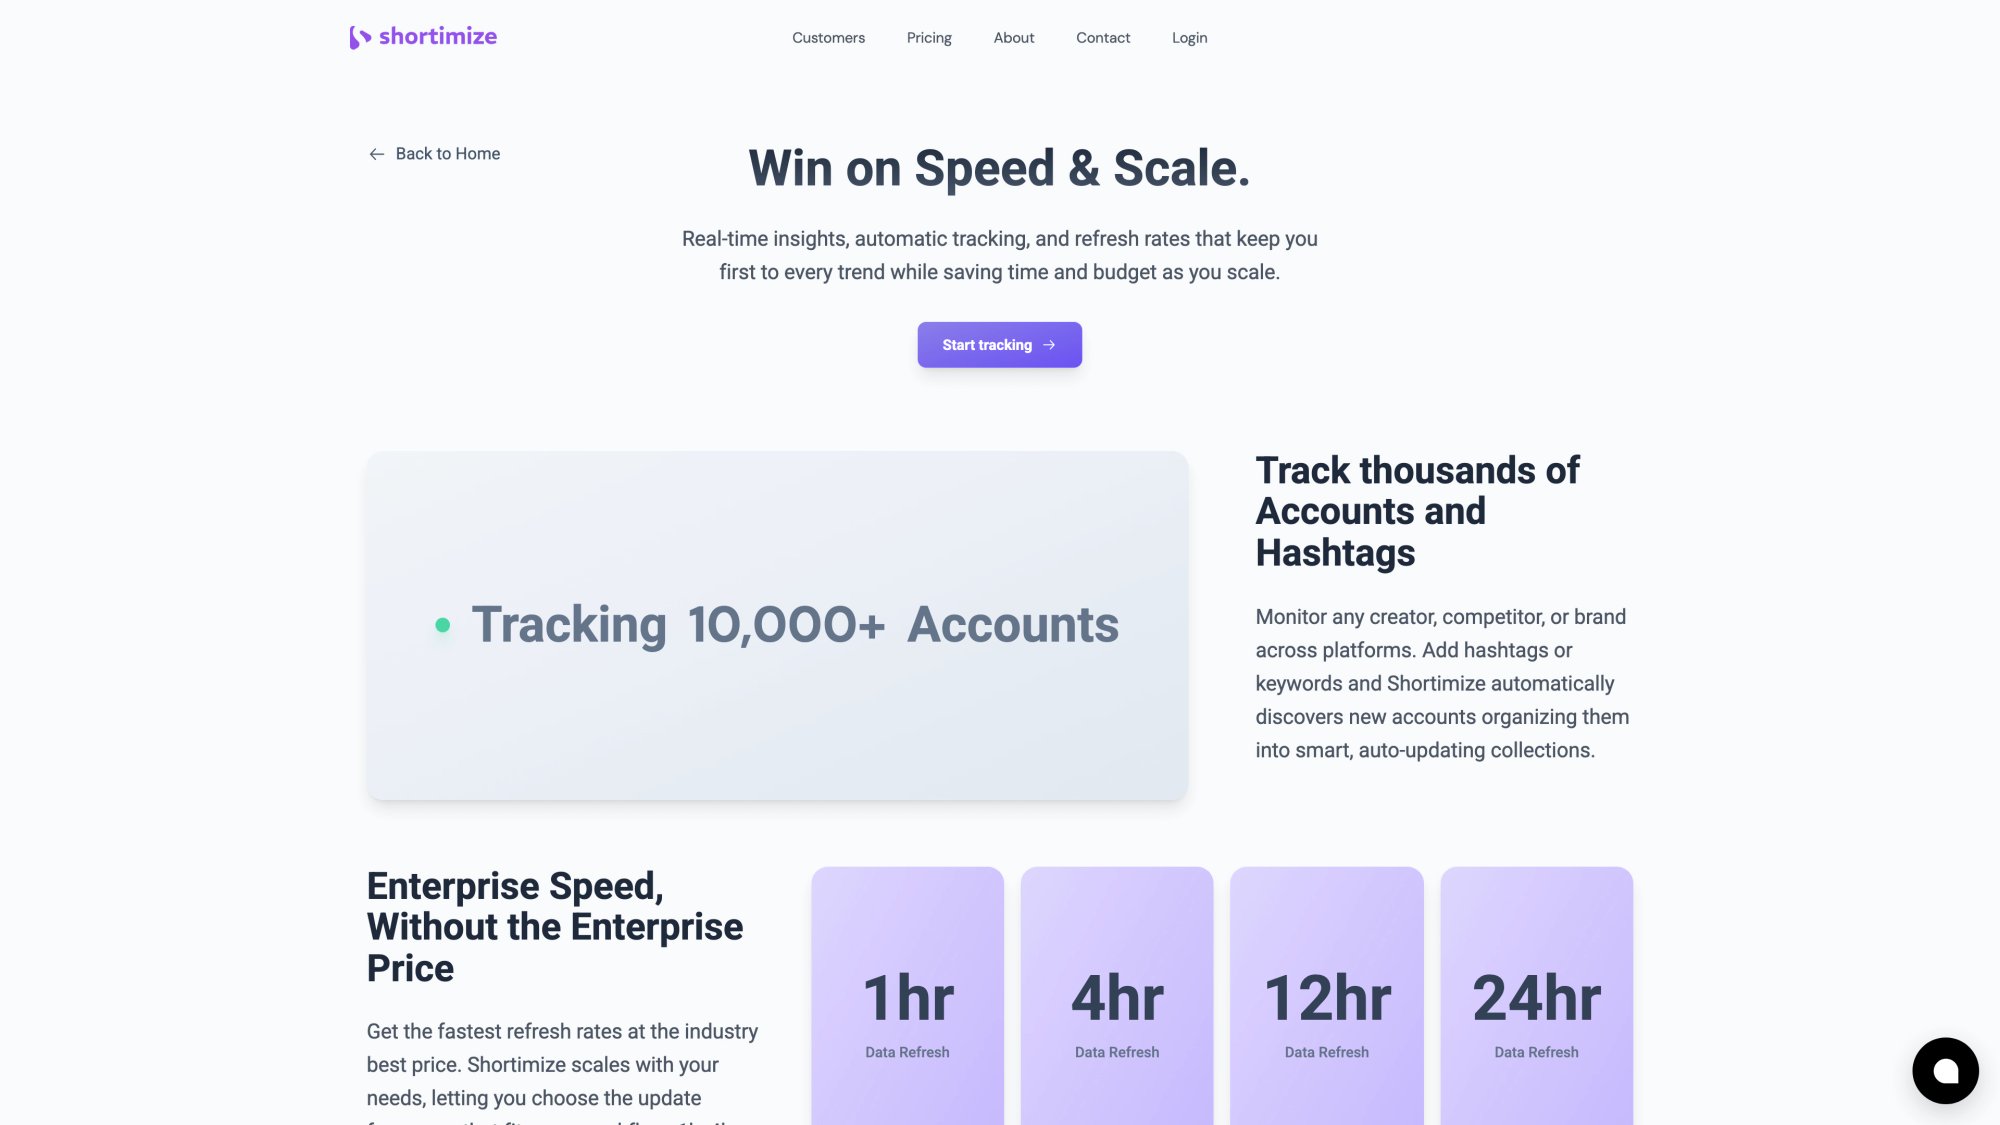
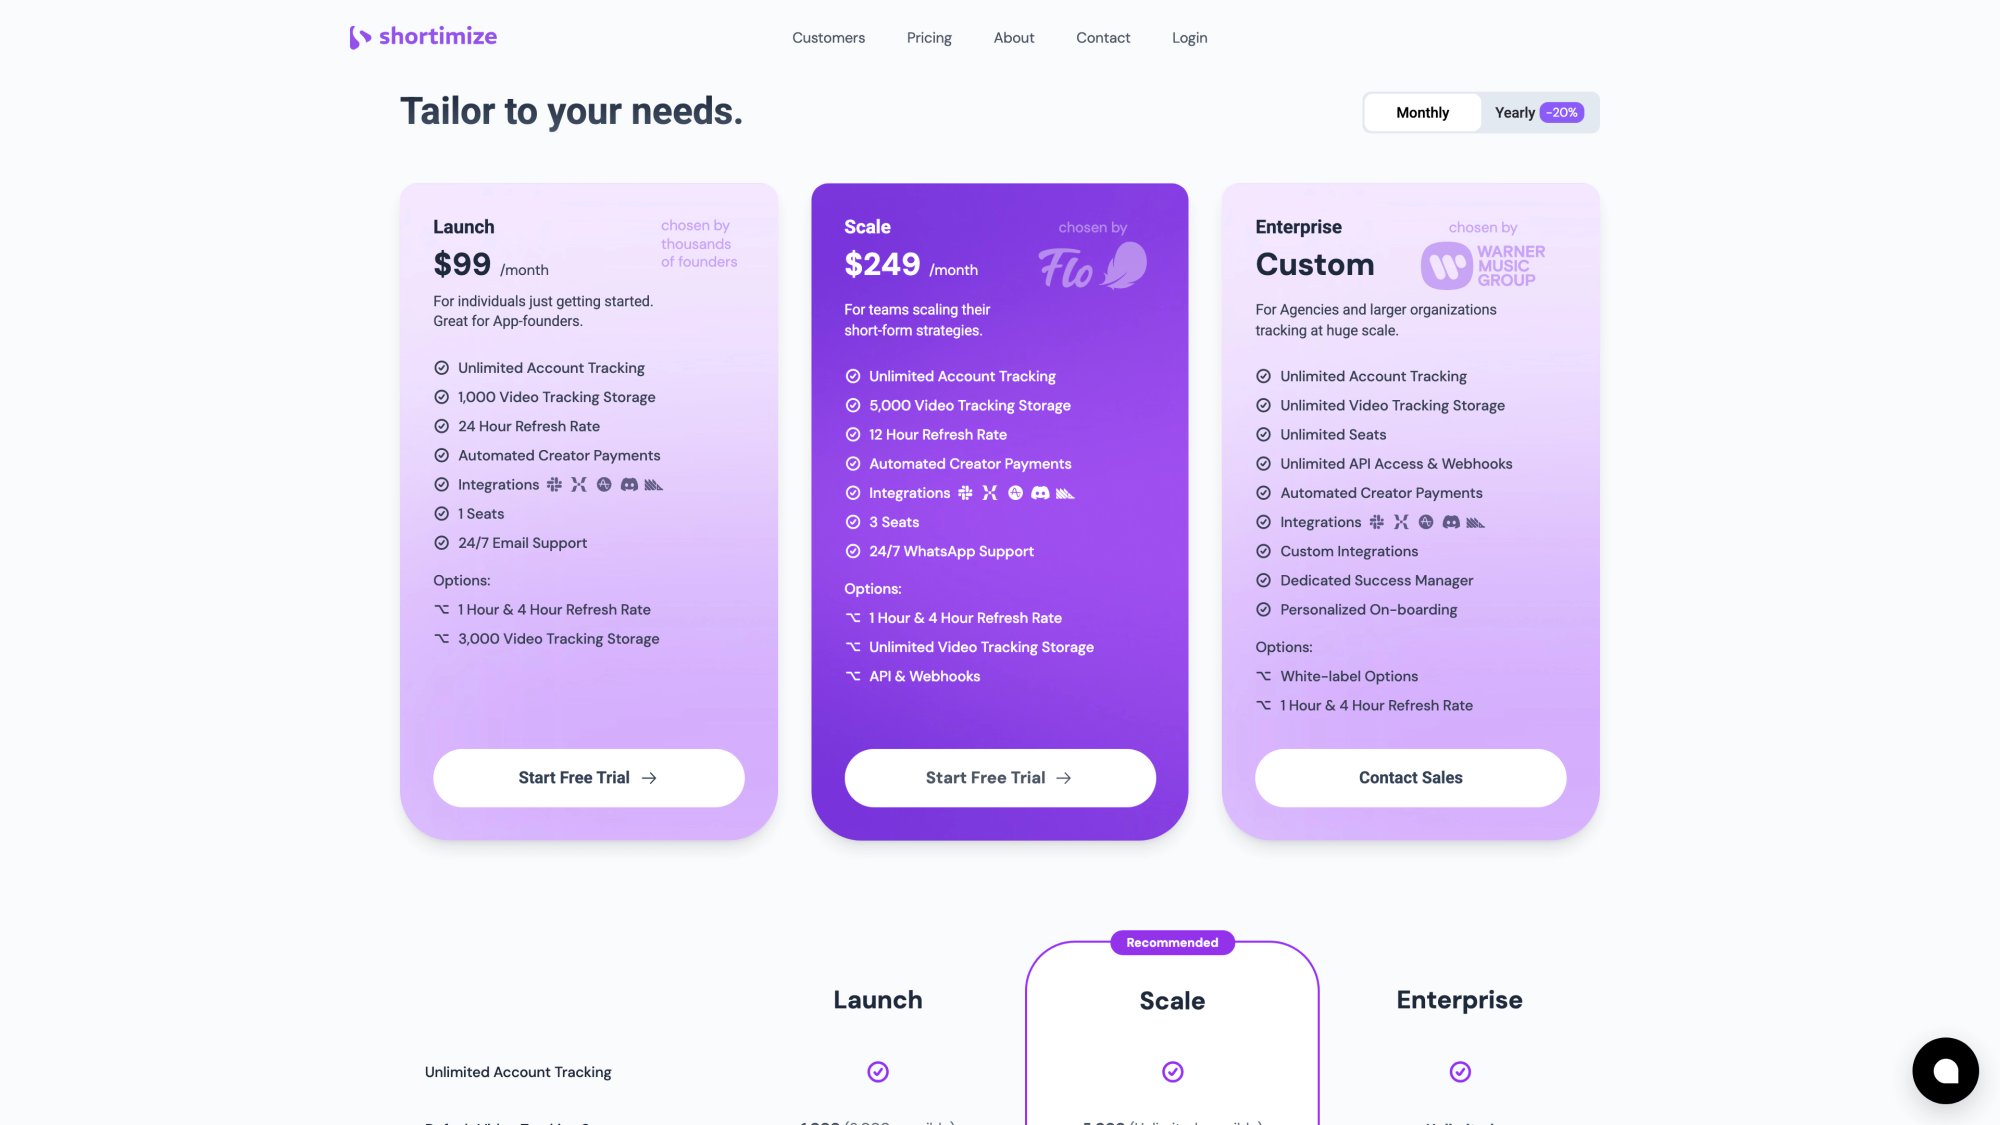
Shortimize: Cross-Platform Video Analytics Dashboard
Shortimize lets you track any public TikTok or Instagram account by simply entering the handle or URL. It automatically pulls metrics for that influencer's videos and posts: views, likes, comments, posting schedules, engagement rates, and highlights top-performing content.
For influencer campaigns, you can:
• Create a Collection of all your campaign influencers in one dashboard
• Monitor every new TikTok or Reel they post with automatic metric updates
• Compare performance across platforms side by side
• Spot viral outliers (videos trending 20% above that creator's average)
• Export all data for detailed analysis
Shortimize's Business plan refreshes data every 12 hours, so you're tracking campaign progress in near real-time without manual work. (Full disclosure: Shortimize is our product, built specifically as a "single source of truth" for short-form video analytics.)
When to Use Tracking Tools vs Manual Spreadsheets
One-off campaign with a single influencer? Manual tracking in a spreadsheet works fine.
Ongoing influencer program or multiple creators? Invest in a platform. The time savings and insights quality justify the cost.
Cross-platform analytics tools also surface insights like "TikTok videos posted on Saturday performed 2X better than Wednesday" or "Influencer A's TikTok had 3X the engagement rate of their Instagram." These are patterns that guide future strategy.
Studies show that influencer tracking software can save brands approximately 100 hours monthly by automating influencer tracking and reporting. The ROI of these tools comes from consistency (standardized metrics across creators), error reduction (no manual copy-paste mistakes), and insight discovery (patterns you'd miss in spreadsheets).
How to Monitor Engagement Quality and Audience Sentiment
Not all engagement is equal.
A thousand bot comments mean nothing. A hundred genuine questions about your product mean everything.
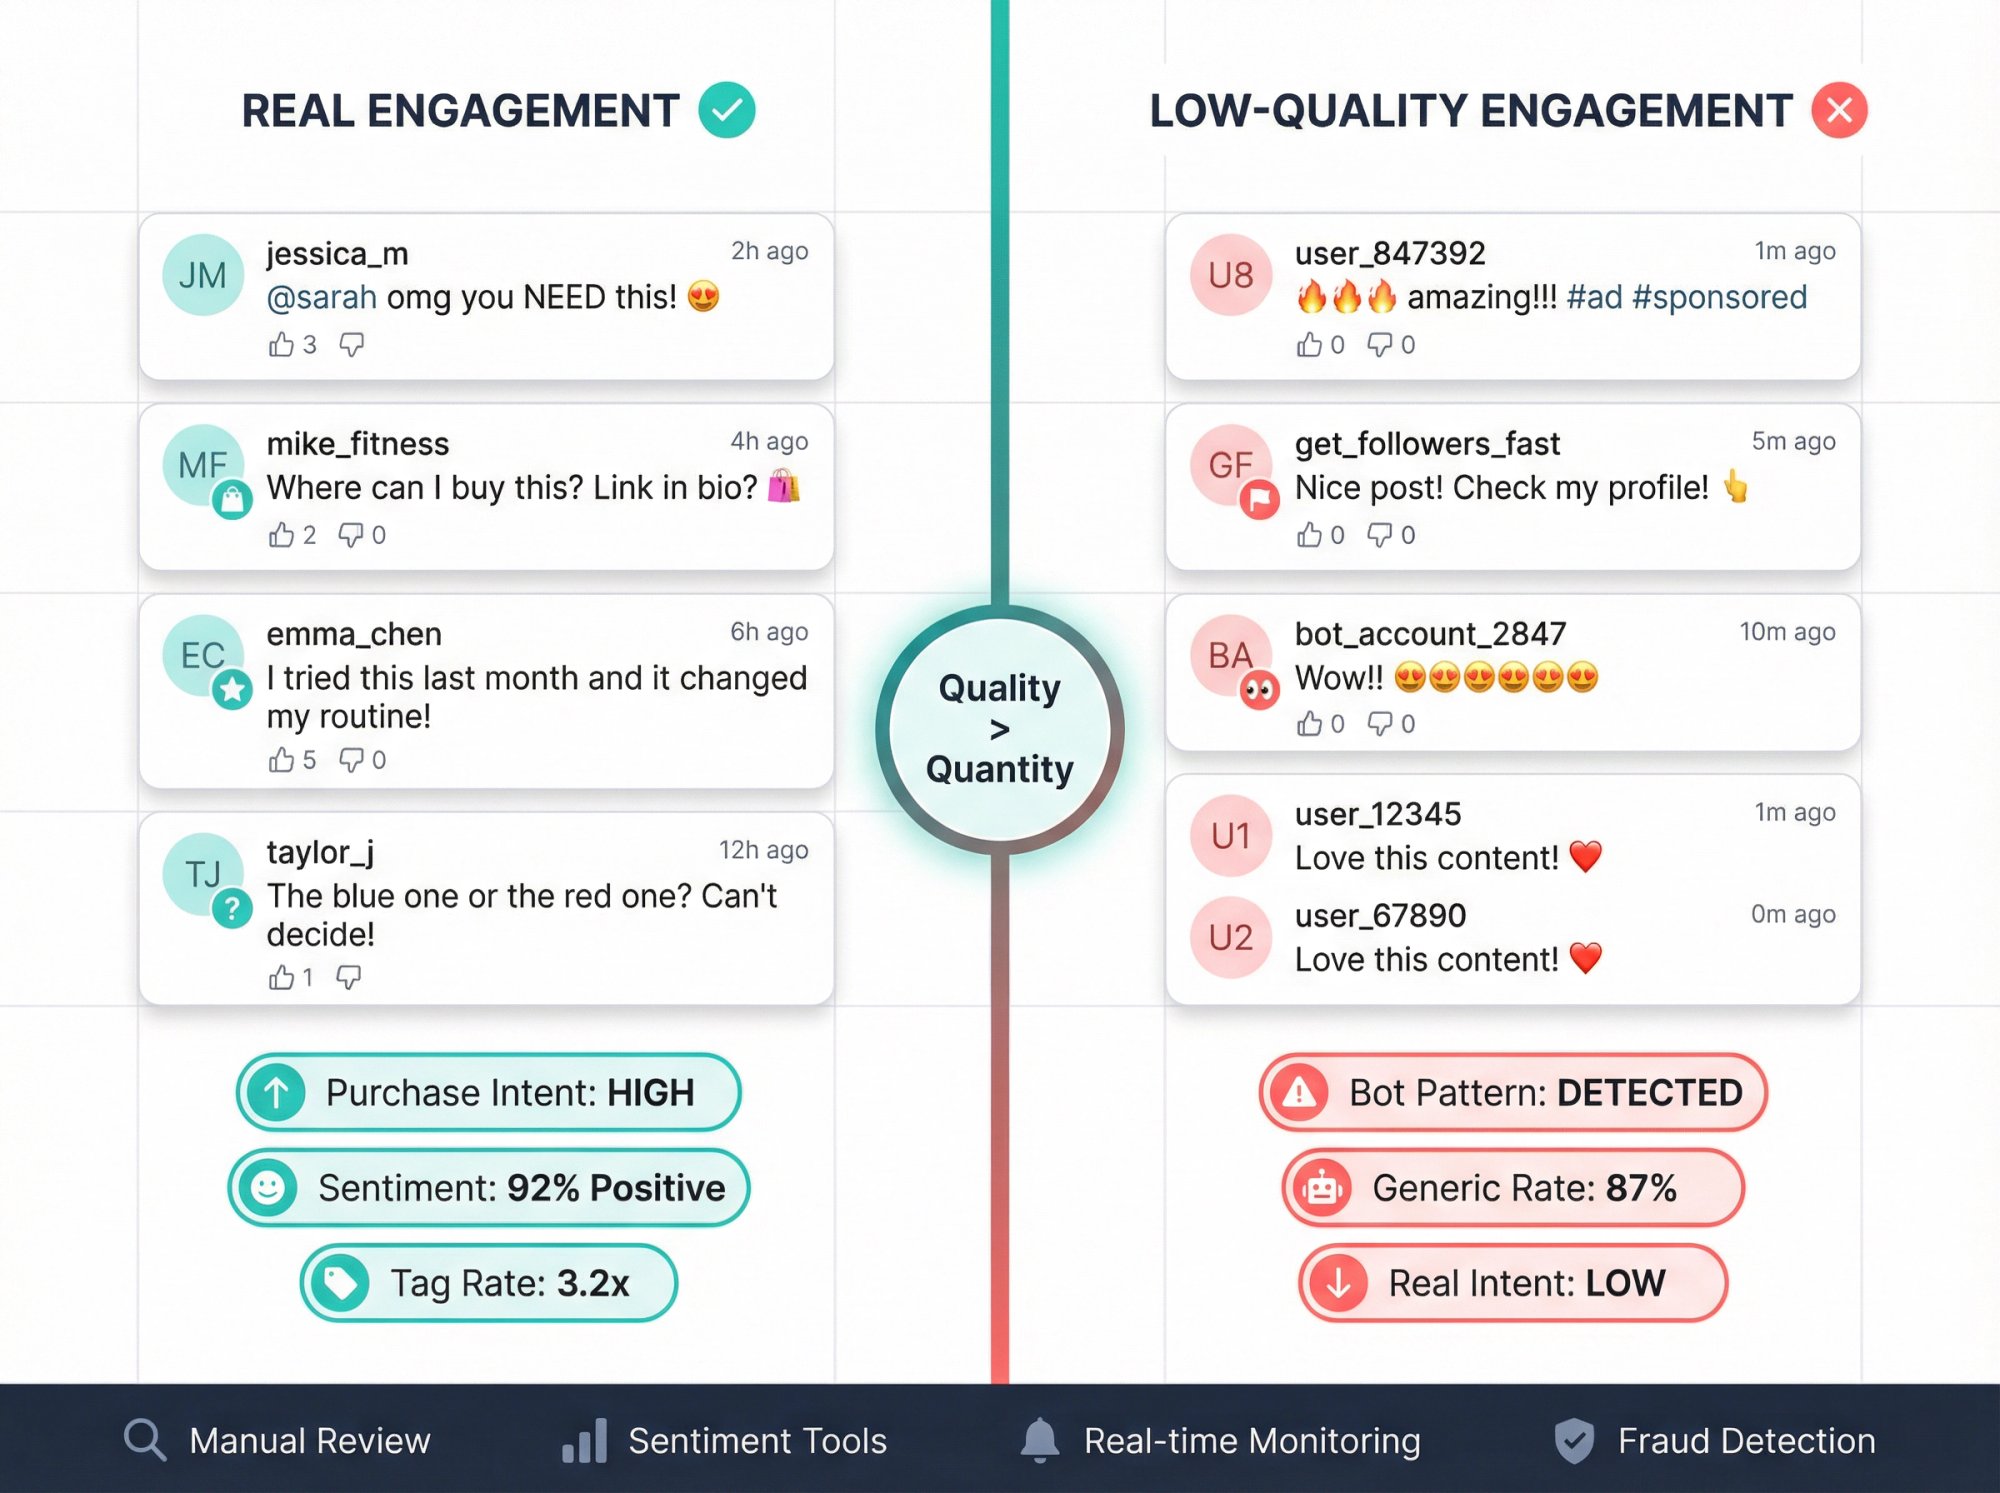
How to Analyze Comment Quality for Real Audience Response
Manually review comments on influencer posts to gauge real audience response:
• Are people tagging friends (strong shareability signal)?
• Are they asking where to buy (purchase intent)?
• Are they sharing personal stories related to your product (deep engagement)?
• Are comments generic or spammy (#ad 🙄)?
If 50 people comment "I need this, where do I buy?", that's a massive buying signal. Make sure the purchase path is crystal clear. Respond through the influencer or jump in directly if appropriate.
Negative sentiment requires immediate attention. If you see misinformation spreading ("I heard bad reviews") or quality concerns ("This looks cheap"), address it quickly through your influencer or brand channels.
How to Use Social Listening Tools for Sentiment at Scale
Social listening platforms automate sentiment analysis across thousands of mentions:
• Set up alerts for your brand keywords on TikTok, Instagram, Twitter, and Reddit
• Track your campaign hashtag to measure participation and UGC
• Quantify sentiment (e.g., "80% positive" indicates successful reception)
For campaigns with branded hashtags, track how the hashtag performs. Search the hashtag on TikTok to see total videos and views. On Instagram, check post counts. Record these numbers at campaign start and end.
If your hashtag #BrandChallenge2025 goes from 0 posts to 1,000 posts with 5 million combined views, you've sparked genuine participation beyond the paid influencer content.
How to Measure Brand Lift From Influencer Campaigns
Beyond digital metrics, larger brands sometimes run surveys to measure influencer campaign impact on brand perception:
• "Have you heard of [Brand]?" (awareness lift)
• "How likely are you to purchase [Product]?" (purchase intent)
• "How did you hear about us?" (attribution validation)
If you have the resources, pre/post campaign surveys reveal sentiment shifts that pure engagement metrics miss.
How to Compare TikTok vs Instagram Campaign Performance
When you run campaigns on both platforms, you'll see performance differences. Here's how to interpret them correctly.
Understanding Platform-Specific Strengths
TikTok excels at viral reach. The For You page algorithm can push an influencer's video to millions who don't follow them. Great for top-of-funnel awareness. But funneling viewers to action is harder (links in captions don't work).
Instagram delivers higher-intent engagement. Content mostly reaches followers plus Explore traffic (smaller reach but often better quality). Story link stickers and bio links make driving traffic easier.
Each platform has unique audience advantages. TikTok might hit 100,000 younger users while Instagram reaches 20,000 older users. Both are valuable for expanding your demographic range.
How to Interpret Engagement Rate vs Total Reach
Don't panic if TikTok shows lower engagement rate but massive reach while Instagram shows higher percentage engagement but smaller reach. This is normal.
TikTok's feed exposes content to many non-followers (great for reach). Instagram content often hits mostly followers (who engage more consistently).
Use total engagements (likes + comments + shares) to compare raw interaction volume. Factor in that one engaged Instagram user who clicks through to your site might equal five passive TikTok scrollers.
Map metrics to goals: awareness = TikTok views matter most; traffic = Instagram clicks matter most.
How to Calculate Cost Per Result by Platform
Calculate platform-specific efficiency:
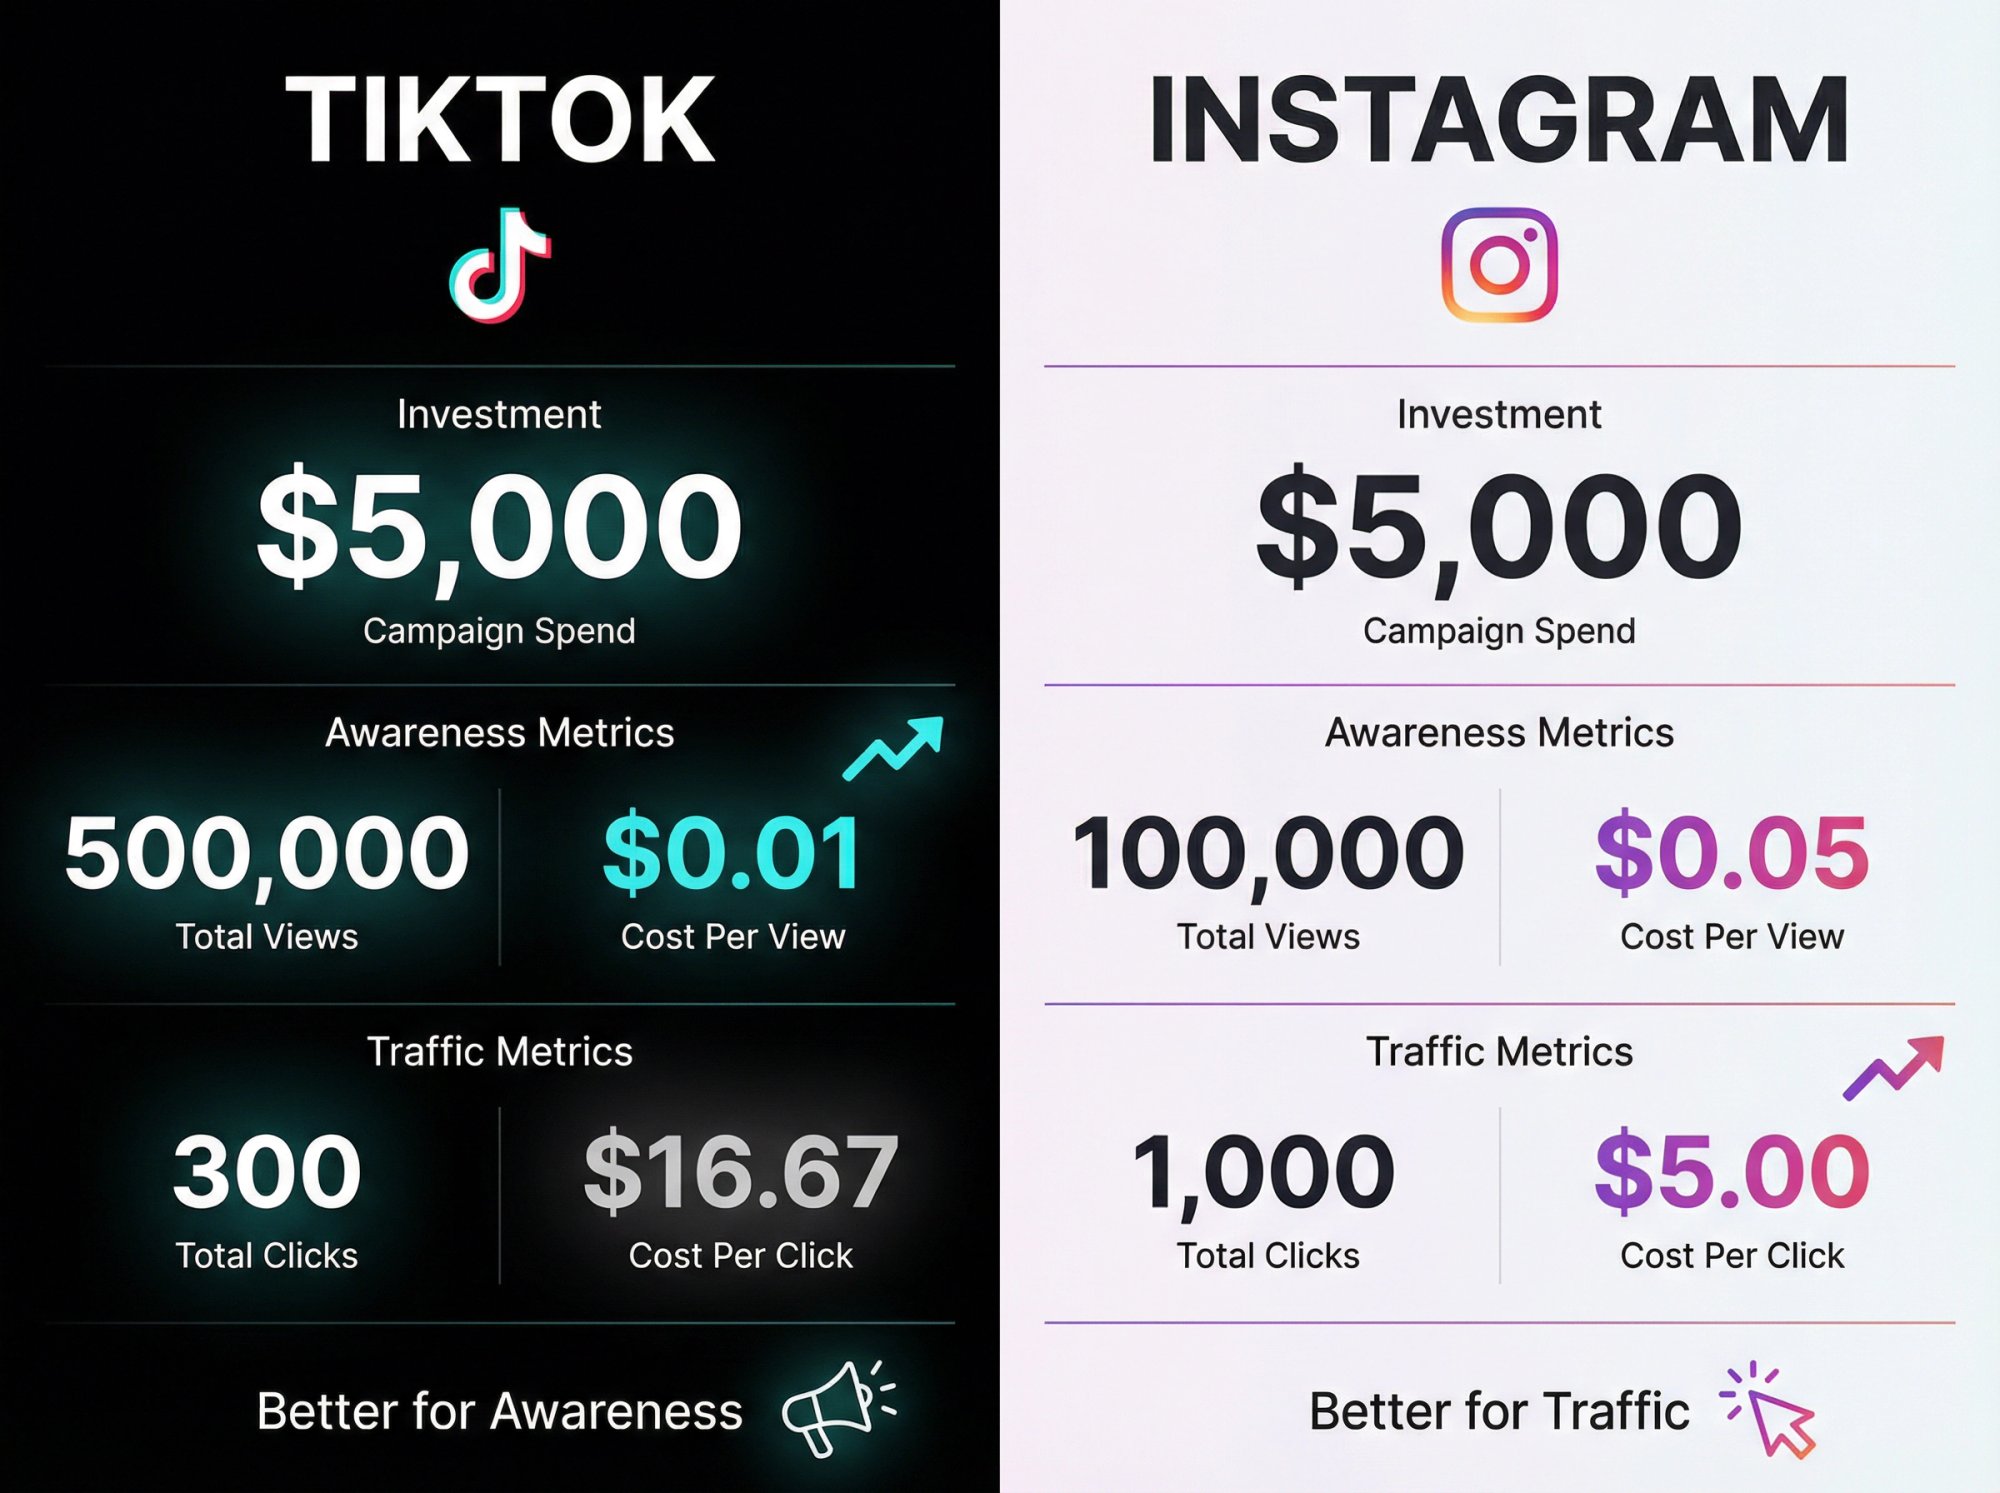
| Campaign Investment | TikTok Performance | Instagram Performance |
|---|---|---|
| Total Spend | $5,000 | $5,000 |
| Awareness Metrics | ||
| Total Views | 500,000 | 100,000 |
| Cost Per View | $0.01 | $0.05 |
| Traffic Metrics | ||
| Total Clicks | 300 | 1,000 |
| Cost Per Click | $16.67 | $5.00 |
| Conclusion | Better for awareness | Better for traffic |
If your goal was awareness, TikTok's low cost per view wins. If your goal was traffic, Instagram's better click efficiency wins.
This cost-per-result analysis determines future budget allocation between platforms.
How to Create Unified Campaign Reports That Show Full ROI
Combine insights for complete ROI pictures:
Example unified report: "TikTok + Instagram campaign with @JaneDoe reached 600K people (500K TikTok, 100K Instagram), generated 50K engagements (40K TikTok, 10K Instagram), drove 1,300 website visits (300 TikTok, 1,000 Instagram), and 200 sales (50 TikTok, 150 Instagram) for $20K revenue. Overall 4X ROI. TikTok excelled at reach and engagement; Instagram excelled at clicks and conversions."
This summary shows the full picture: TikTok created awareness and buzz, Instagram drove tangible leads and sales. Both aspects matter.
By comparing data side by side, you'll discover patterns like "TikTok seeds initial interest; Instagram closes the deal" or vice versa, depending on your product.
Best Practices for Long-Term Influencer Performance Tracking
Make tracking a habit instead of a heroic one-time effort.
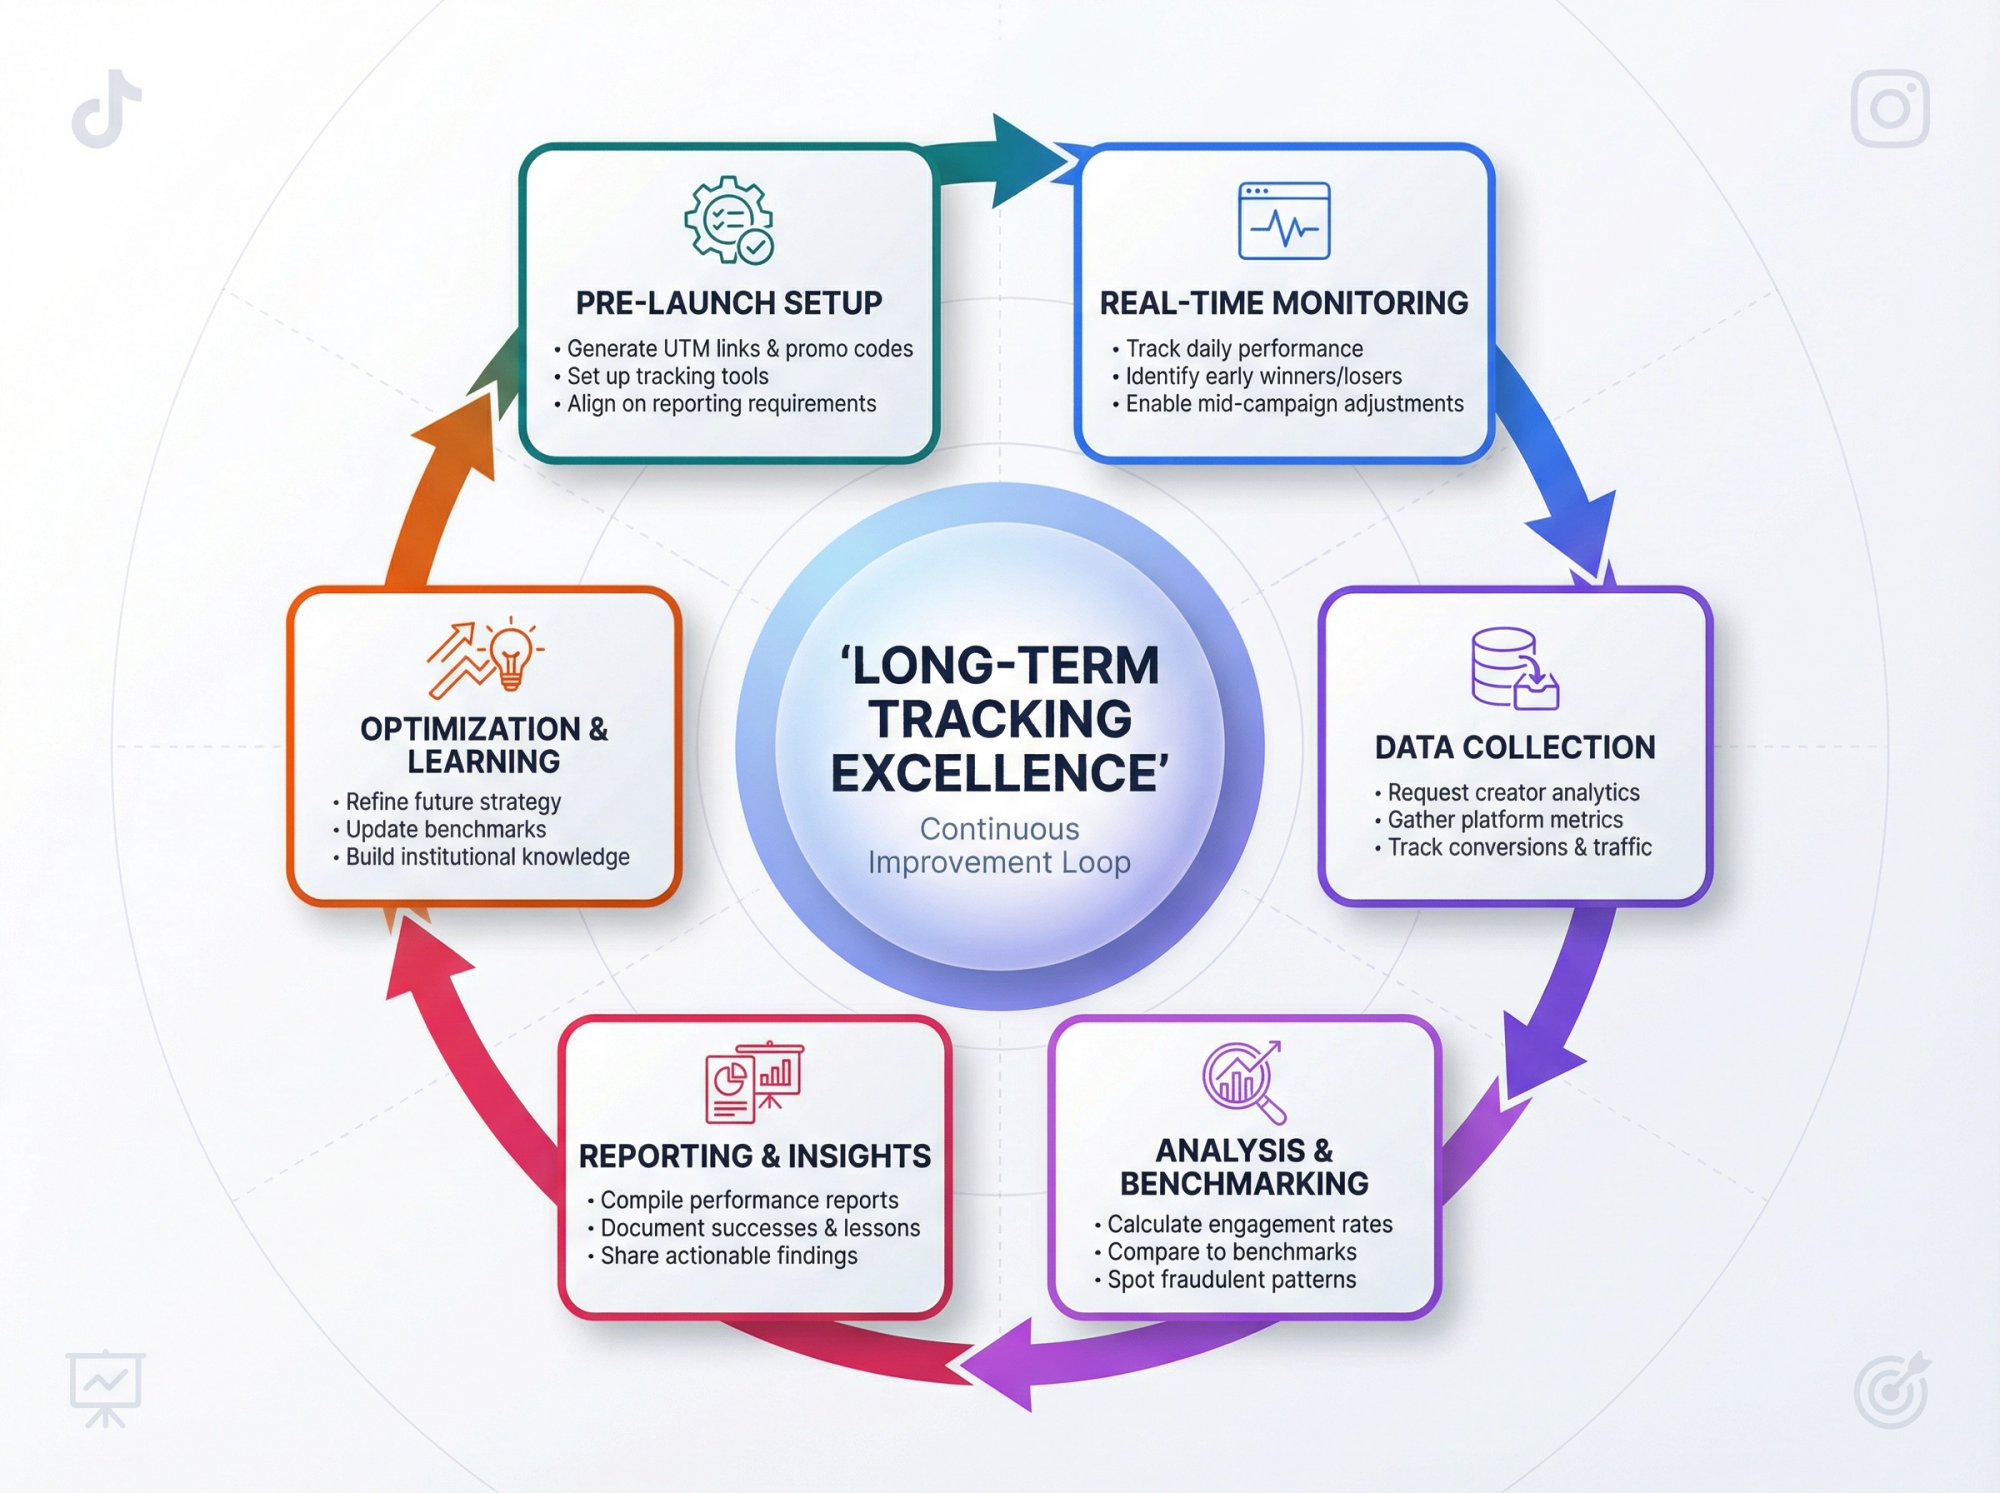
Always Set Up Tracking Before Campaigns Launch
Generate UTM links and promo codes before campaigns start. If using Shortimize, add influencer profiles to your dashboard ahead of time so data collection begins on day one.
Retroactive tracking is painful and often incomplete.
How to Align on Reporting Requirements With Influencers
Add reporting requirements to influencer agreements:
"Influencer will provide performance report including Instagram Insights and TikTok Analytics within 7 days of posting."
Create a simple template where creators upload screenshots or input numbers. Many influencers already prepare media kits. Aligning expectations prevents chasing them later.
Why You Should Track During Campaigns, Not Just After
Monitor performance in real-time or at least daily during active campaigns.
If a TikTok video is flopping after day one (far below expected views), you can ask the influencer to post an extra Story or boost the content. If Instagram Story clicks are weak, prompt them to add a reminder before the 24-hour window expires.
Mid-campaign optimization based on early data improves final outcomes significantly.
How to Build Benchmarks and Learn From Every Campaign
Use past campaign data to set benchmarks for new ones. "Last quarter's TikTok collab got 5% engagement and $10 CPA. Let's beat that."
If this is your first campaign, use industry benchmarks (like the ROI and engagement stats mentioned earlier) for reasonable expectations.
When results fall short, investigate: wrong influencer? poor content? bad timing? Data becomes diagnostic, not just descriptive.
How to Spot and Avoid Fraudulent Influencer Metrics
Recent data indicates that one in four influencers has purchased fake followers at some point. If numbers look suspiciously high or engagement seems bot-driven, investigate.
Red flags:
• 5,000 generic comments on a post (likely comment pods or bots)
• Inconsistent cross-platform performance (1M Instagram followers but only 10K TikTok followers might signal purchased audiences)
• Normally 2% engagement but your sponsored post got 15% (could be incentivized or fake)
Influencer analytics tools can detect suspicious patterns automatically. Always sanity-check quality, not just quantity.
How Multi-Touch Attribution Captures Delayed Conversions
Influencer marketing often contributes to sales in combination with other touchpoints. A customer might see a TikTok video, search your brand a week later, then purchase.
Track overall lift: Compare website sales during the campaign period vs. comparable periods without campaigns. Notable increases that can't be explained by other factors likely reflect influencer impact, even if direct tracking only caught some conversions.
How to Turn Campaign Data Into Actionable Reports
Compile learnings into clear reports with charts showing:
• Successes (e.g., "TikTok video exceeded view target by 50%")
• Lessons (e.g., "Instagram needed more frequent Story reminders")
• Action items (e.g., "Allocate 60% of next budget to TikTok based on engagement efficiency")
Data-driven recaps justify spend and build institutional knowledge for continuous improvement.
Your Complete Framework for Tracking Influencer Campaigns
The whole point of tracking isn't filling spreadsheets. It's making better decisions.
When measurement becomes systematic, you move from guessing to knowing. You can answer "What did we get from that campaign?" with hard numbers and strategic insights.
Recent studies show that the most successful marketers aren't chasing virality; they're building systems that deliver repeatable, measurable value. Tracking is that system.
Your Complete Influencer Tracking Framework
| Step | Action | Key Tools/Methods |
|---|---|---|
| 1 | Define goals and KPIs upfront | Clear objectives guide measurement (awareness, engagement, traffic, sales) |
| 2 | Measure platform-native engagement | Views, reach, likes, comments, shares, saves, follower growth. Compare benchmarks |
| 3 | Track off-platform actions | UTM-tagged links + unique promo codes for attribution |
| 4 | Gather creator analytics | Request Instagram Insights and TikTok Analytics |
| 5 | Use tools to unify data | Platforms like Shortimize aggregate cross-platform metrics |
| 6 | Monitor quality, not just quantity | Analyze sentiment to ensure authentic engagement |
| 7 | Compare platforms holistically | Understand complementary roles in the funnel |
| 8 | Apply insights continuously | Refine influencer selection, content strategy, and budget allocation |
Influencer marketing is growing. 86% of marketers plan to use influencers in 2025. The brands that master performance tracking will capture the most value from their investments.
By implementing these tactics, you ensure your TikTok and Instagram influencer efforts aren't just creative and engaging. They're measurable, optimizable, and profitable.
The true power of influencer marketing emerges when creativity meets measurement. Track what matters, eliminate what doesn't, and build campaigns that deliver repeatable results.