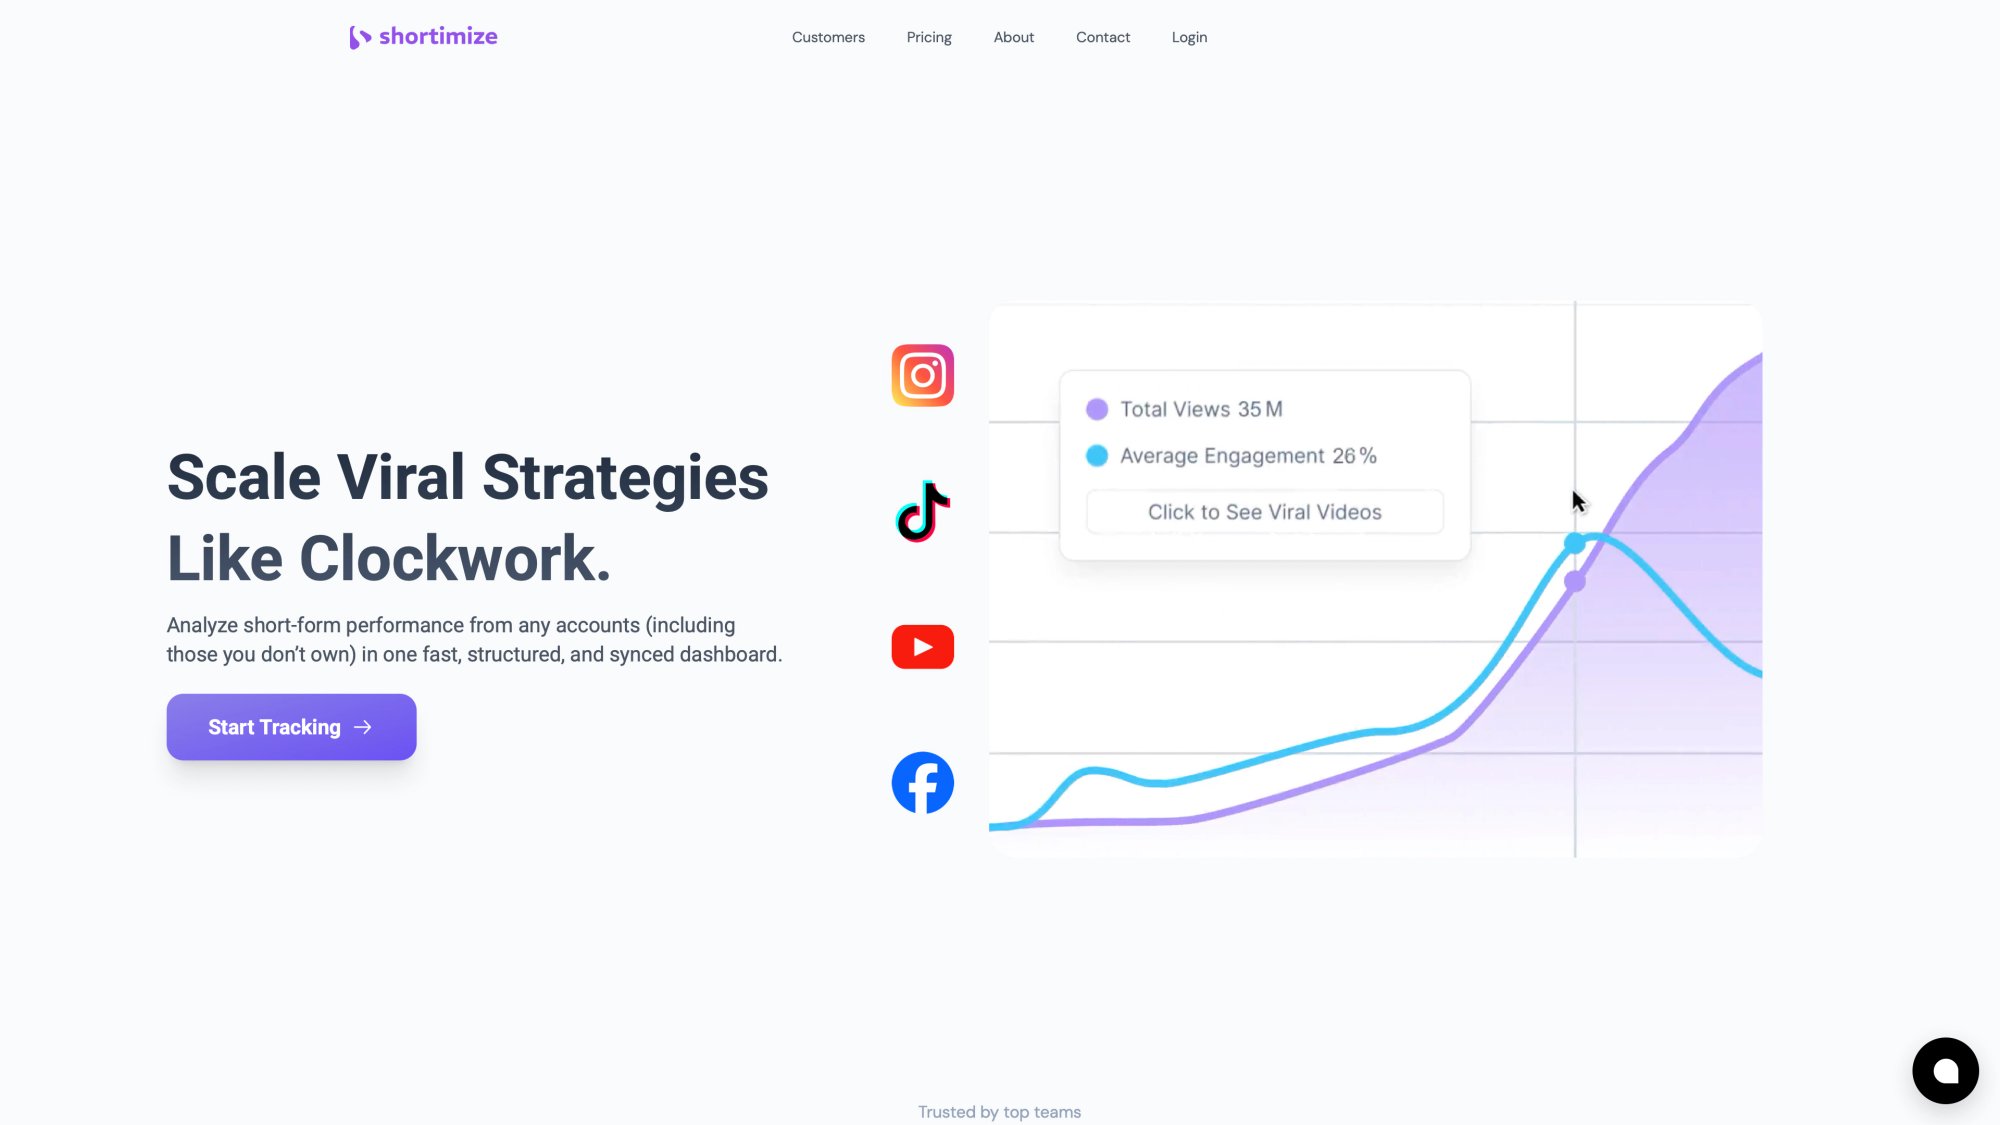
View counts are vanity metrics. You probably already know this. A video with 500,000 views that nobody actually watched won't do much for your growth, your algorithm standing, or your business. The real measure of short-form video success? Retention: how much of your video people actually watch before they swipe away.
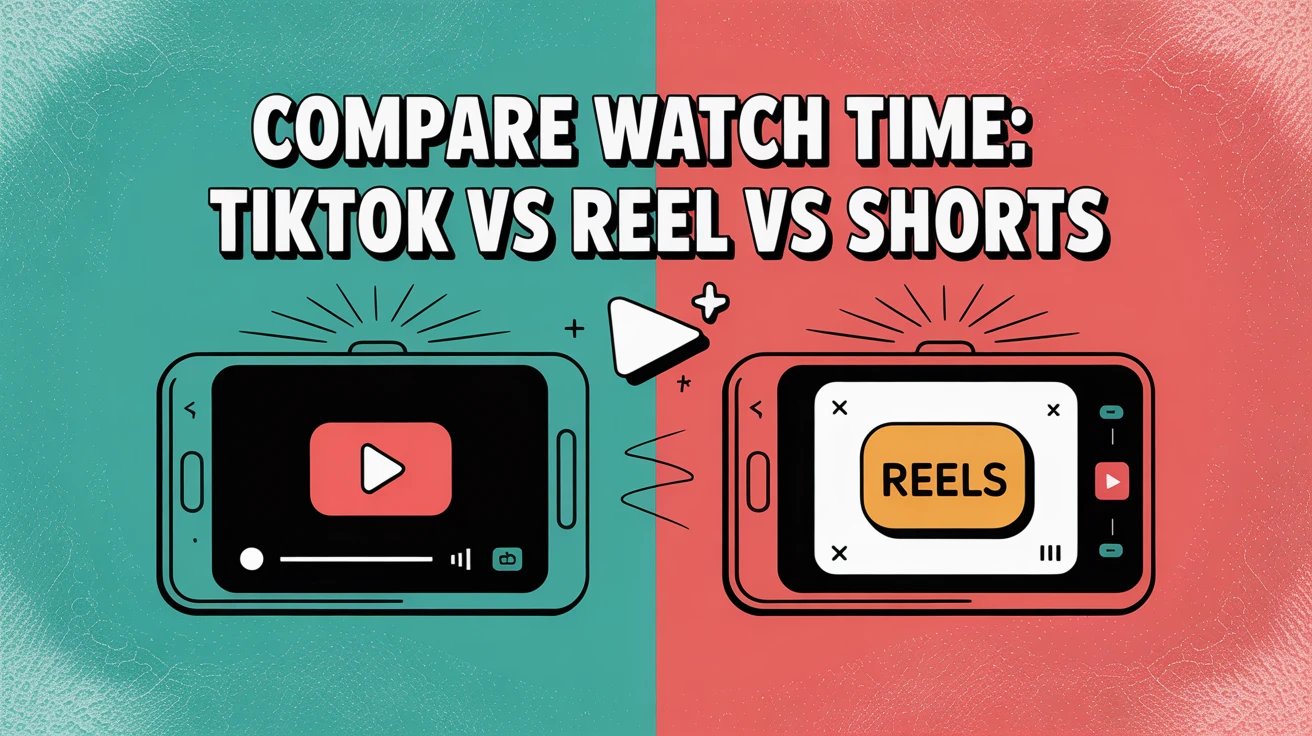
The problem is that TikTok, Instagram Reels, and YouTube Shorts each measure watch time differently. They use different terms, different calculations, and different dashboards. So when you're trying to figure out which platform your content actually performs best on, you're comparing apples to oranges to… pomegranates?
This guide breaks down exactly how each platform measures retention, what the numbers actually mean, and how to compare performance across all three so you can make smarter decisions about your content strategy.
Why Retention Matters More Than Views
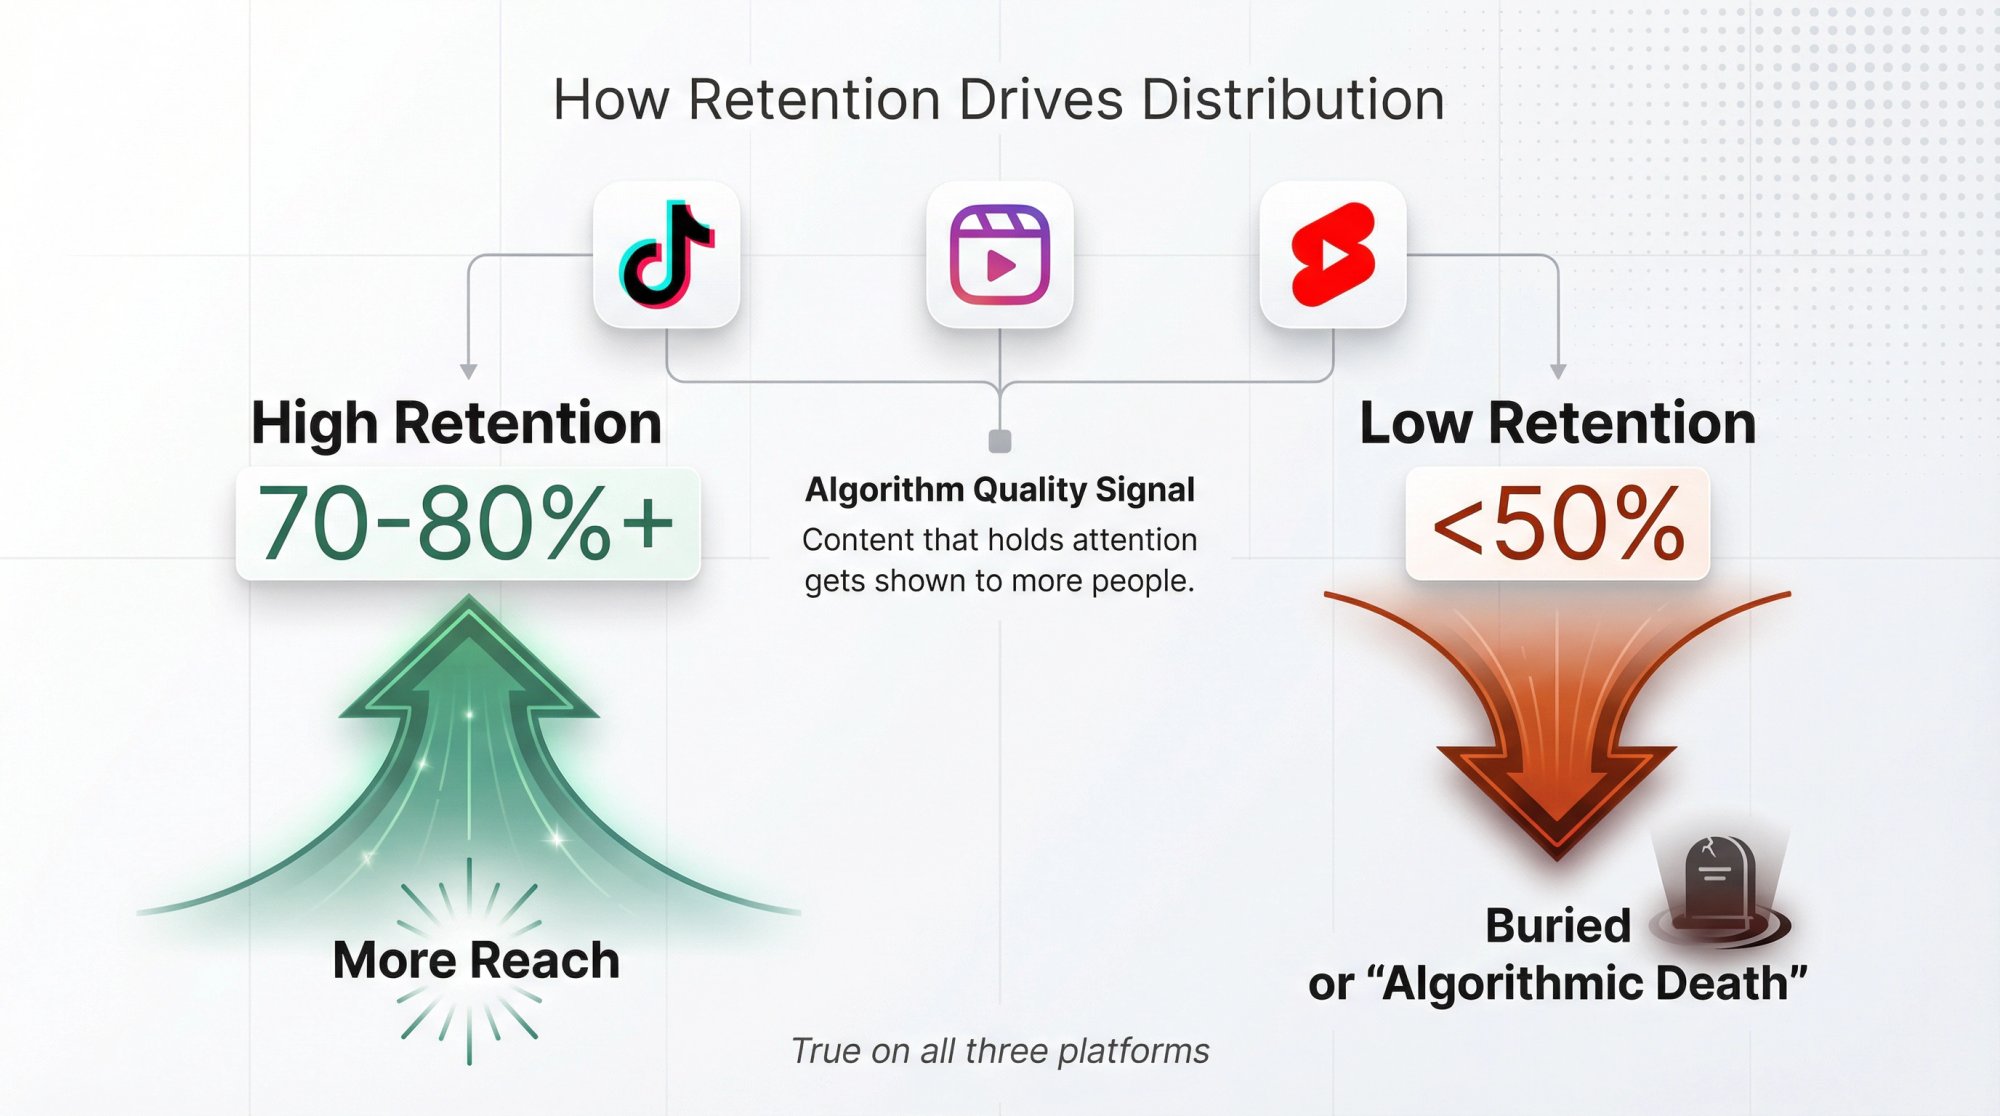
Every major short-form platform has built its recommendation algorithm around one core principle: content that holds attention gets shown to more people. The algorithm treats high retention as a quality signal. When viewers watch your video all the way through (or even replay it), the platform interprets that as "this content is worth showing to others." This is central to effective social media monitoring strategy.
| Platform | Primary Retention Signal | Secondary Signals |
|---|---|---|
| TikTok | Completion rate (% watched to end) | Replays, average watch time |
| Instagram Reels | Retention percentage + absolute seconds | Skip rate (first 3s), engagement |
| YouTube Shorts | Average % viewed | Engaged views, viewed vs swiped |
The mechanics differ slightly, but the underlying logic is identical. If 70-80% of viewers watch your TikTok to the end, the algorithm is far more likely to push it to new audiences. If people swipe away from your YouTube Short after two seconds, it's dead on arrival. If your Reels have a sky-high skip rate, Instagram buries them. Understanding what is social media monitoring helps you track these patterns systematically.
What this means in practice: Retention directly influences distribution. High retention = more reach. Low retention = algorithmic death. This is true on all three platforms.
How TikTok Measures Watch Time
TikTok gives creators fairly detailed retention analytics. Here's what you're looking at when you analyze a TikTok account:
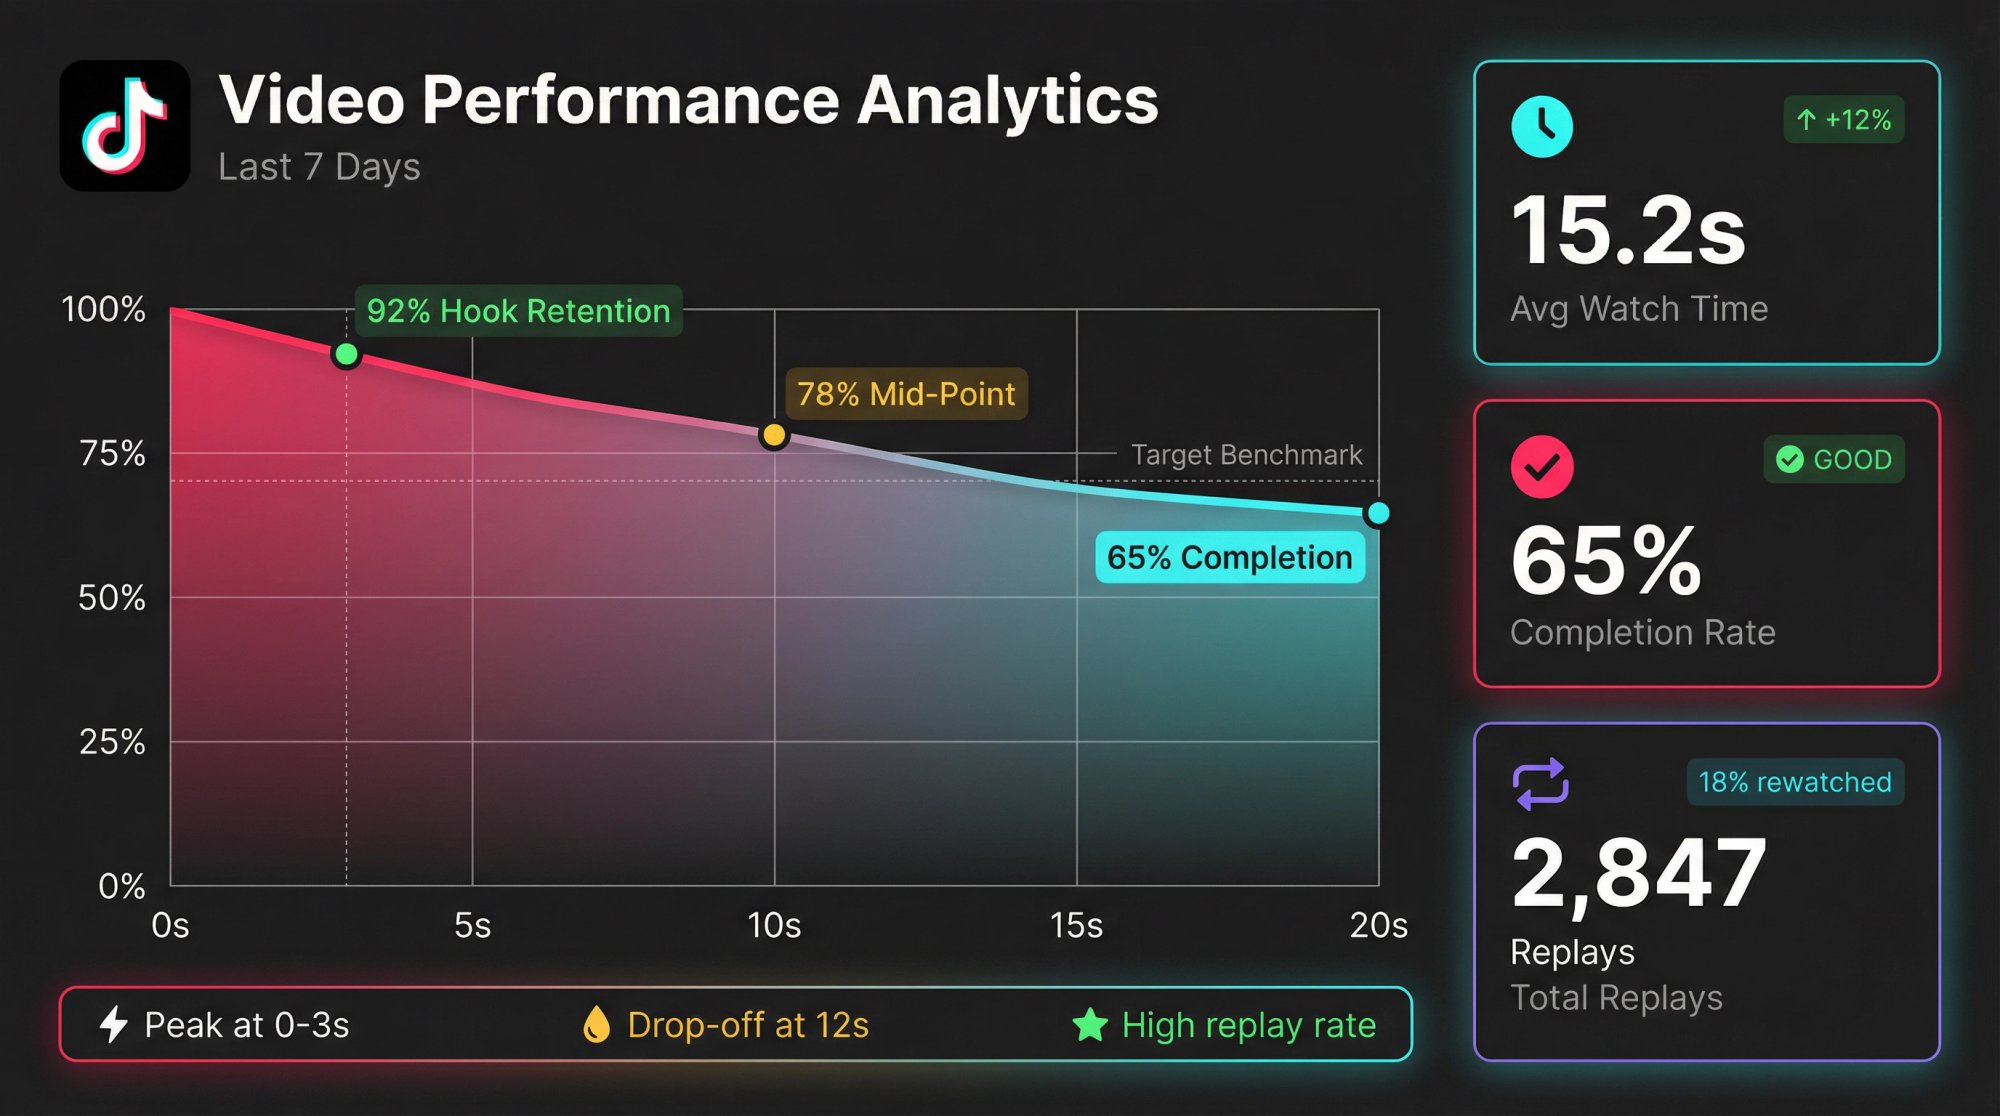
Average Watch Time is exactly what it sounds like: the average number of seconds viewers spent watching your video. If your TikTok is 20 seconds long and people watch 15 seconds on average, that's your number. This tells you in absolute terms how long you held attention. Average watch time appears in your analytics dashboard alongside other key metrics and is essential for effective TikTok SEO optimization.
Completion Rate (sometimes called watch time percentage or retention rate) is the percentage of viewers who watched to the end. This is arguably TikTok's most important metric. A high completion rate, say 70% or above, strongly indicates engaging content. The algorithm uses this as its primary quality signal. Learn more about TikTok's 2025 algorithm update to understand how completion rate factors into distribution.
Replays track how many times viewers rewatched your video. TikTok actually shows "watched full video" and "watched more than once" percentages in analytics. A video so compelling that people loop it multiple times? That's algorithmic gold. Some viral TikToks achieve over 100% average watch time because the average viewer watches more than the video's full length.
The Retention Graph shows second-by-second where viewers drop off. This is invaluable for diagnosing problems. A steep drop at 3 seconds means your hook isn't working. A dip at 15 seconds might mean you lost momentum. TikTok highlights the percentage of viewers still watching at various marks and shows where maximum drop-off occurs. You can explore these patterns deeper through TikTok influencer analytics tools.
What Is a Good TikTok Retention Rate?
Based on industry analysis and creator experience, here are reasonable targets:
-
Short TikToks (<15 seconds): Aim for 80%+ completion
-
Medium TikToks (15-30 seconds): 60%+ completion is solid
-
Longer TikToks (30+ seconds): 50% or better is respectable
-
Overall target: At least 70% completion rate for consistent performance

According to Shortimize's analysis of the YouTube Shorts algorithm (which shares many principles with TikTok's approach), retention is the clearest signal of viewer interest across all short-form platforms. If your retention consistently falls below 50%, viewers are losing interest early, and that's a red flag.
Understanding what constitutes a good view rate for TikTok can help you set realistic benchmarks for your content strategy.
How Instagram Reels Measures Watch Time
Instagram historically emphasized engagement metrics like likes, comments, and shares. But in 2025, Reels analytics shifted heavily toward retention. Here's the current landscape when you analyze an Instagram Reels account:
The Retention Chart is relatively new. It's a visual graph showing what percentage of viewers are still watching at each moment of your Reel. This downward curve lets you see exactly where people drop off. A flat line near 100% means most people watched to the end (rare). A steep early drop means you're losing viewers in the first few seconds. Retention data appears in Professional Dashboard insights, and understanding these patterns is key to optimizing Instagram Reels reach.
Skip Rate measures the percentage of viewers who bail within the first 3 seconds. Instagram replaced the old "3-second views" metric with skip rate to emphasize how many you lose instantly. A lower skip rate is better. A great hook might yield a skip rate in the low teens or single digits. A poor-performing Reel could see 30%+ of viewers gone before they even know what the video is about. Our guide on how to analyze Instagram Reels trends and timing explores skip rate optimization.
Average Watch Time shows how many seconds viewers watched on average. Many Reels land around 7-10 seconds for typical content, meaning lots of people scroll away mid-video. Combined with video length, this essentially reflects your retention percentage.
Total Watch Time (aggregate seconds watched by all viewers) is useful for scale but less useful for comparing quality across platforms. Learn more about optimizing Instagram Reels reach for better distribution.

What Instagram Confirmed About Its Algorithm
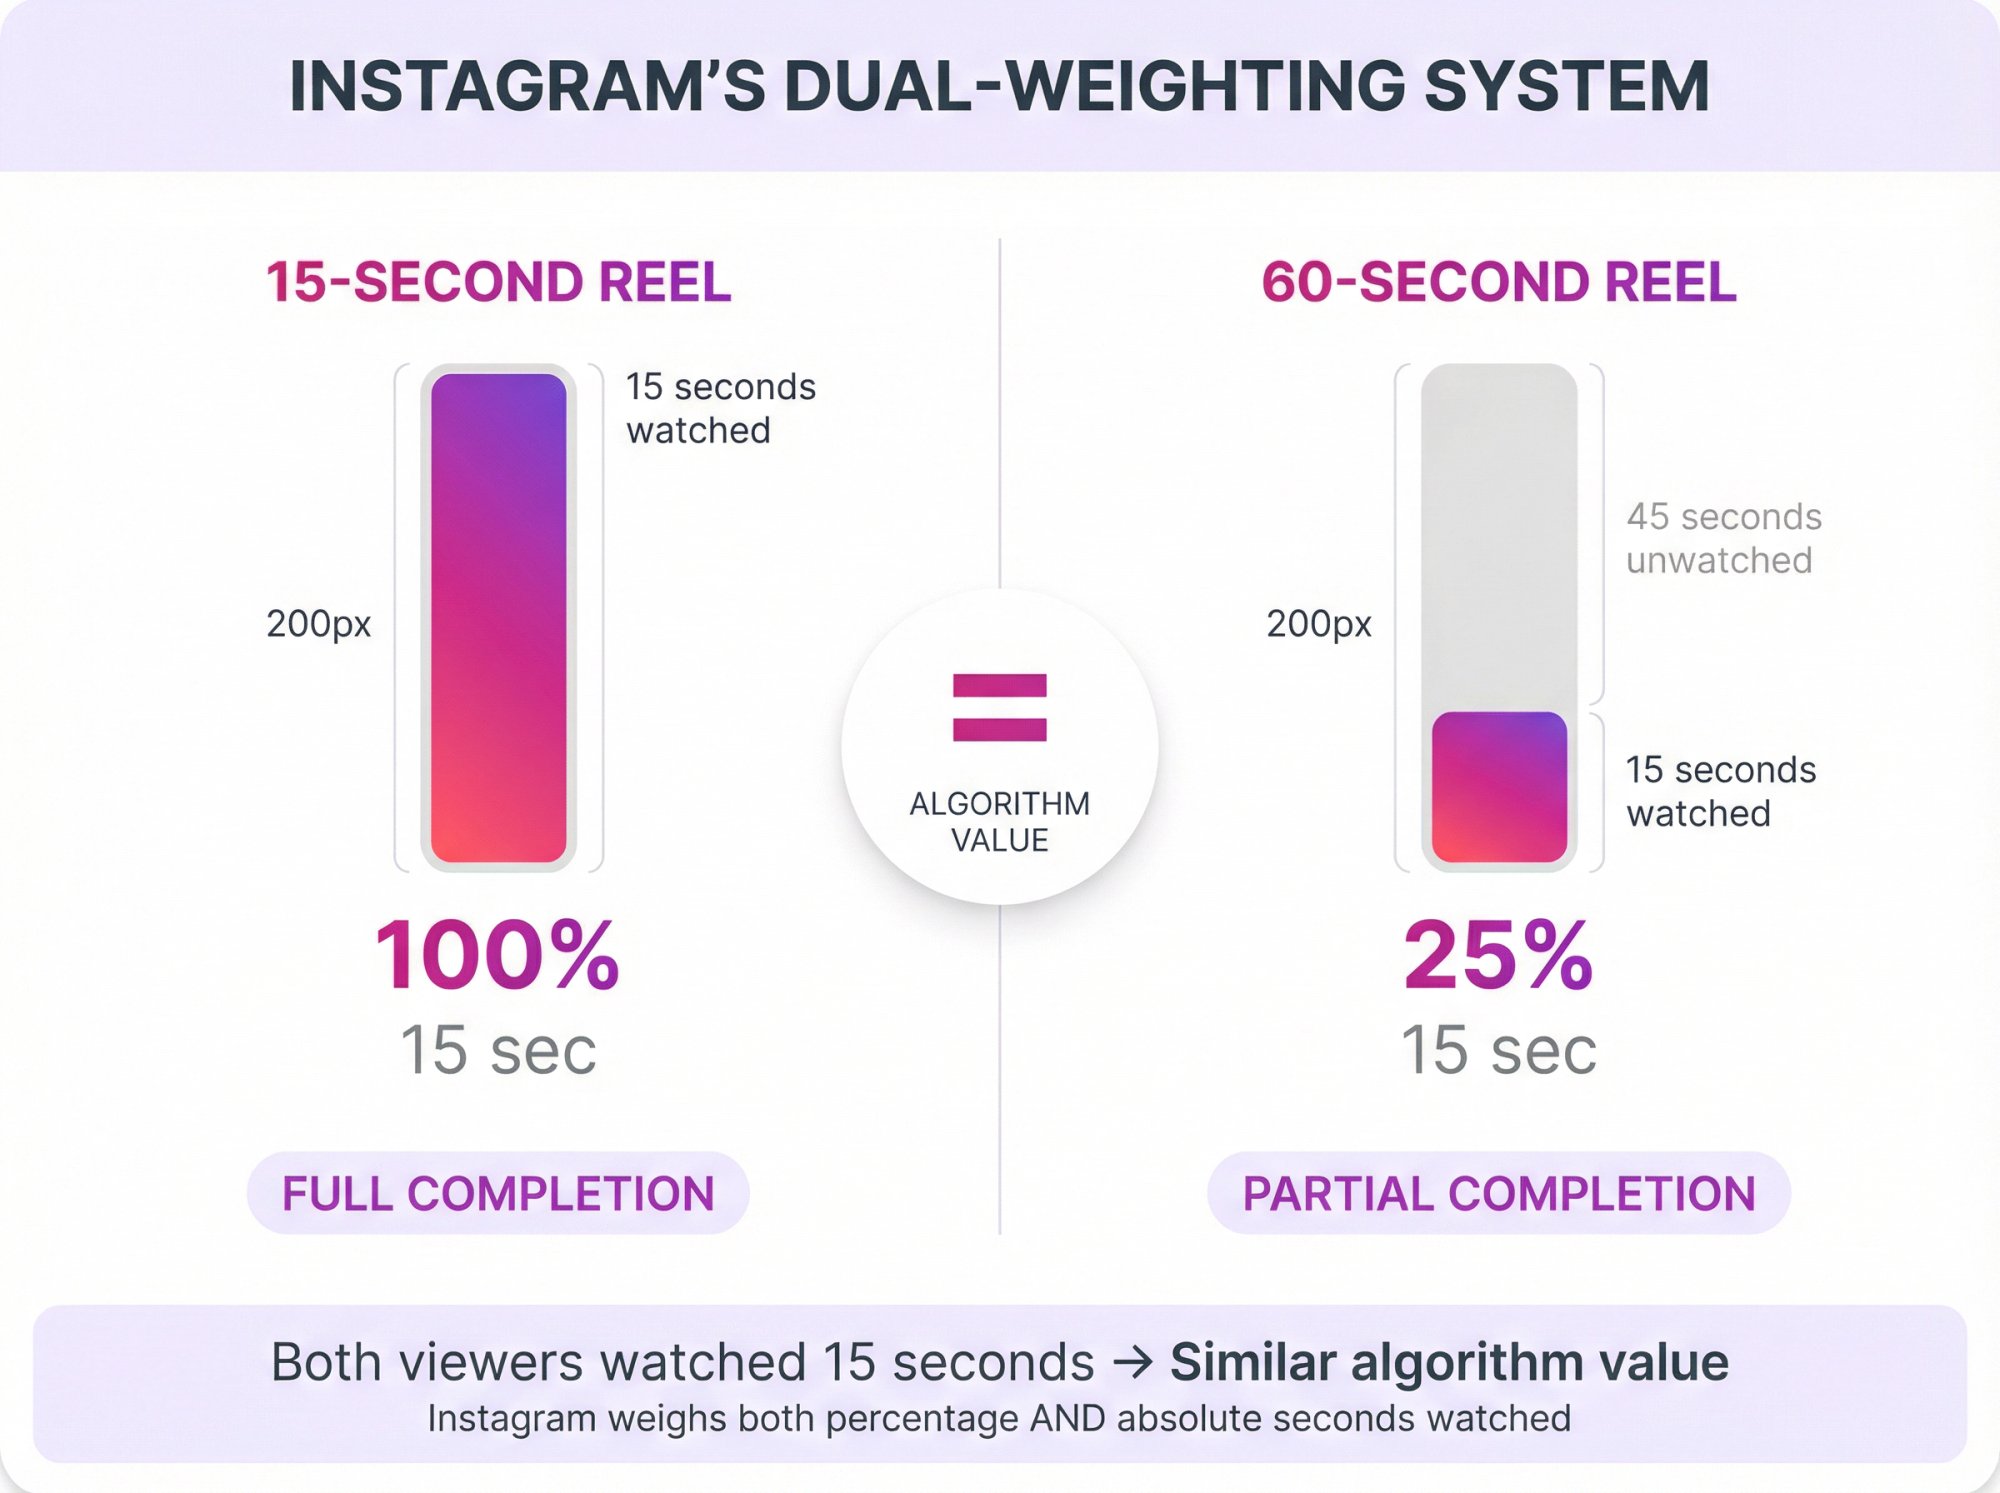
Here's something important: Instagram has stated that its algorithm weighs both percentage watched and total seconds watched for Reels. They "don't want to penalize longer videos."
Key insight: A longer Reel can still perform well even if its percentage is lower, as long as people watched a good chunk in absolute time.
For example, 15 seconds watched of a 60-second Reel (25%) might count similarly to 15 seconds of a 15-second Reel (100%) in the algorithm's view. Both kept someone watching for 15 seconds. That said, if viewers consistently bail early on your longer Reels, reach will suffer. If you're wondering why your Instagram Reels aren't getting views, poor retention is often the culprit.
What Is a Good Reels Retention Rate?
Based on creator data and platform patterns:
-> Shorter Reels (15 seconds): Target 60-70% retention to the end
-> Longer Reels (60+ seconds): 30-40% to the end can work if those who dropped off still watched 20-30 seconds
-> Skip rate: Single digits to low teens is excellent; 25%+ needs hook improvement
-> Average watch time: If most of your Reels only get 5-8 second averages regardless of length, you probably need to shorten them or strengthen early content
Learning about the best time to post on Instagram Reels can also help maximize your retention by reaching viewers when they're most engaged.
How YouTube Shorts Measures Watch Time
YouTube has long been synonymous with watch time, and Shorts are no exception. The platform provides robust retention analytics when you analyze YouTube Shorts accounts:
Average Percentage Viewed shows the average percentage of your Short that viewers watched. High-performing Shorts often hit 80-90%+ retention. If your 30-second Short averages 25 seconds watched (83%), that's excellent. If your 60-second Short averages 20 seconds (33%), that's poor retention, even though 20 seconds is a decent chunk of time. As detailed in Shortimize's guide to the YouTube Shorts algorithm, retention is a key factor in Shorts recommendations.
Average View Duration gives you the same information in seconds rather than percentage. Useful when comparing Shorts of different lengths.
The Retention Graph works like TikTok's and Instagram's: you see the curve of viewers over the video's duration, spikes where people rewatched, and dips where many left. YouTube even lets you compare retention across multiple videos to find which formats hold attention best. For A/B testing approaches, see our guide on how to use A/B testing for YouTube Shorts.
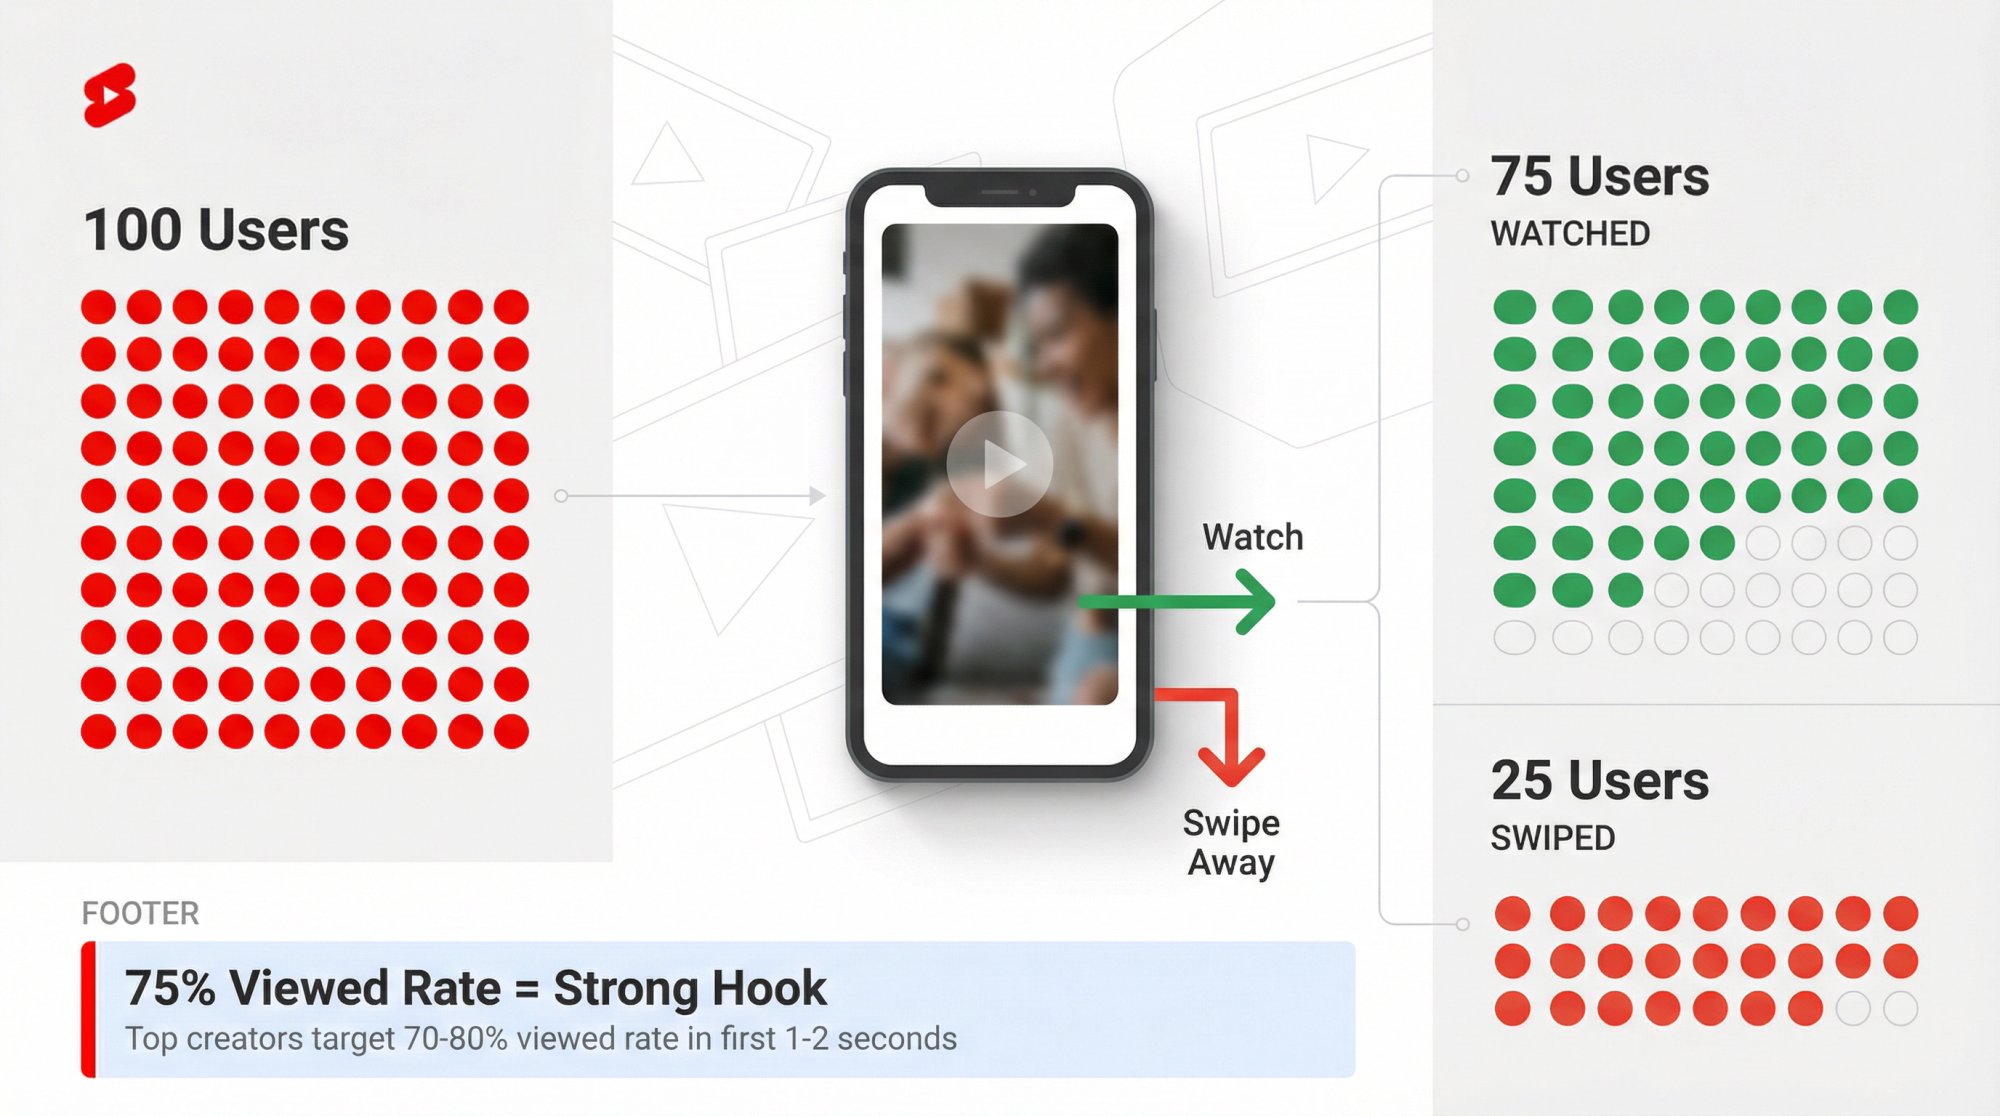
Viewed vs Swiped Rate is critical for Shorts. Because Shorts autoplay in a feed, YouTube tracks how often people actually watch versus skip past. If 100 users see the start of your Short and 75 watch at least a couple seconds while 25 swipe away immediately, that's a 75% viewed rate. That's a strong hook. Top Shorts creators aim for 70-80% "viewed" rate in the first 1-2 seconds. YouTube's official documentation on Shorts analytics provides baseline metrics for creators.
Engaged Views vs Total Views became important in March 2025 when YouTube changed how it counts Shorts views. Now any play of any duration counts as a view, even half-second scroll-bys. This made view counts explode overnight. To preserve meaningful data, YouTube introduced "Engaged Views," essentially the old view definition (watching at least 3+ seconds). Engaged views matter for monetization and for understanding genuine interest. When comparing retention, focus on average watch time, percentage viewed, and engaged view count rather than inflated raw views.
Looping and Replays factor in too. Shorts loop automatically if a viewer watches to the end without scrolling. Each loop counts as another view. Creators often design Shorts that loop seamlessly (the ending leads back to the beginning) to encourage multiple watches. If you see average view percentage above 100%, viewers are rewatching.
What Is a Good Shorts Retention Rate?
Based on platform data and creator experience:
(1) Target retention: 70-80%+ for strong performance
(2) Viewed vs swiped: 70-80% viewed rate means your hook is working
(3) Shorter Shorts retain higher percentages (it's easier to watch 15 of 20 seconds than 15 of 60)
(4) YouTube now allows Shorts up to 3 minutes, but longer duration makes high percentage retention much harder. A 3-minute Short that only retains viewers for 30 seconds (16%) will get buried, while a 30-second Short with 25 seconds average (83%) will soar.
As Shortimize's guide to the YouTube Shorts algorithm explains: "Retention is king in Shorts. The algorithm heavily prioritizes how much of your video each viewer watches."
For a deeper dive into optimizing your Shorts strategy, check out our guide on how to analyze YouTube Shorts performance.

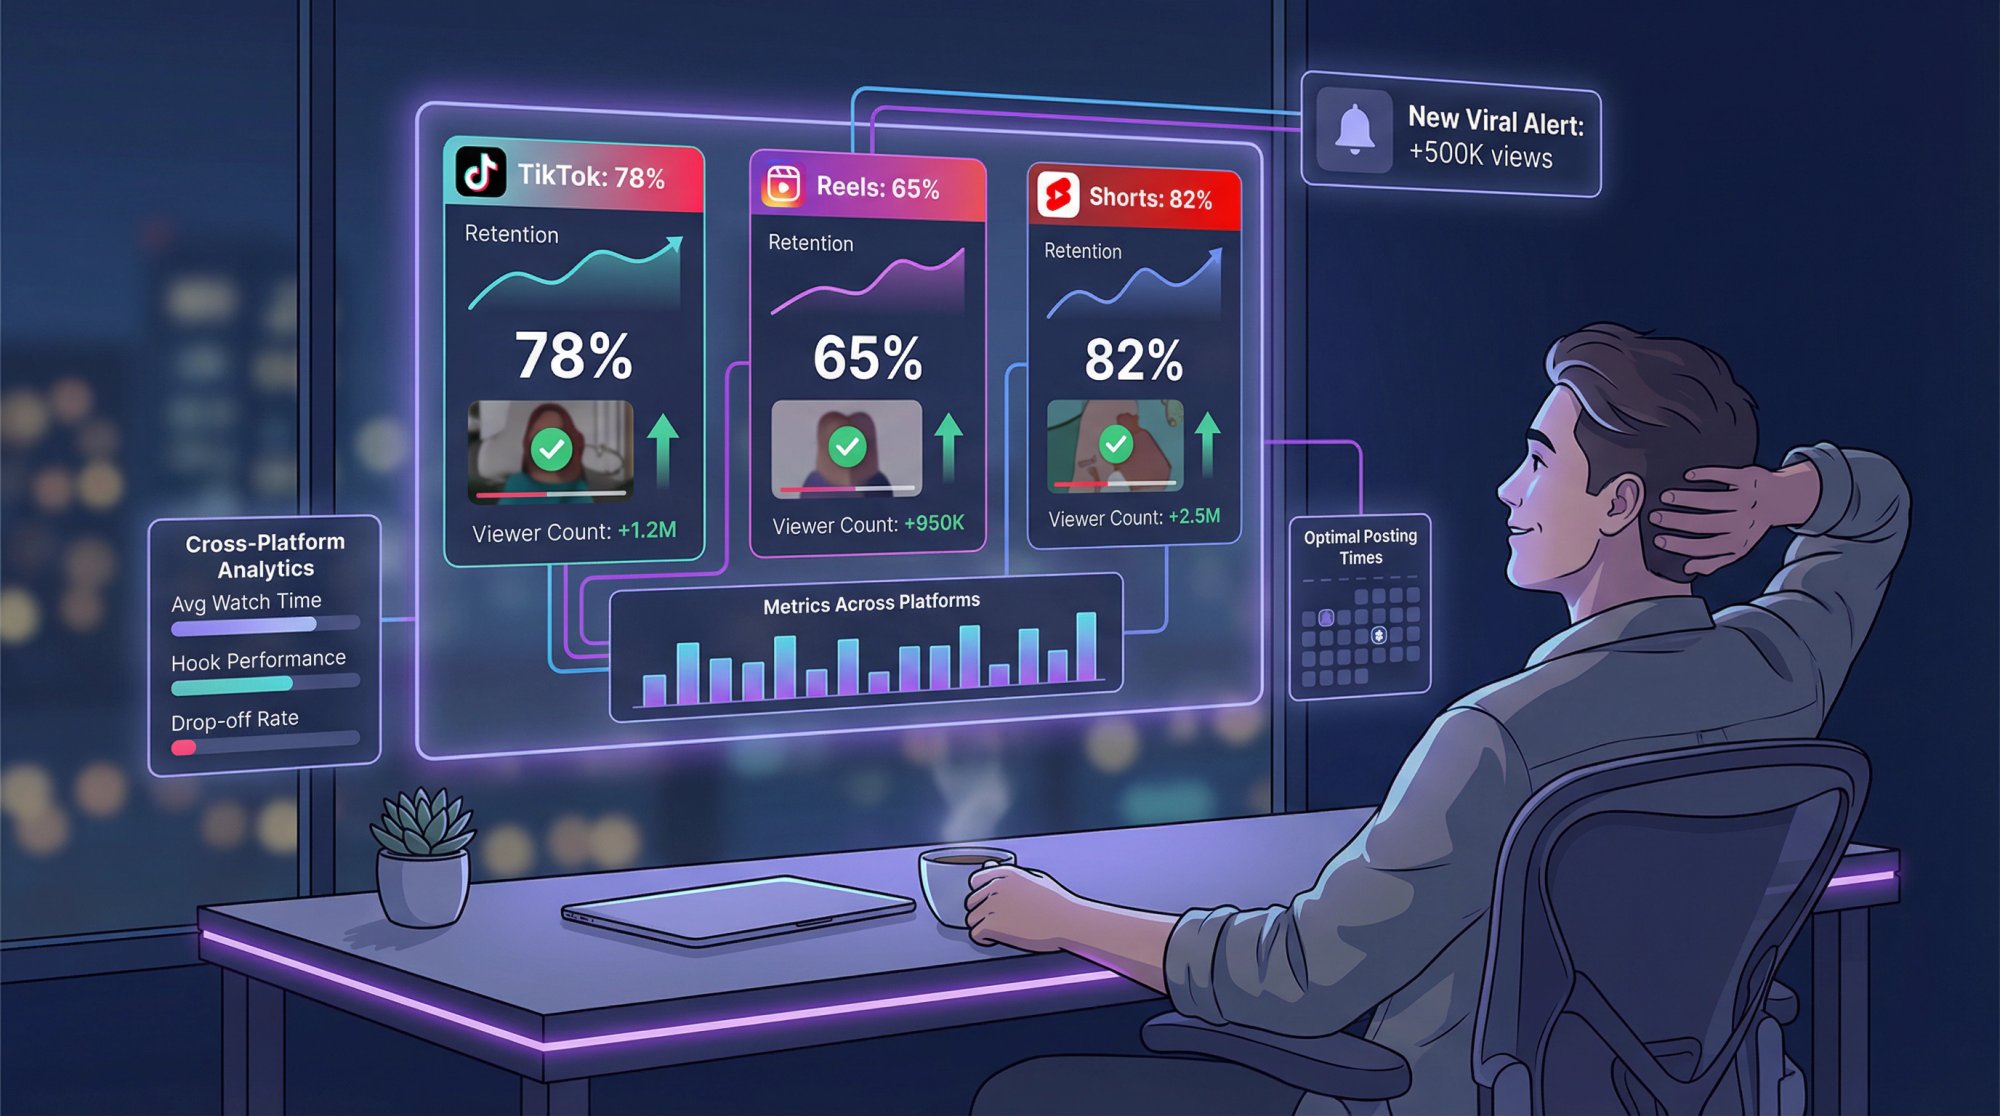
Why Cross-Platform Retention Is Hard to Compare
When you start comparing retention metrics from TikTok vs Reels vs Shorts, several gotchas can trip you up. Understanding these nuances is essential for effective cross-platform analysis:
How Each Platform Counts Views Differently
A view isn't the same thing on each platform. According to official platform documentation:
| Platform | When a "View" Counts | Impact on Metrics |
|---|---|---|
| TikTok | Almost instantly when video starts | Quick exits included in average |
| YouTube Shorts | Every start/scroll (even half-second) | Inflates view counts; use "Engaged Views" |
| Instagram Reels | Traditionally ~3 seconds | Quick exits may not count, higher averages |
This means average watch time calculations can differ significantly. If 100 people see 1 second of your Reel and leave, Instagram might not count those as views (thus not lowering your average). TikTok and YouTube would count them, dragging your average down. Don't be shocked if your TikTok shows 5 seconds average on 10k views while a similar-performing Reel shows 8 seconds on 8k views. Learn more about tracking these nuances with social media engagement tracking.
Why Audience Behavior Varies by Platform
Each platform's feed works differently. TikTok and Shorts aggressively show your content to new viewers and use retention to decide whether to keep distributing. Instagram Reels does this too, but a lot of Reel views come from existing followers in the main feed.
This matters because followers might give you more leeway (they know you), while cold audiences on TikTok/Shorts will scroll at any sign of boredom. You might see higher retention on TikTok simply because only the most relevant audience saw it after initial testing. Or lower retention on Reels if Instagram pushed it to people who don't normally watch your content. For deeper analysis, explore our Instagram analyzer tools.
How Video Length Limits Differ
Platform length limits differ significantly:
| Platform | Maximum Length | Sweet Spot for Retention |
|---|---|---|
| TikTok | Up to 10 minutes | 15-60 seconds typically |
| Instagram Reels | Up to 90 seconds | 15-30 seconds |
| YouTube Shorts | Up to 3 minutes (2025) | 30-60 seconds |
Comparing a 15-second TikTok to a 60-second Reel doesn't make sense without normalizing. Group your content by length categories and compare within those groups. For more insights on platform-specific strategies, see our comparison of YouTube Shorts vs TikTok differences and how to adapt your strategy.
What Retention Data You Can Access
For your own videos, you get detailed retention data. For competitor or influencer videos you're tracking, you only see public metrics like view counts, likes, and comments. In that case, you might use proxies (assuming higher engagement correlates with interesting content), but you won't have their actual retention graphs.
This is where TikTok competitor analysis becomes valuable, helping you understand how competitors perform even without access to their internal metrics.
Why 'Good' Retention Varies by Platform
There's no public cross-platform retention benchmark. Anecdotally, many creators find it harder to hold attention on Reels and easier on TikTok/Shorts, possibly due to algorithmic curation differences or audience behavior. Use your own baseline: if your content style is consistent, notice if one platform consistently yields higher watch percentages. That might indicate better audience fit or better optimization for that platform's format.
For context on what constitutes strong performance, our analysis of what counts as viral on TikTok can provide helpful benchmarks.
How to Compare Retention Across Platforms
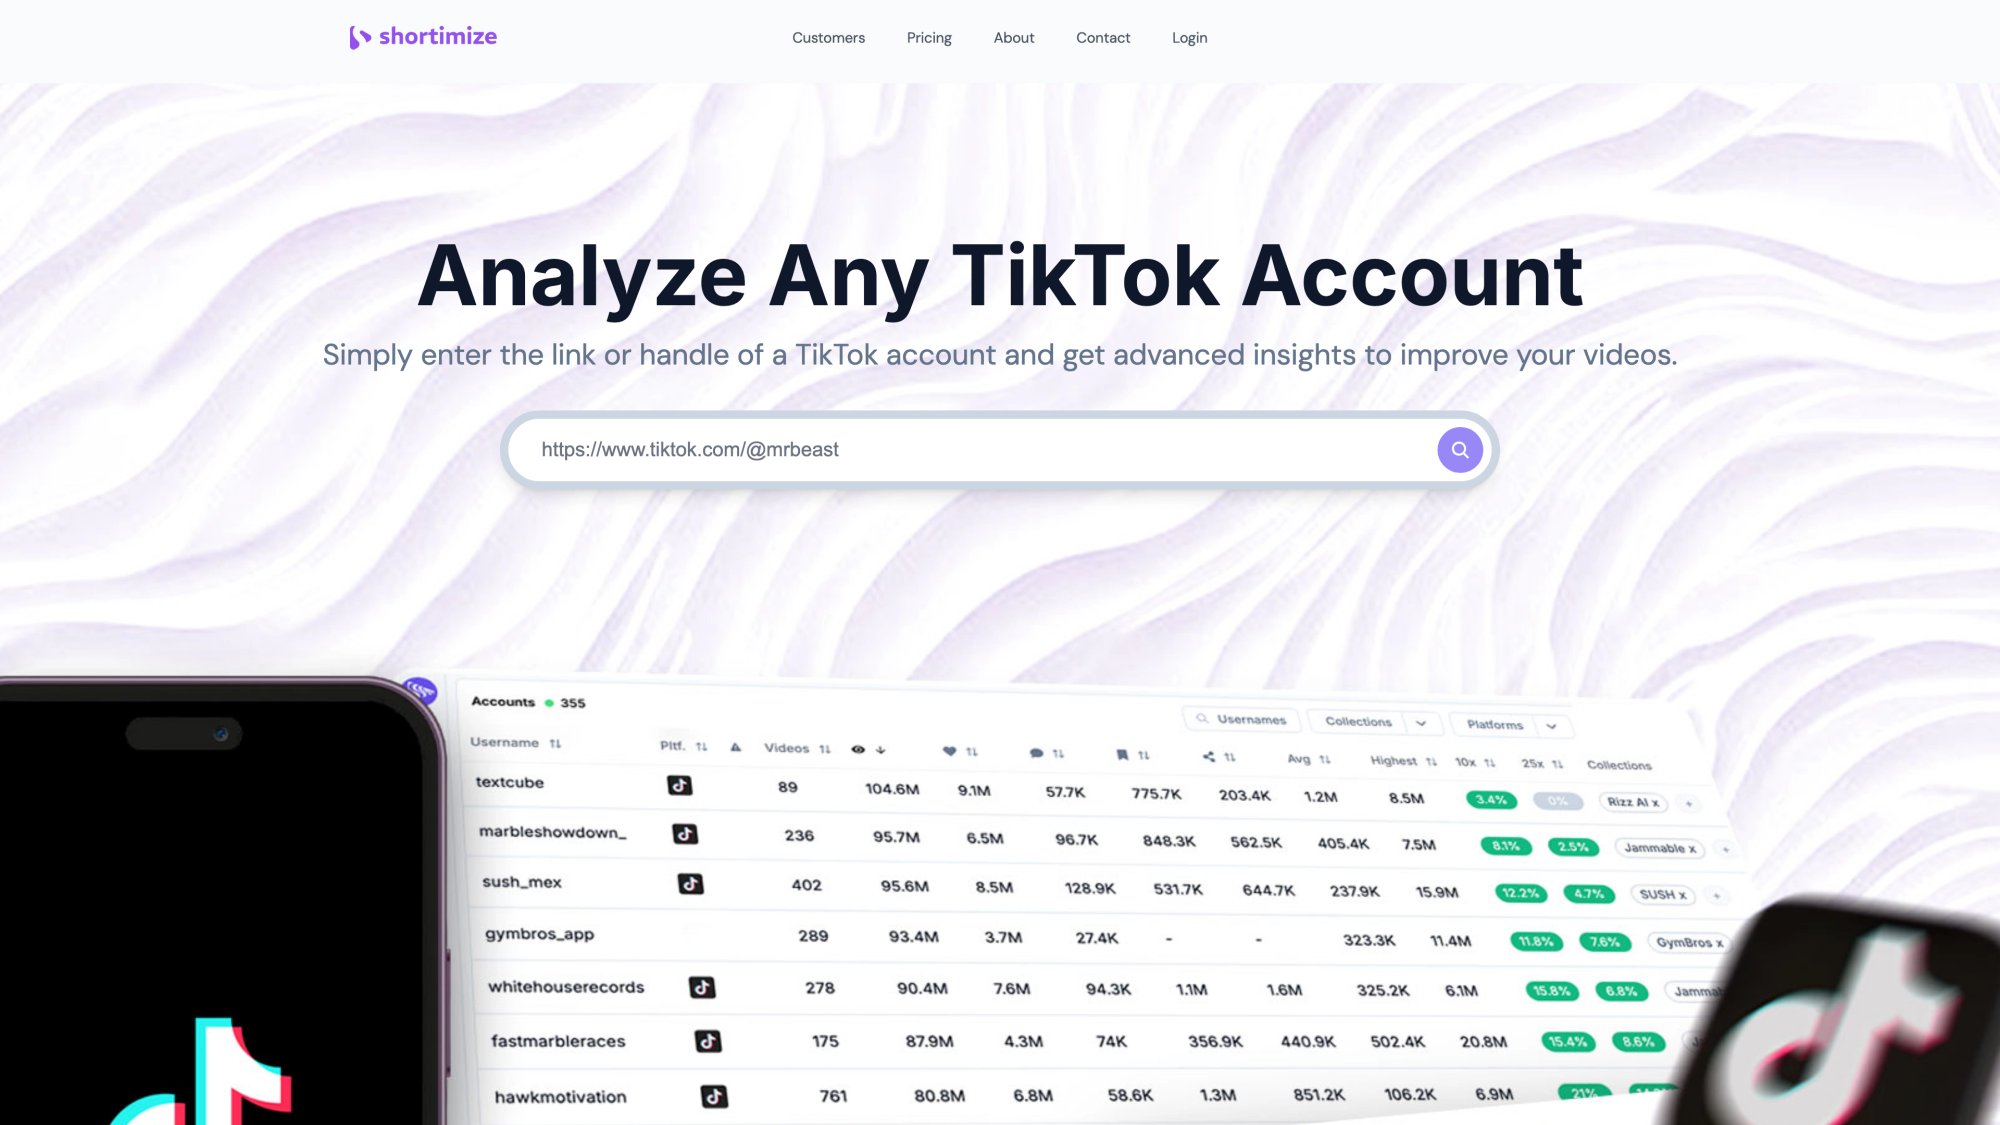
Here's a practical approach to understanding which platform your content actually performs best on. Use Shortimize's analyze features to streamline this process:
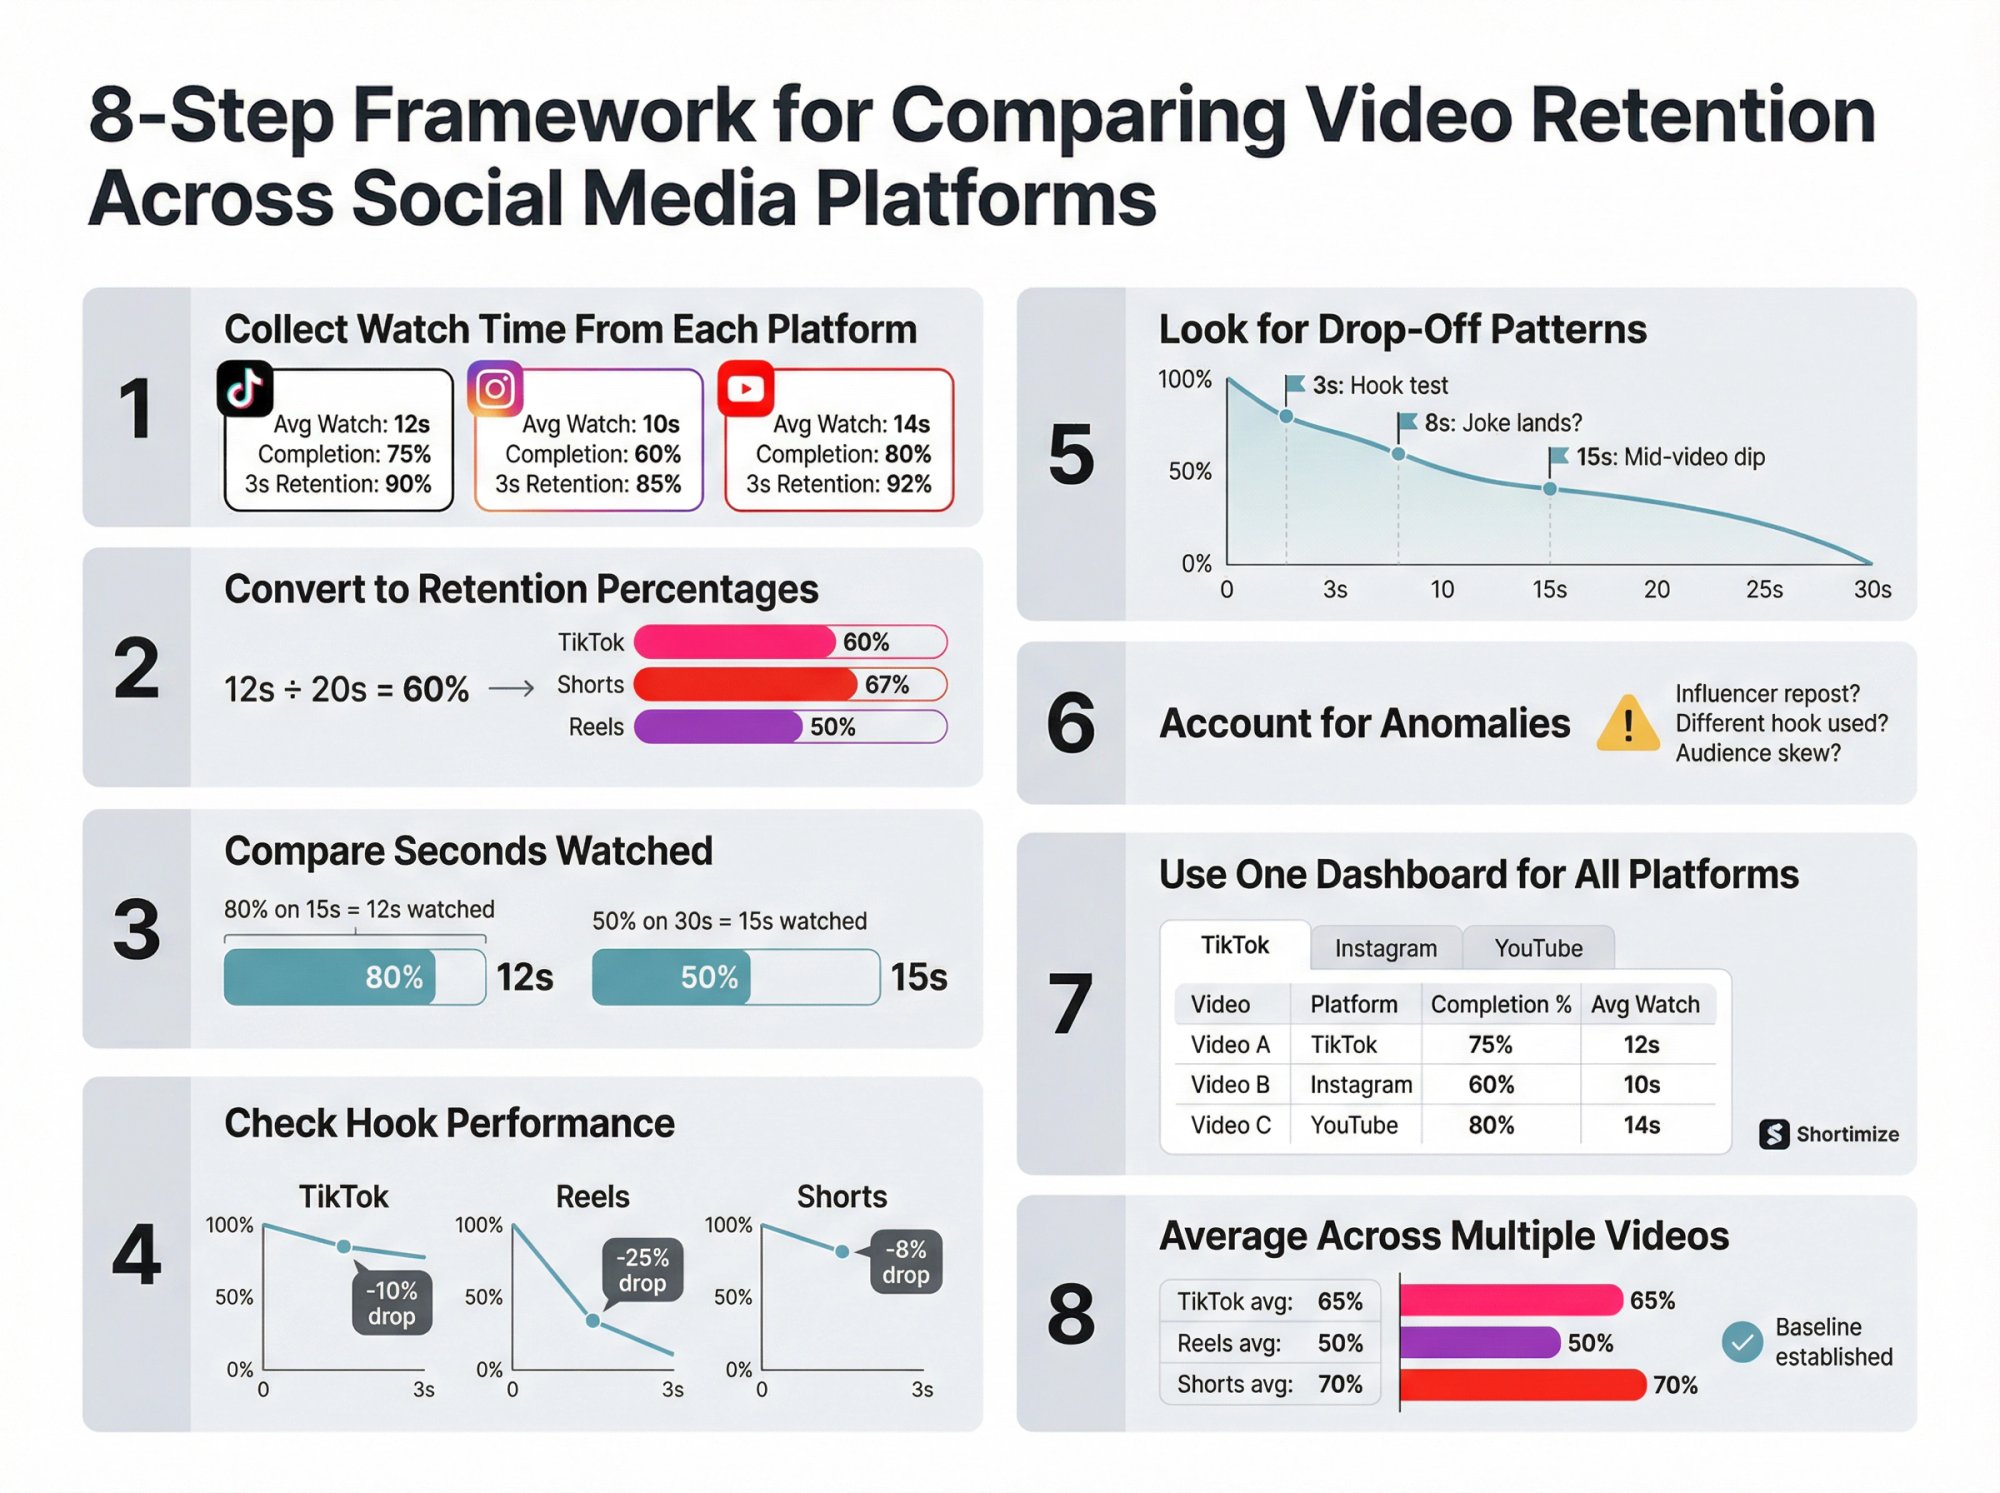
Step 1: Collect Watch Time From Each Platform
For each video (or set of videos) you posted across platforms, collect:
-
Average watch time (seconds)
-
Completion rate / average percent watched
-
First 3-second retention (estimate from TikTok graph, use Instagram skip rate, use YouTube viewed vs swiped)
-
Replays or average views per viewer (if available)
Having these side by side lets you compare directly. "Video X: TikTok 75% completion, Reels 50%, Shorts 80%." Now you know TikTok and Shorts viewers were far more engaged than Instagram viewers for that content.
Step 2: Convert to Retention Percentages
Calculate percentage if not directly given. This levels the playing field:
TikTok Example:
12-second avg watch on 20-second video = 60% retention
Shorts Example:
10-second avg on 15-second video = ~67% retention
Reels Example:
15-second avg on 30-second video = 50% retention
Now you're comparing 60% vs 67% vs 50%. Consistently higher retention percentage on one platform suggests either better audience fit or better optimization for that format.
Step 3: Compare Seconds Watched
Percentage can be deceiving when lengths differ. Suppose YouTube Shorts gave you 80% on a 15-second video (12 seconds watched) while Instagram gave you 50% on a 30-second video (15 seconds watched). Instagram actually delivered more viewing time per user despite the lower percentage.
The algorithms might treat those similarly since both kept someone for 12-15 seconds. Consider both metrics: if one platform has higher percentage but another has higher absolute seconds, the picture is nuanced.
Step 4: Check Hook Performance
Use skip/viewed-vs-swiped metrics to compare hook effectiveness. If your TikToks lose only 10% in the first 2 seconds but your Reels lose 25% in the first 3 seconds, something about how your content appears on Instagram isn't stopping scrollers. Maybe the format, maybe the thumbnail, maybe the algorithm served it to the wrong people.
Comparing hook retention is extremely practical. It tells you exactly where you're losing viewers immediately. Learn how to find the best hooks for viral content through data-driven analysis.
Step 5: Look for Drop-Off Patterns
If you have retention graphs, compare them. Did all three platforms' audiences drop off at the same point? (Maybe your joke at 8 seconds didn't land universally.) Or does one platform's audience drop off sooner? These divergences hint at platform-specific content tuning opportunities.
When you notice unexpected performance dips, our guide on how to diagnose and fix performance drops can help identify root causes.
Step 6: Account for Anomalies

Note anomalies: maybe your Reel got boosted because an influencer reposted it, skewing the audience. Maybe your TikTok had a different hook (creators sometimes tweak videos for each platform). Try to compare cases where content and conditions were similar. Consider how influencer tracking can help you monitor these variables.
Step 7: Use One Dashboard for All Platforms
This is where juggling three separate analytics apps gets painful. You're logging into TikTok Creator Tools, then Instagram Insights, then YouTube Studio, copying numbers into spreadsheets, trying to remember which video is which.
A cross-platform analytics tool like Shortimize lets you track multiple accounts and videos across TikTok, Instagram, and YouTube in one place. Instead of switching between apps, you see all your videos and their performance side by side. The easier it is to view data together, the easier it is to spot patterns like "Hey, my Shorts consistently have higher completion rates than my Reels."
With powerful integrations to tools like Amplitude, Mixpanel, and Posthog, you can sync your video analytics with your broader product data for even deeper insights.
Step 8: Average Across Multiple Videos
Don't fixate on one video. Variance is normal. Look at averages or medians across 10+ cross-posted videos. Maybe TikTok averages 65% completion, Reels 50%, Shorts 70%. That's more meaningful than any single outlier. Calculate a baseline for each platform with a set of similar content. Then you know where you're winning and where you need work. Use influencer tracking tools for batch analysis strategies across platforms.
How to Improve Watch Time on Every Platform
Improving watch time lifts performance on every platform. Here's what actually moves the needle:
How to Hook Viewers in the First 3 Seconds
Every platform's data says the same thing: you have seconds to captivate. A compelling hook might be:
-
Starting with the most exciting shot or boldest statement (no slow intros or logos)
-
Using captions or a title card to create curiosity ("Watch what happens when…")
-
Jumping straight into a surprising line or the core problem/solution (skip "Hey guys, today I'm going to…")
The mute test: Many viewers watch without sound initially. If the visual alone in the first 2 seconds wouldn't catch someone's eye, rethink it. Strong facial expressions, big text on screen, or an unusual scene can stop scrollers even silent.
If you're new to short-form video, our TikTok beginner guide covers hook strategies in depth.
How to Keep the Energy High
Retention graphs often dip during lulls. Edit ruthlessly. Cut dead air, long pauses, any segment that doesn't deliver value or entertainment. This doesn't mean every video must be frantic, but every second should earn its place.
Use pattern interrupts in longer videos: change camera angle, add a caption, switch to B-roll at strategic moments to reset attention. Learn more about posting frequency on TikTok to maintain consistent quality.
How to Keep Viewers Until the End
Viewers drop off when content fails to meet the expectations set by the hook. Make sure your video actually delivers on its promise, and ideally deliver minor payoffs along the way. In a 30-second video with 5 tips, don't spend 20 seconds on tip #1 and rush through the rest. Spread out the "aha" moments.
Understanding what constitutes a good engagement rate on TikTok helps you gauge whether your content is resonating with viewers.
What Video Length Works Best for Retention
There's no universal best length. Generally:
-
If you can convey something in 15 seconds instead of 30 without losing impact, do it. Shorter videos naturally have less time to drop viewers.
-
Longer can work if it's genuinely engaging and gives more total watch time. Experiment systematically.
If all your 15-second videos have 80% retention and your 45-second videos drop to 40%, that's data. On the other hand, if those 45-second videos still get 20 seconds average watch versus 12 seconds on shorter ones, that's more watch time per viewer. Decide what success means for you.
How to Make Videos That Replay

Structure videos to loop seamlessly: the ending connects back to the beginning, encouraging viewers to watch again. A twist ending that makes people go "wait, what?" and rewatch for clues can push average watch time above 100%. Just make sure the loop makes sense on first watch. Discover more about analyzing TikTok account archives to find loopable content.
How to Track and Improve Over Time
After changes, check each platform's retention again. You may need to tailor differently. Maybe subtitles and text animations significantly improve your Reels retention because IG viewers often watch muted. Maybe your ultra-fast cuts work on TikTok but feel chaotic on Instagram. Test small tweaks and watch how retention curves respond.
For ongoing optimization, consider setting up automated alerts for your social media monitoring to get notified when performance changes significantly.
How to Use TikTok, Reels, and Shorts Analytics
Each platform provides unique insights:
TikTok: Study the audience retention chart. Where's the steepest drop? Did many rewatch? Learn how to increase TikTok video views by addressing retention issues.
Instagram: Study the retention chart and skip rate. High skip rate? Improve the opening. Flatline at 50% halfway? Second half loses people. See our deep dive on analyzing Instagram Reels account engagement.
YouTube: Use relative retention (compares your Short to others of similar length). "Above typical" for first 10 seconds but "below typical" after? The intro is fine but something mid-video causes drop-off. Our guide on converting Shorts into subscribers explores these patterns further.
What to Do With Your Retention Data
Mastering cross-platform watch time comparison gives you a real advantage. You stop guessing which platform "works" and start seeing where your content actually resonates.
To recap:
-
Use completion rate (%) and average watch time to compare retention across platforms
-
Be mindful of platform differences in view counting and algorithm weighting
-
Use each platform's retention graphs and skip rates to understand why viewers behave differently
-
Continuously optimize hooks, pacing, and structure to raise retention everywhere
-
Consider tools that centralize analytics rather than juggling three separate dashboards
At Shortimize, we built our platform specifically for this problem: tracking short-form video performance across TikTok, Instagram, and YouTube in one place. With standardized cross-platform metrics in a single dashboard, you can spot trends and outliers faster, compare videos side by side, and stop wasting time copying numbers between apps.
See how teams like Amo, Airbuds, and Reclip use Shortimize to streamline their cross-platform analytics workflow.
High retention is the clearest signal that your content is working. When you can reliably hold attention across platforms, you'll see the payoff in algorithmic reach, follower growth, and overall impact. Use the framework and tactics here to refine your content strategy.
Now go turn those seconds watched into lasting success.