YouTube Shorts have exploded. We're talking tens of billions of views every single day. Over 2 billion monthly users are now tuning into these bite-sized videos, and if you're creating Shorts without analyzing their performance, you're throwing darts blindfolded.
The platform now sees 200 billion daily views on Shorts alone. In that kind of volume, understanding what works isn't optional anymore. It's the difference between getting lost in the noise and actually building an audience that sticks around.
This guide walks you through everything you need to know about analyzing YouTube Shorts performance. Not just which numbers to look at, but what they actually mean and how to use them to create better content.
Why YouTube Shorts Analytics Are Different From Regular Videos
Shorts aren't just vertical versions of regular YouTube videos. They play by completely different rules, and if you're treating them the same way, you're missing the point.
Traditional YouTube success depends heavily on thumbnails and titles. People browse, click what looks interesting, and the algorithm rewards good click-through rates. Shorts? They autoplay in a feed. Your thumbnail barely matters because viewers aren't choosing. They're swiping.
This creates a fundamentally different dynamic. Your first two seconds are your thumbnail. If you don't hook someone immediately, they're gone. Research shows that YouTube doesn't even track CTR for Shorts in the feed because there's nothing to click. The content has to sell itself instantly.
The metrics that matter shift accordingly. With long-form content, you might obsess over average view duration in minutes. With Shorts, you're looking at retention in seconds. A 15-second video where people watch 12 seconds is crushing it. A 60-second Short where people bail at 20 seconds needs work.
One of the most telling Shorts-specific metrics is the "viewed vs. swiped away" ratio. This shows you exactly how many people chose to watch your Short versus scrolling past it. If 1,000 people saw your video in their feed and only 300 watched it, you've got a 30% view-through rate. That's your hook failing.
YouTube also changed how it counts views for Shorts as of March 2025. Now any time a Short starts playing, even if it loops, that's a view. No minimum watch time required. This means raw view counts can be inflated by passive loops, which is why you need to look deeper at engaged views (people who actually watched or interacted).
The algorithm cares about retention above almost everything else. If viewers consistently watch your entire Short, YouTube interprets that as quality content and pushes it harder. Retention is arguably the single most important metric for Shorts success.

How to Access YouTube Shorts Analytics Dashboard
Getting to your analytics is straightforward, whether you're on desktop or mobile.
On desktop, log into YouTube Studio and click "Content" in the left sidebar. At the top, filter by "Shorts" to see only your short-form videos. Find the Short you want to analyze and click the analytics icon (the little graph symbol) next to it. This opens a detailed breakdown for that specific video.
You can also click "Analytics" in the sidebar and switch to the Shorts section at the top. This gives you aggregate performance across all your Shorts, which is useful for spotting broader patterns.
For deeper analysis, use Advanced Mode. You can slice data by timeframe, geography, or compare multiple videos side by side. This is where you start finding the patterns that actually matter.
On mobile, open the YouTube Studio app, tap Analytics at the bottom, and swipe to the Shorts view. You'll get similar metrics to desktop, including views, likes, and the crucial retention graph.
The interface updates frequently, so make sure your app is current. YouTube keeps adding new Shorts-specific analytics cards based on what creators actually need.
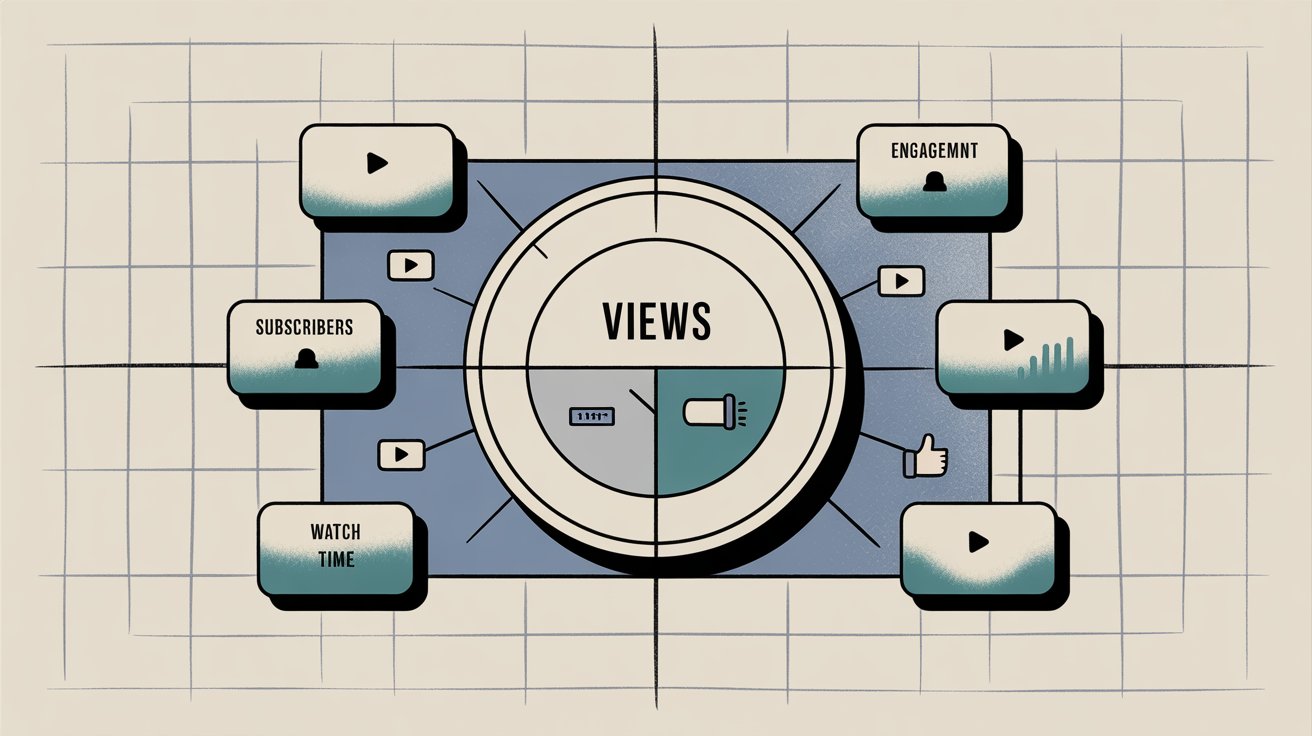
Which YouTube Shorts Metrics Actually Matter
Not all numbers deserve your attention. Some metrics are vanity stats that feel good but don't drive decisions. Others tell you exactly what you need to fix.
How to Measure YouTube Shorts Reach and Hook Performance
Impressions show how many times YouTube surfaced your Short in feeds. High impressions mean the algorithm is distributing your content, but if views are much lower, people are scrolling past. Your impression count divided by views gives you a rough "stop rate" (how often you make people stop scrolling).
Views are straightforward, but remember they include replays and loops now. Compare total views to engaged views (if YouTube provides that data) to see how many people actually watched versus how many were passive loops or immediate bounces.
The "viewed vs. swiped away" percentage is critical. Top creators aim for roughly 75-80% view rate, meaning 7-8 out of 10 people shown the video actually watch it. Hitting this level signals to the algorithm that your hook works, which leads to broader distribution.
If your viewed-vs-swiped percentage is consistently low (say, 40-50%), your opening needs serious work. Test different hooks, stronger opening visuals, or more compelling first lines.
Traffic sources show where views come from. For Shorts, the feed dominates. If you're seeing significant traffic from "External," people are sharing your content off-platform (a strong signal). If "Channel pages" is high, viewers are browsing your profile and choosing Shorts to watch, which suggests your back catalog is valuable.
What Are the Key Engagement Metrics for YouTube Shorts
Likes are the simplest approval metric. A strong like count relative to views (the like rate) shows content that resonated. If most of your Shorts get a 5% like-to-view ratio but one hits 10%, that video struck a chord. Average engagement rate for Shorts hovers around 5-6%, though some data suggests it's climbing toward 9-11% in 2025.
Comments on Shorts are rarer than likes because people don't always bother typing on fast-scrolling content. When comments do spike, your video sparked curiosity or strong reactions. Read what people are saying. If many ask the same question, you've found a topic for a follow-up Short.
Shares indicate content valuable or entertaining enough that viewers wanted to show others. Research shows that high share counts often predict viral potential. When a Short gets unusually high shares, dissect it. What made people pass it on? Was it humor, shock value, practical tips, or something else?
Why Retention Is the Most Important YouTube Shorts Metric
Average View Duration (AVD) tells you how long, on average, viewers watched. More useful is Average Percentage Viewed, which accounts for video length. Aim for 80% or higher average percent viewed. If you've got a 30-second Short with 15 seconds average view duration (50%), many people are bailing early. A 20-second Short with 16 seconds AVD (80%) is performing well.
The Audience Retention Graph is where the real insights live. This second-by-second curve shows exactly where viewers drop off. Did 30% leave at the 3-second mark? Your hook failed. A sudden dip at 15 seconds? Something boring or confusing happened there.
Because retention is everything for Shorts, study this graph for every video. Videos with flat retention curves (almost everyone watches to the end) represent formats worth replicating. Videos losing half the audience halfway through need dissection to figure out what went wrong.
High retention creates a ripple effect. Those engaged viewers contribute more likes, shares, and watch time, which boosts the video's performance. The algorithm sees this and pushes harder.
How to Track Subscriber Growth From YouTube Shorts
Subscribers Gained shows whether your Short converted viewers into followers. A viral Short might get millions of views but zero subscribers if it was just mildly entertaining and off-brand. A highly relevant Short can bring hundreds or thousands of subscribers because viewers want more of exactly that.
Track which Shorts led to subscriber bumps. Those reveal the content topics or styles attracting your actual target audience, not just casual scrollers. If certain Shorts get high views but no subscriber growth, ask why. Were they off-topic? Did you forget a call-to-action?
The Top Shorts report in YouTube Studio lists your best performers, usually sorted by views. Look for patterns across your top 3-5 videos. Do they share a format, editing style, or subject matter? Those commonalities are your content sweet spot.
Be careful about drawing conclusions from a single viral outlier. Instead, compare multiple top performers to spot recurring elements of success.
What Are Good YouTube Shorts Performance Benchmarks
Knowing the metrics is one thing. Understanding what constitutes "good" performance is another.
|
Performance Metric |
Good Target |
What It Means |
|---|---|---|
|
Average % Viewed |
70-90% |
Viral-level retention; your content holds attention |
|
Engagement Rate |
5-10% |
Solid audience connection (some niches see 9-11%) |
|
View-Through Rate |
75-80% |
Your hook stops scrollers effectively |
|
30-Second Retention |
Majority watching |
Algorithm still values this threshold heavily |
Videos with over 1 million views average about 76% retention of their length. That's your benchmark for truly high-performing content.
For longer Shorts (45-60 seconds), pay attention to the 30-second mark. While YouTube no longer requires 30 seconds for a view, the algorithm still heavily values getting viewers to at least that point. A good target is having the majority of viewers still watching at 30 seconds.
Industry averages hover around 5-6%, though some recent data suggests 9-11% is increasingly common. If you're consistently below 3%, viewers aren't connecting emotionally with your content.
Steady subscriber growth from Shorts indicates you're attracting the right audience, not just eyeballs. If 50 Shorts brought virtually no subscribers, you're entertaining casually but not compelling people to follow. Consider tailoring content more specifically to your niche, even if it means fewer total views.
How to Use YouTube Shorts Analytics to Improve Performance
Data only matters if you use it. Here's how to actually improve based on what you're seeing.
How to Replicate Your Best Performing YouTube Shorts
Look at your top-performing Shorts and identify common elements. Did they all start with a question? Were they under 20 seconds? Featured a specific format?
Once you spot a winning formula, replicate it with fresh angles. If your top 3 Shorts are quick how-to tips with strong hooks, plan more content in that style. Success leaves clues. Use them.
How to Improve YouTube Shorts Retention in First 3 Seconds
For any Short with a big early drop in the retention graph, revisit the first 1-3 seconds. Was the opening frame visually interesting? Did the first line create curiosity?
Top creators often start with action or a bold statement, something that intrigues without requiring context. Make sure viewers immediately understand what value or story they're getting. No lengthy intros or setup. Get to the point.
If retention consistently improves in the first few seconds across new videos, you're honing your hook craft.

What Is the Optimal Length for YouTube Shorts
Check performance across different durations. Your 15-second, 30-second, and 60-second Shorts might perform very differently.
Many creators find that 20-30 second Shorts hit a sweet spot (enough time to convey value, but short enough to hold attention). That said, your audience might prefer longer or shorter. Let the data decide.
How to A/B Test YouTube Shorts Content
If you're unsure which approach works better, run controlled tests. Post two Shorts on the same topic but change one variable. Maybe version A has a text hook while version B has you speaking the hook. Compare the view-through rate and retention.
Key metrics to compare in A/B tests are view-through rate, average view duration, and engagement rate. Over time, these experiments sharpen your intuition for what resonates.
When Is the Best Time to Post YouTube Shorts
Your analytics reveal when your audience is most active. In YouTube's Audience tab, you can see charts of when your viewers are on the platform. Use this data to schedule Shorts at peak times for maximum initial exposure.
Consistency matters too. Channels posting 3-5 Shorts per week tend to see better momentum. If analytics show spikes during daily posting and lulls during quiet periods, that's your signal to maintain a steady cadence.
Channels that post Shorts consistently for months see significant growth, often a 44% increase in overall channel growth after 6 months.
How to Analyze Competitor YouTube Shorts Performance
Occasionally analyze other channels' Shorts in your niche. What's their average view count? Like ratios? Comment engagement?
If competitors consistently get 50% more views on similar topics, examine their content:
→ Are their hooks flashier?
→ Do they use trending sounds?
→ Is production quality higher?
→ Check their posting frequency and use of features like captions.
You can manually browse their Shorts tab (sort by most popular) or use tools like Shortimize to track competitor accounts over time. Benchmarking helps you set realistic targets and spot proven tactics to adapt.
Just remember: don't copy, adapt. Learn what's working in your ecosystem and do it with your unique angle.
Best YouTube Shorts Analytics Tools for Tracking at Scale
YouTube's native analytics are solid for individual channel insights, but if you're managing content at scale, tracking competitors, or working across platforms, you'll want additional tools.
Why Use Third-Party YouTube Shorts Analytics Tools
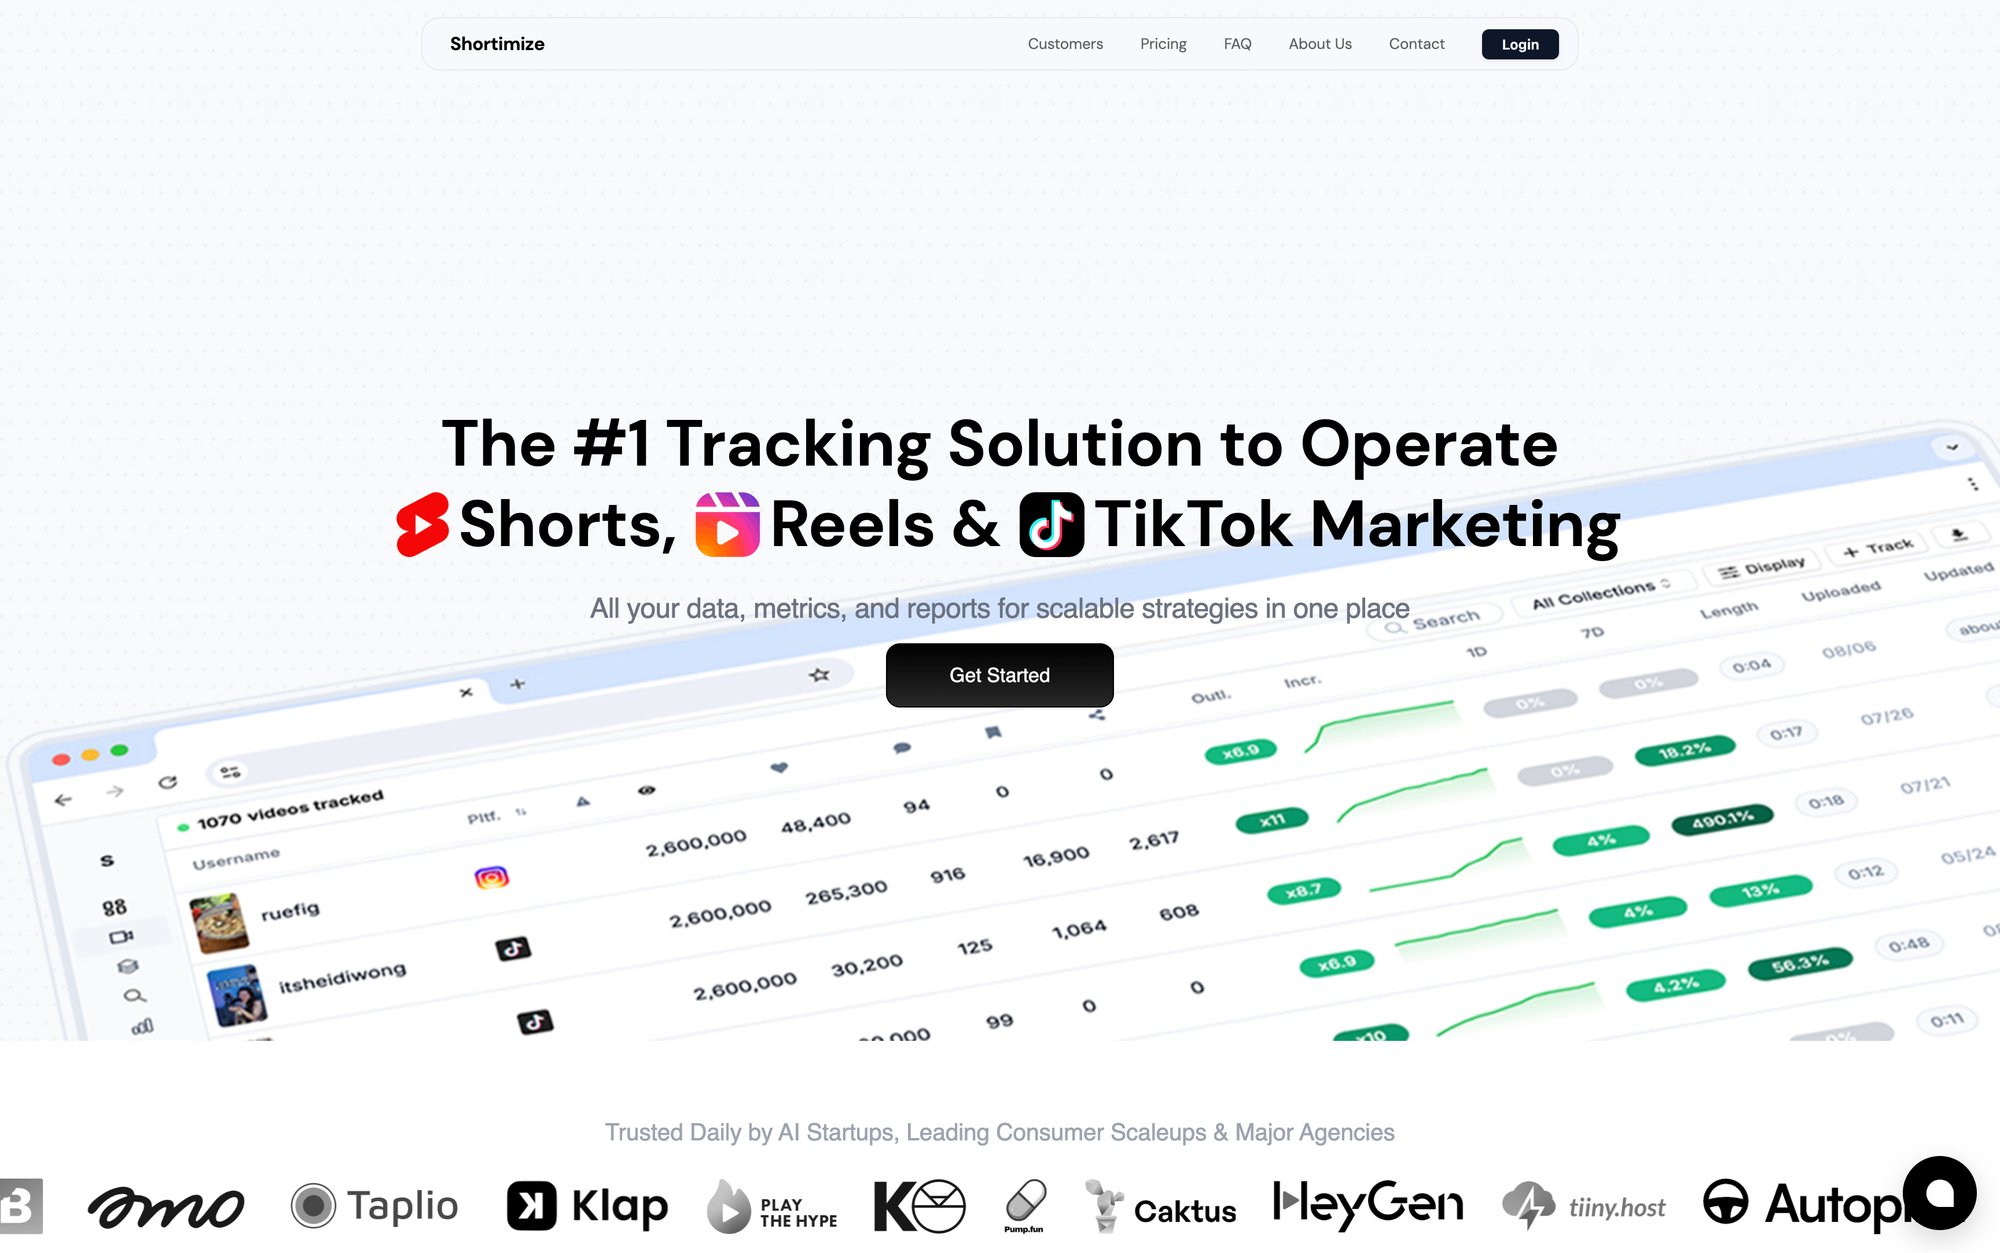
If you're posting on TikTok or Instagram Reels alongside YouTube Shorts, tracking everything in separate apps is inefficient. Shortimize lets you monitor all your short-form videos in one dashboard, making it easy to compare performance across platforms. Did a concept crush it on TikTok but flop on Shorts? That insight helps you tailor content differently for each platform.
Tools like Shortimize ingest public data for Shorts, Reels, and TikTok, so you can track multiple accounts side by side, including competitors or influencers.
How to Analyze YouTube Shorts Performance Over Time
YouTube Studio shows your data, but third-party tools make it easier to spot trends over time or analyze many videos at once. Shortimize can pull every video from a YouTube Shorts account and give you aggregate stats with exportable tables.
You can quickly see things like "average views per Short this month vs last month" or identify outliers without manually clicking through dozens of videos. If you manage a large library of Shorts, this saves hours.
How to Benchmark YouTube Shorts Against Competitors
Some platforms incorporate industry benchmarking. Shortimize lets you compare your performance against competitors or industry averages, giving context for whether you're above or below par. If the average Shorts in your niche get 5,000 views and yours consistently get 8,000, you know what you're doing is working.
Can AI Help Analyze YouTube Shorts Performance
Beyond raw metrics, some tools offer AI-driven analysis. Shortimize can identify which hook styles or content pillars work best for you, tagging videos by format or topic to show which correlate with higher engagement. It might flag that your Tuesday 5pm Shorts perform 20% better, or send alerts on Slack when a video starts going viral.
How to Track Multiple YouTube Shorts Accounts
If you're an agency or managing multiple channels, external platforms are essential. They let you see all clients' Shorts performance in one dashboard. Shortimize supports organizing accounts into collections and sharing live reports with team members or clients.
How to Monitor Competitor YouTube Shorts Strategy
These tools can track competitors' Shorts, revealing view counts over time, trending videos, and posting frequency. If a competing brand's Shorts spiked last week, you can investigate. Maybe they tapped into a trending challenge. That's actionable intel YouTube Studio won't give you.
Shortimize even offers a free YouTube account analyzer if you want to check out a competitor or influencer's high-level stats without committing to a paid plan.
If Shorts are central to your strategy, augmenting YouTube's analytics with a dedicated tool like Shortimize gives you a single source of truth across platforms and deeper insights that native interfaces don't offer.
5 YouTube Shorts Analytics Mistakes to Avoid
Even with good analytics, it's easy to misinterpret data or focus on the wrong things.
Why High Views Don't Always Mean Good YouTube Shorts Performance
High view counts feel good, but they're meaningless if viewers bounce after 3 seconds. A video with 100,000 views and 40% retention performed worse than one with 10,000 views and 85% retention, at least in terms of signaling quality to the algorithm.
Focus on engaged views and retention first. Views will follow when the quality is there.
What Does the YouTube Shorts Retention Graph Tell You
Some creators glance at average view duration and move on. That's a mistake. The retention graph tells you exactly where you lost people. Without studying it, you're guessing about how to improve.
If you see a sharp drop at 8 seconds, go back to that moment in the video. What happened there? Was it a boring transition? An unclear point? Fix that specific issue in future Shorts.
How to Properly Compare YouTube Shorts Performance
Comparing a comedy skit to a tutorial doesn't make sense. They serve different purposes and appeal to different viewer behaviors. Group your Shorts by category (educational, entertainment, behind-the-scenes) and compare within those groups.
This helps you understand what works for each content type without mixing signals.
Does Posting Frequency Affect YouTube Shorts Performance
The algorithm rewards consistency. If you post daily for two weeks, go silent for a month, then drop three Shorts in one day, your performance will be erratic.
Pick a sustainable schedule (even if it's just three times a week) and stick to it. Consistent posting builds momentum that irregular uploads can't match.
Why You Should Test Different YouTube Shorts Formats
Assuming you know what works without testing is a recipe for stagnation. Your audience's preferences evolve. Trends shift. What worked six months ago might not work now.
Regularly test new hooks, formats, lengths, and topics. Use the data to validate or disprove your assumptions.
Putting It All Together
Analyzing YouTube Shorts performance isn't about obsessing over numbers. It's about understanding what your audience responds to and using that knowledge to create better content consistently.
Start with the metrics that matter:
① View-through rate (how many people your hook stops)
② Retention percentage (how much of your video people watch)
③ Engagement signals (likes, comments, shares that show connection)
Dig into the retention graph for every video to find specific moments where you won or lost viewers. Compare top performers to find patterns worth repeating. Test variations to refine your approach. Post consistently and track progress over time.
Use tools like Shortimize to streamline the process, especially if you're managing multiple accounts or tracking competitors. The goal is to turn analytics from a chore into a strategic advantage.
Not every Short will be a hit, and that's fine. The beauty of short-form content is you can experiment quickly and learn fast. Treat each video as a data point. Over time, you'll build a dataset that tells a clear story about what works for your specific audience.
Success on Shorts in 2025 isn't about luck or going viral once. It's about building a repeatable system where you consistently create content that hooks viewers, holds their attention, and converts them into subscribers. Analytics give you the roadmap. Your job is to follow it.
Frequently Asked Questions
What's the most important metric for YouTube Shorts?
Audience retention, specifically the percentage of your video that viewers watch on average. The algorithm heavily favors videos that keep viewers watching. Aim for 80% or higher average percent viewed. High retention signals quality content, which leads to broader distribution.
How can I improve my Shorts view-through rate?
Focus on your first 1-3 seconds. Top creators aim for a 75-80% view-through rate by starting with action, bold statements, or immediate value. Don't waste time with intros or setup. Your opening frame and first line need to create instant curiosity or promise clear value.
Why did my Short get views but no subscribers?
The content probably appealed broadly but wasn't specific enough to your niche. Viral Shorts often entertain casually without compelling viewers to follow for more. To convert viewers into subscribers, create content that clearly represents your channel's focus and includes subtle calls-to-action ("for more tips like this, subscribe").
How often should I post YouTube Shorts?
Channels posting 3-5 Shorts per week tend to see the best results. Consistency matters more than frequency. Pick a schedule you can maintain long-term. Posting daily for a week then going silent for a month will hurt your momentum more than posting three times a week consistently.
What's a good engagement rate for YouTube Shorts?
Average engagement rate for Shorts ranges from 5-11%, depending on your niche. Calculate this by adding likes, comments, and shares, then dividing by total views. If you're consistently below 3%, your content isn't resonating emotionally. Above 10% suggests you're creating highly engaging content that sparks reactions.
How long should my YouTube Shorts be?
Research suggests that videos under 25 seconds account for a large portion of consumption, but optimal length depends on your content and audience. Check your analytics to see which durations get the highest retention rates. Many creators find 20-30 seconds hits a sweet spot, but some audiences will watch full 60-second Shorts if the content justifies it.
Can I track competitors' Shorts performance?
Yes. Tools like Shortimize let you track any public YouTube account's Shorts, including view counts over time, top-performing videos, and posting frequency. This competitive intelligence helps you benchmark your performance and spot successful tactics to adapt.
What does "viewed vs. swiped away" mean?
This metric shows the percentage of times viewers chose to watch your Short versus scrolling past it in the feed. For example, if 1,000 people saw your video and 700 watched it, that's a 70% view rate. This is crucial because it measures your hook's effectiveness at stopping scrollers.
How do I access Shorts-specific analytics in YouTube Studio?
Go to YouTube Studio, click "Content" in the sidebar, and filter by "Shorts" at the top. Click the analytics icon next to any Short for detailed metrics. You can also click "Analytics" in the sidebar and switch to the Shorts tab for aggregate performance across all your Shorts.
Why is my Short getting impressions but no views?
People are seeing your Short in their feed but scrolling past immediately. This indicates a weak hook or unappealing opening frame. Review the first 1-3 seconds of your video. Does it create instant curiosity? Is the opening frame visually interesting? Test different hooks and monitor how the viewed vs. swiped rate changes.
Ready to take your Shorts analysis to the next level? Try Shortimize's free YouTube account analyzer to get instant insights on any channel, or start your free trial to track all your short-form content across YouTube, TikTok, and Instagram in one powerful dashboard.
