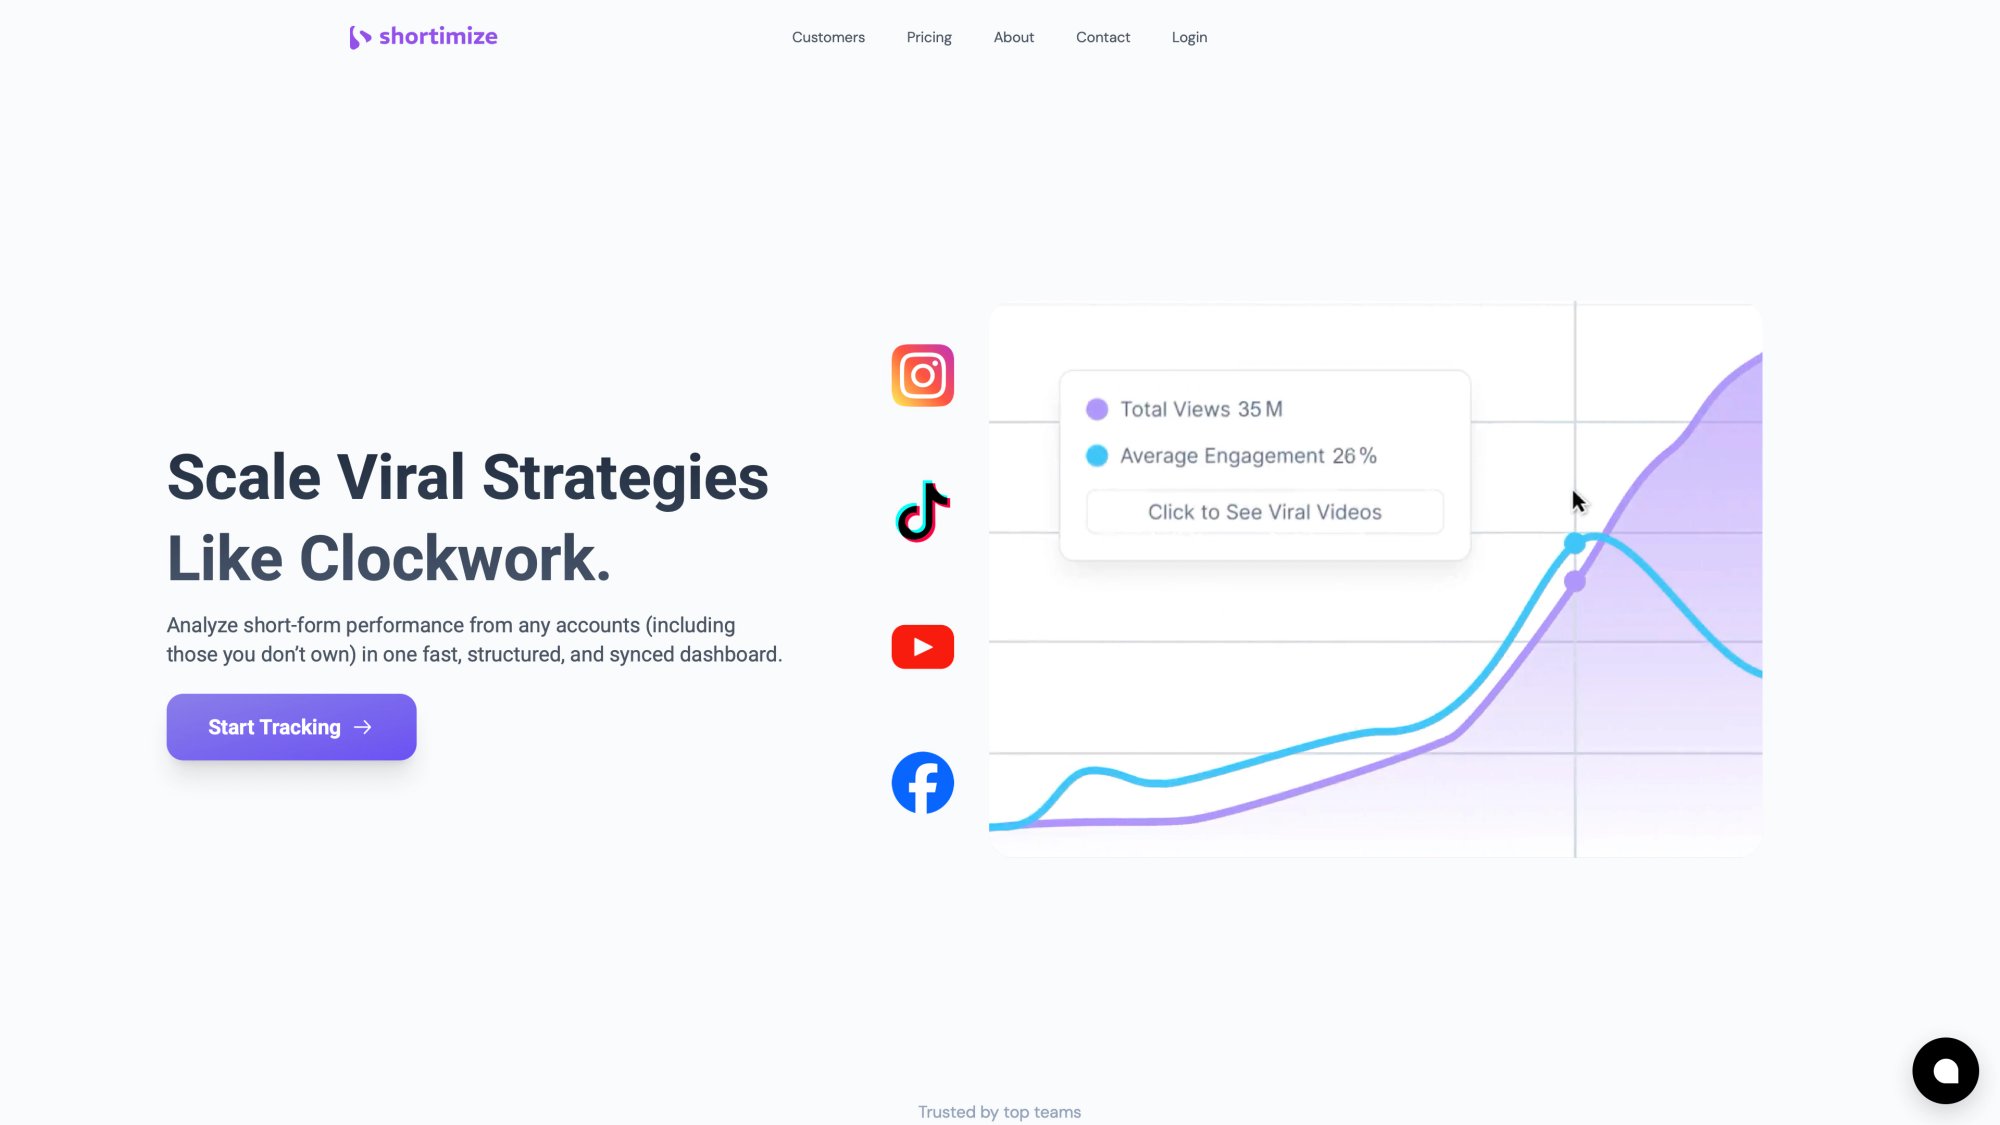
Your latest Reel just hit 10,000 views. Is that good?
Without knowing how your competitors are performing, you're operating blind. Maybe you're crushing it. Maybe you're actually falling behind while thinking you're doing fine.
The only way to know is through competitive benchmarking, and most creators get it completely wrong.
This isn't about obsessing over competitor numbers every day. It's about building a system that shows you exactly where you stand, what's working in your niche, and which gaps you need to close. We'll walk through how to benchmark your Instagram Reels against competitors using methods that actually work in 2026.
Why Is Benchmarking Your Reels Important?
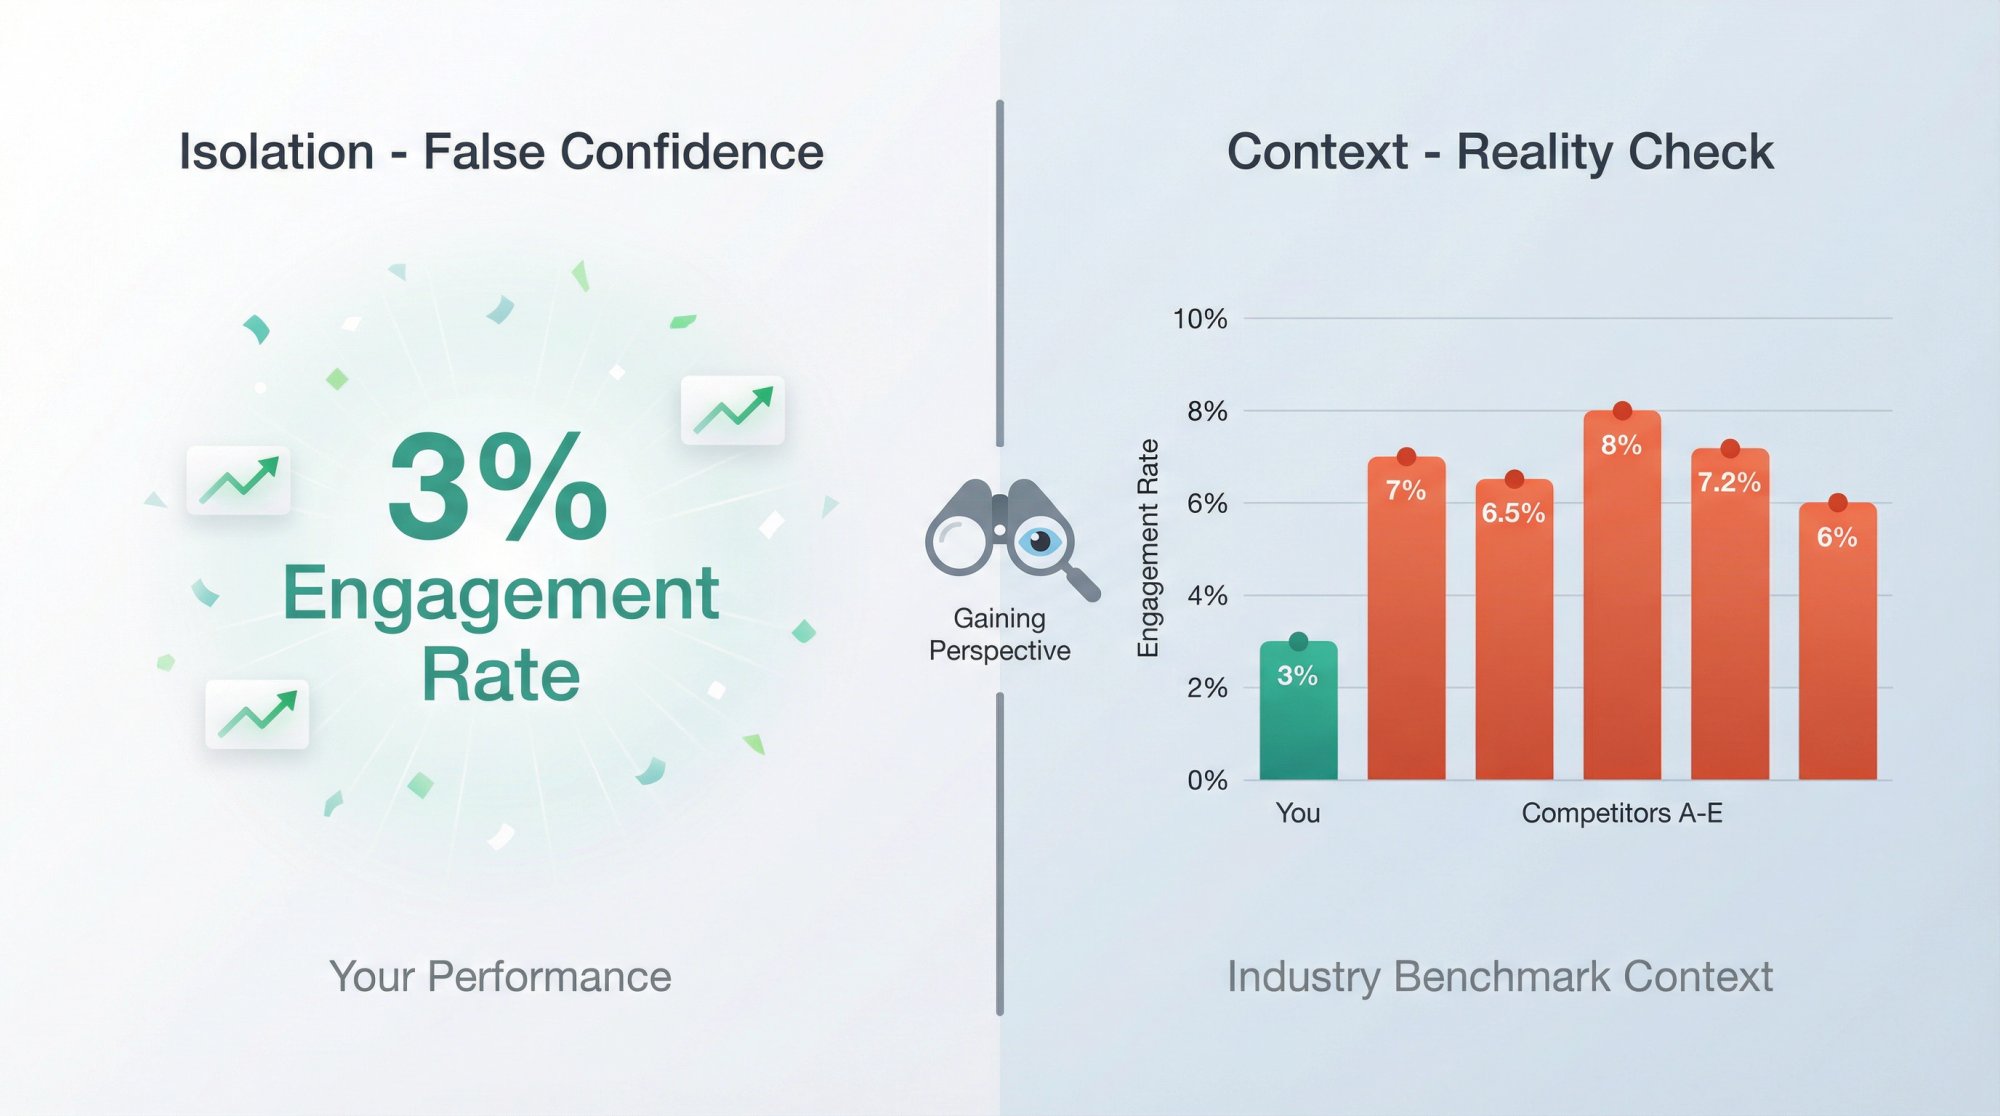
Your 3% engagement rate means nothing in isolation. If your competitors average 7%, you're losing ground without realizing it. Research shows that without competitive context, there's zero reliable way to know if your metrics represent success or failure.
Benchmarking provides three critical advantages:
• First, it gives you strategic context.
You might think your performance is solid until you discover competitors with similar follower counts consistently get double your views. That gap represents missed opportunities you can actually fix.
• Second, you uncover what works (and what doesn't).
When you track competitors systematically, patterns emerge. Maybe their Reels consistently outperform static posts by 4×, or they spike in engagement by using specific trending audio. These insights become your roadmap for content experiments worth running.
• Third, you catch platform trends early.
If multiple competitors suddenly see engagement jumps after adopting Q&A-style videos or AR filters, that's your signal to test those formats before the opportunity passes.
One reality check worth noting: overall Instagram engagement fell roughly 24% year-over-year through 2024-2025, according to industry benchmarks. This makes competitive context even more valuable. If your engagement is declining, benchmarking helps you distinguish between a platform-wide trend and a problem specific to your content.
Critical insight: The choice between tracking individual videos versus entire accounts will determine whether your team focuses on outliers or overall trends.
How to Identify Your Real Competitors on Instagram
Most people benchmark against the wrong accounts. They pick obvious industry rivals and miss the accounts actually competing for their audience's attention.
Use what we call the "3 rings" method:
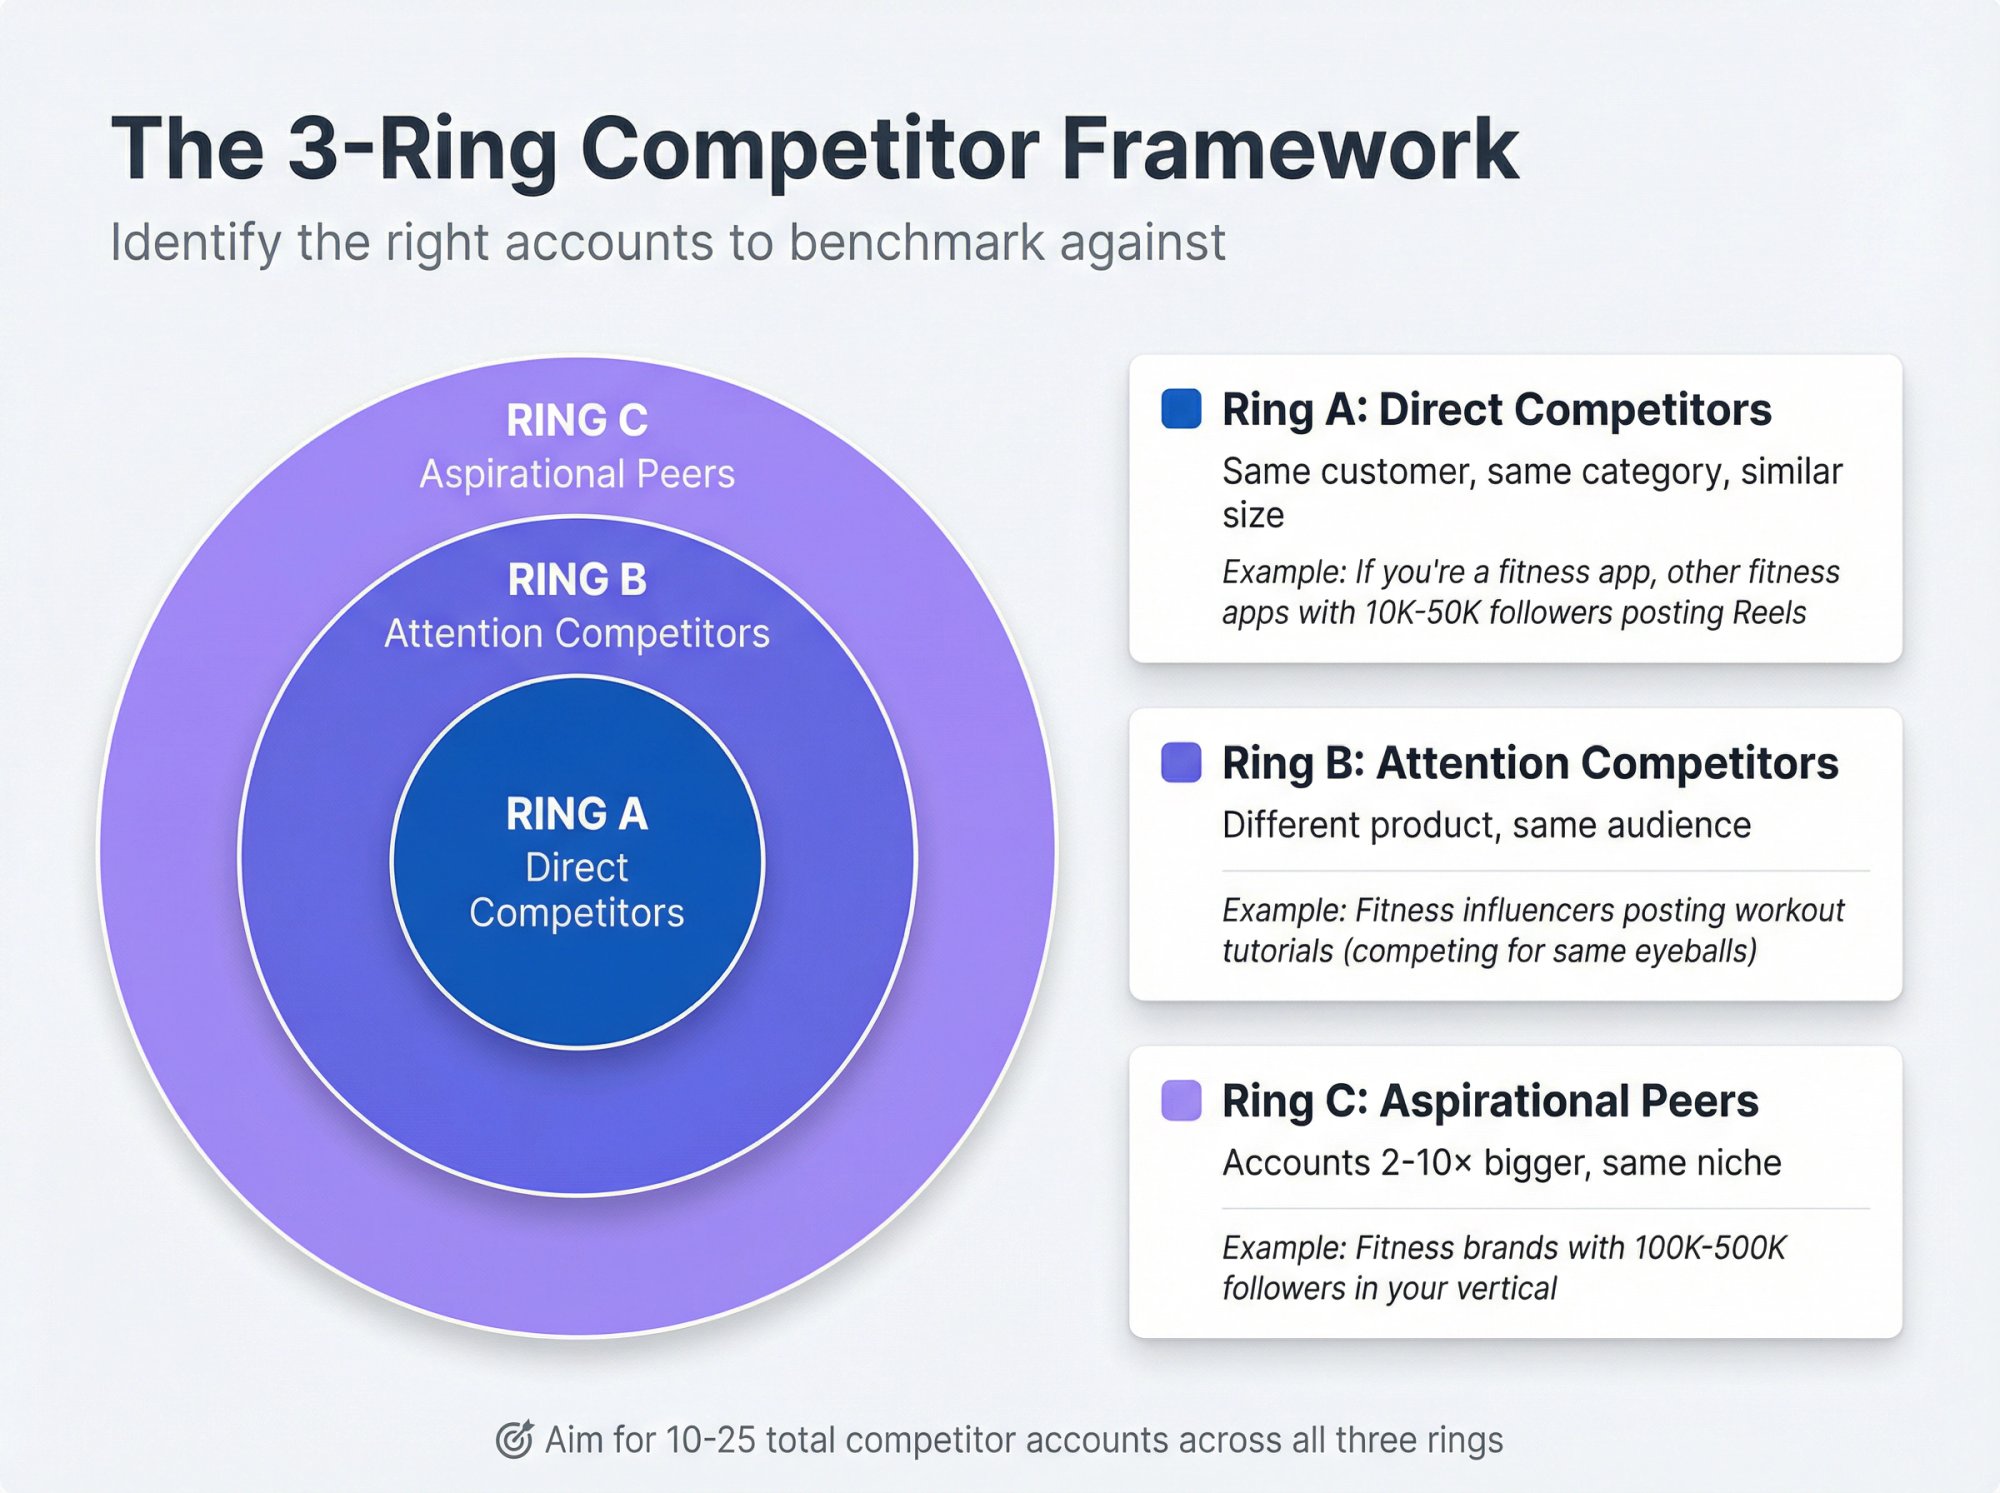
Ring A: Direct Competitors
Same customer, same category, similar size. If you're a fitness app, other fitness apps with active Reels belong here.
Ring B: Attention Competitors
Different product, same audience. That fitness influencer posting workout tutorials? They're competing for the same eyeballs, even though they're not selling an app.
Ring C: Aspirational Peers
Accounts 2-10× bigger that represent where you want to be, but still in your niche.
How to find them:
→ Use Instagram's search for relevant keywords and hashtags in your niche. The profiles appearing in top results are worth tracking.
→ Check "Suggested for you" accounts when you follow competitors. Instagram often surfaces accounts you hadn't considered.
→ See who your competitors collaborate with or tag in their Reels. Those partnerships reveal hidden competitors.
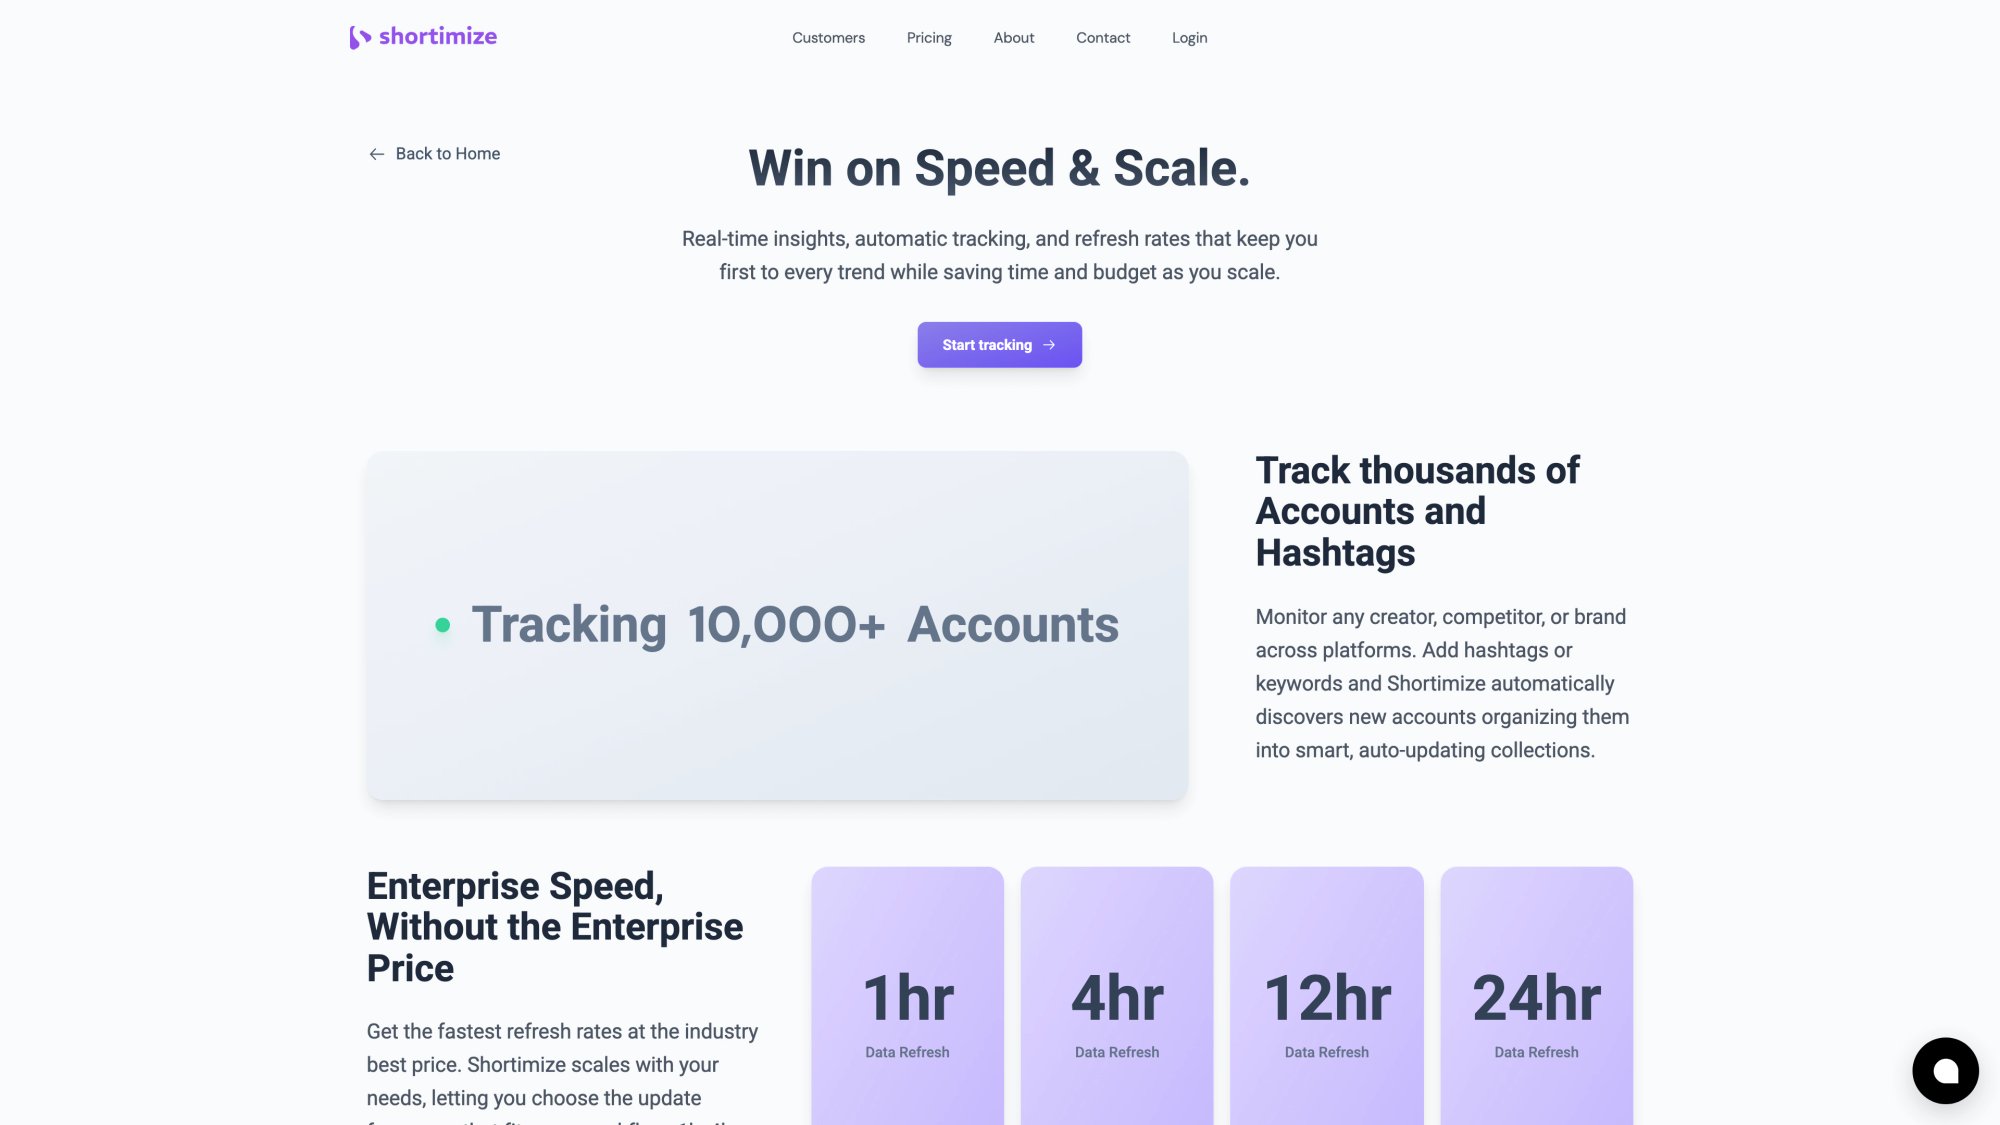
Tools like Shortimize can suggest similar accounts based on your profile and performance patterns, which saves hours of manual research.
Aim for 10-25 competitor accounts total. That's enough to create stable benchmarks without drowning in data. Instagram's new Competitive Insights feature lets you compare up to 10 rivals, which provides built-in competitive analysis capabilities.
Pro tip: If your industry has sub-niches, group competitors accordingly. A fashion brand might separately track fast-fashion retailers versus sustainable fashion labels to get more nuanced insights. Some analytics platforms let you organize competitors into Collections for exactly this purpose.
Which Instagram Reels Metrics Should You Track?
Not all metrics deserve your attention. Focus on the ones that reveal both reach and resonance.
The Core Metrics to Track
Posting Frequency
How many Reels are you and your competitors publishing weekly? If you post 4 Reels monthly and a top competitor posts 20, that context matters when evaluating why their total views or follower growth outpaces yours. Competitive frequency analysis shows whether you're matching the baseline output in your niche.
Views per Reel
This is your fundamental visibility metric. But don't just compare raw numbers. Look at view rate (views relative to follower count) to normalize for account size.
Smaller Instagram accounts (under 5K followers) average roughly 20% view rate on Reels, while large profiles with millions of followers naturally show lower percentages but higher absolute views, based on 2025 industry benchmarks. If a competitor with similar follower count consistently gets double your views, investigate why.
Engagement Actions
Compare average likes and comments per Reel, but calculate engagement rate: ((Likes + Comments) ÷ Followers) × 100%. This normalizes engagement to account size.
For example: 50 likes on 1,000 followers (5% engagement) actually outperforms 200 likes on 10,000 followers (2% engagement) despite lower absolute numbers.
Follower Growth
Track how follower counts change month-over-month relative to competitors. Spikes in competitor growth often correspond to a viral Reel, big shoutout, or campaign worth investigating.
On the flip side, stagnation or decline might hint at over-posting or quality issues.
Engagement Quality
Beyond raw numbers, check how engaged audiences really are. Skim comments on competitor Reels. Are people tagging friends and asking questions, or leaving generic one-word responses? Higher like counts matter less if your audience leaves more meaningful comments.
Content Mix and Themes
Note what proportion of their Instagram content is Reels versus static posts or Stories. Identify recurring formats in competitor Reels (tutorials, behind-the-scenes, challenges, testimonials). This helps you benchmark not just numbers but the strategy driving those numbers.
| Metric | What It Reveals | How to Use It |
|---|---|---|
| View Rate | Distribution efficiency | Normalize performance across different account sizes |
| Engagement Rate | Content resonance | Identify which accounts drive real interaction |
| Posting Frequency | Strategic commitment | Understand competitive baseline output |
| Follower Growth | Momentum and virality | Spot campaigns and viral moments worth studying |
Normalize for Fair Comparison
Always contextualize metrics by account size or time frame. A brand with 1 million followers naturally gets higher absolute views than one with 50,000 followers. That's why rates (engagement rate, view rate, growth rate) level the playing field.
Similarly, compare metrics over identical time periods. Stacking your last 30 days against a competitor's last 90 days produces meaningless comparisons. Use consistent intervals like monthly averages or per-Reel averages.
How to Gather Competitor Reels Data (3 Methods)
You know what to measure. Now you need the data.
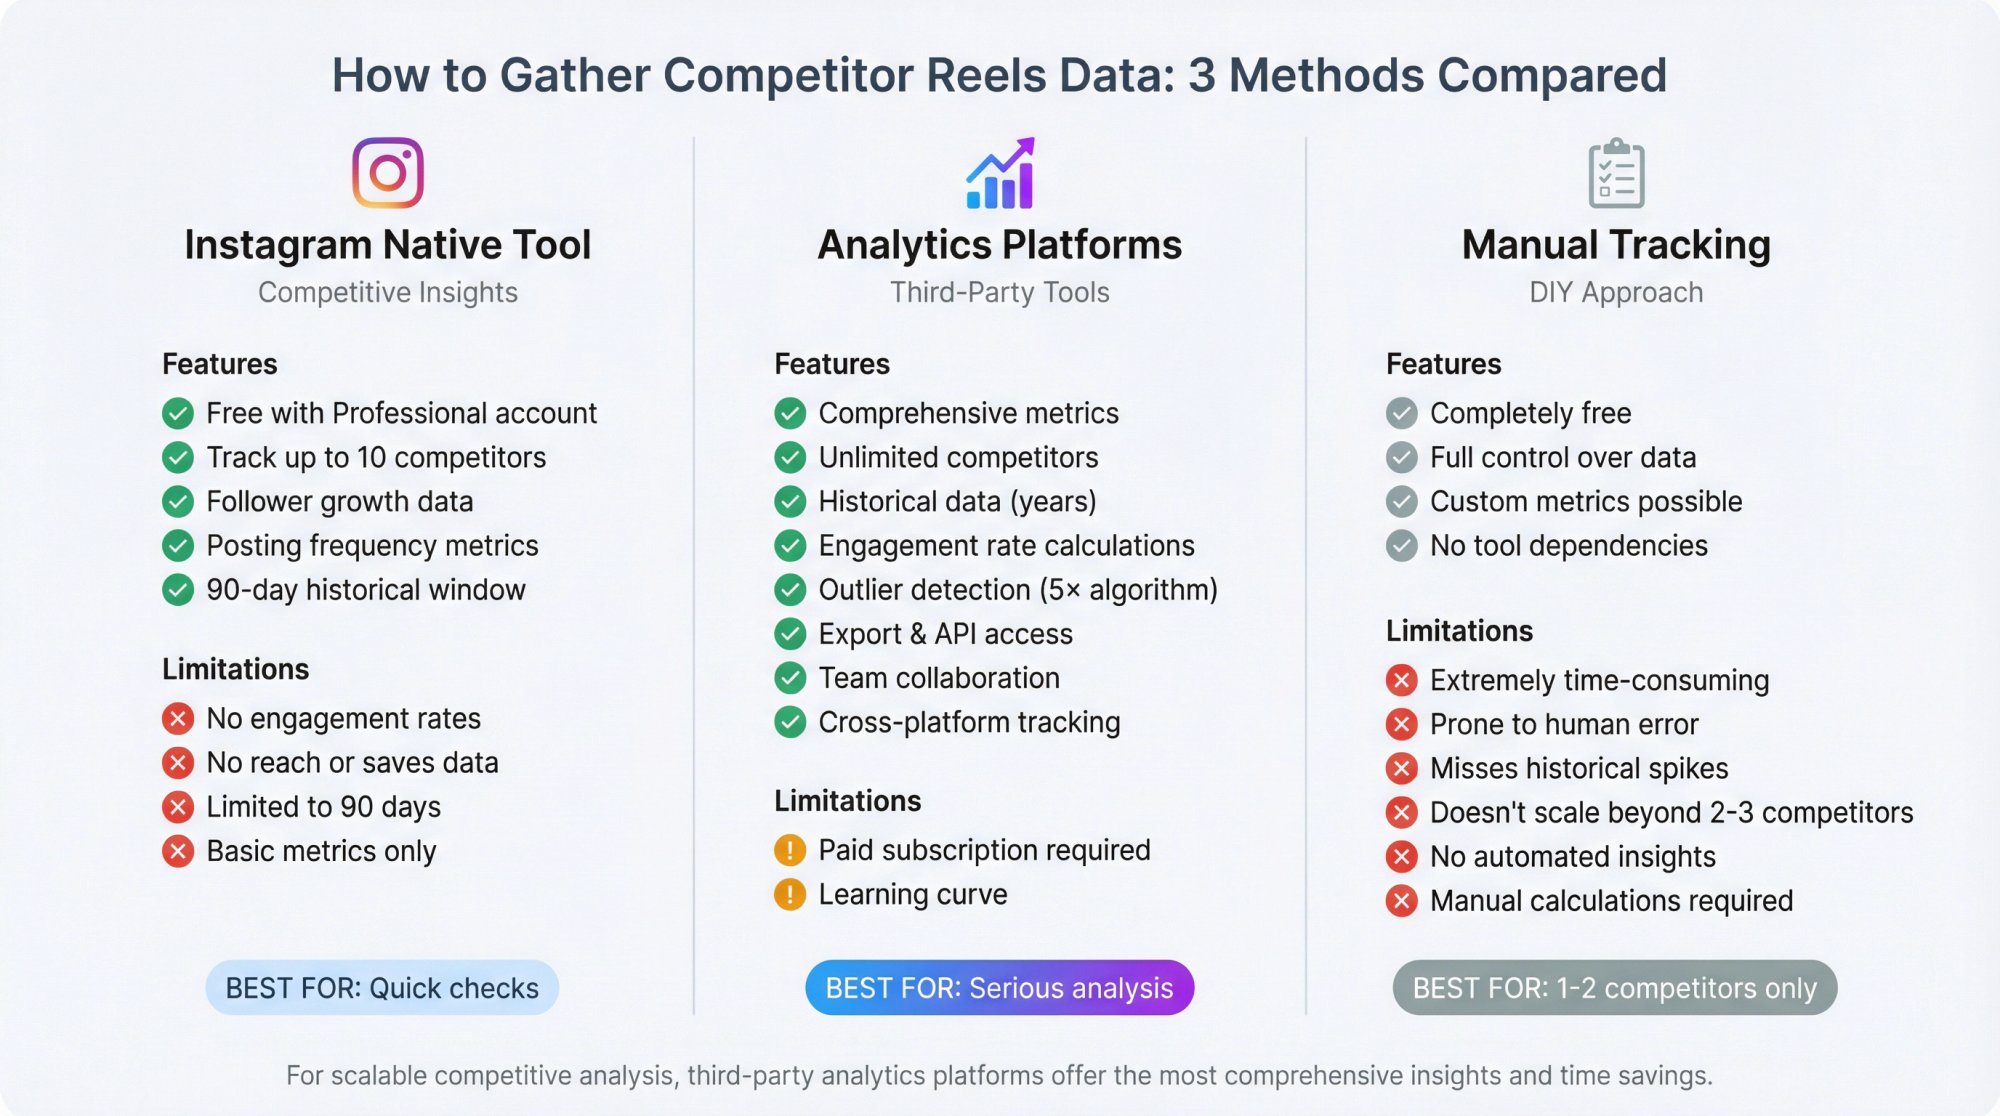
Method 1: Instagram's Native Competitive Insights Tool
Instagram launched Competitive Insights for professional accounts in late 2025. This built-in feature (found in your Professional Dashboard) lets you add up to 10 competitor accounts and see basic comparisons.
To access it: Switch to a Professional account (free in settings), then go to your profile menu → Professional Dashboard → Competitive Insights. Add competitor handles (must be public business or creator profiles) and select a time window like "Last 90 days."
What you get:
• Total followers and net new followers in the last 30/60/90 days
• Number of Reels posted
• Number of feed posts and ads in that period
• You can even view individual post performance of competitors, even if they've hidden like counts
The limitations:
Instagram's native comparison focuses on follower growth and posting frequency. Critically, it doesn't provide engagement rates, reach, saves, or shares. You see how often competitors post and how their follower count changed, but not how well their Reels actually resonated.
The look-back window caps at 90 days, so you can't analyze longer-term trends or seasonality. Think of this tool as a quick benchmark for output versus follower growth, but you'll need other methods for deeper insights.
Method 2: Best Instagram Analytics Tools for Competitor Tracking
This is where serious benchmarking happens. Analytics platforms automatically collect public data from Instagram accounts over time, presenting it in dashboards that make comparisons easy.
What good tools provide:
① Comprehensive metrics collection
Third-party platforms pull follower counts, likes, comments, and views for each Reel, often updating daily or hourly. For example, Shortimize lets you input any public Instagram handle or specific Reel URL, then fetches historical data on all that account's videos with follower growth charts, per-post engagement, and more.
② Side-by-side benchmarking
Dedicated tools let you compare multiple competitors in one view. You can create benchmarking reports showing your brand versus several competitors across the same timeframe, with charts of engagement, follower growth, and posting cadence. You literally see who's winning on each metric at a glance.
③ Engagement rate and content analytics
Most platforms calculate engagement rates automatically and highlight top-performing content. You can spot which Reels were viral outliers for a competitor. Shortimize's outlier detection automatically flags Reels that got 5× the account's usual views or engagement, so you can analyze what made them successful.
Also, these tools often analyze content mix (what percentage of posts are Reels versus images versus carousels) and identify common themes or hashtags that perform well.
④ Historical and exportable data
Unlike Instagram's 90-day limit, third-party tools keep historical data for as long as you track the account. That means you can spot seasonal patterns or do year-over-year comparisons. You can usually export data to CSV or integrate via API for deeper analysis.
For teams, the ability to share dashboards or reports becomes crucial. Shortimize allows organizing multiple competitors into shareable Collections for your team or clients, which streamlines collaborative analysis.
Choosing the right tool:
Some tools like Shortimize focus on short-form video across platforms, useful if you want to benchmark across Instagram Reels and TikTok or YouTube Shorts in one place. Others are broader social suites including Instagram competitor tracking as part of a larger package.
Pricing ranges from free basic plans (with limited features) to enterprise solutions. Many offer trials. Shortimize has a 7-day free trial you can use to pull competitor reports immediately, according to their features page.
Method 3: Manual Tracking (Last Resort)
You can do rudimentary benchmarking manually, especially with only one or two competitors. This involves periodically checking competitor profiles and logging numbers.
For example, on the first of each month, note each competitor's follower count and record views/likes on their last 5 Reels. Over time, chart their follower growth or average Reel engagement against yours.
Why this usually isn't worth it:
The effort increases rapidly with more competitors and metrics. You might miss historical spikes unless you check very frequently. Given efficient tools available (even free ones), manual tracking generally wastes time for most teams. As analytics experts note, these insights exist in the public data, but extracting them manually is impractical at scale.
Important: No matter which method, ensure you gather data under similar conditions. If using Instagram's Competitive Insights, all data will already be aligned to the same date range. If using third-party tools, set identical date filters for each account. If doing anything manually, pick a schedule (like weekly check-ins) and stick to it.
How to Analyze Instagram Reels Benchmarks
Collecting data is half the battle. The real value comes from translating patterns into insights.
Look for Performance Gaps
Identify significant differences between your metrics and competitors'. For example, maybe one competitor's average Reel gets 50% more views despite similar follower counts. That's a gap worth investigating.
Or perhaps your engagement rate is 5% while most competitors hover around 2%. That's a relative strength for you.
Break down the comparison by metric:
Posting frequency: Are they posting more or less often? If a competitor posts 2 Reels daily and you post 2 weekly, they're saturating the feed more. That might contribute to their higher views, or conversely, their engagement per Reel might be lower due to content fatigue.
Views: How do your typical views per Reel stack up? Lower views might mean you're reaching fewer people or losing them early (content might need stronger hooks to boost watch time). Higher views suggest you're doing something right with niche targeting, better hashtags, or higher shareability.
Engagement: Compare engagement rate especially. Much lower engagement on your content could mean it's not resonating deeply, or you might have "ghost followers" compared to a competitor with a very engaged fanbase. Much higher engagement suggests your content fosters community better.
Follower growth: If a competitor outpaces you in new followers, dig into possible causes. Did they run a contest or big campaign recently? Have they been featured somewhere? It could be content-driven (viral Reels bringing followers) or externally driven (paid promotions, shoutouts).
Identify Outliers and Spike Events
Benchmarking isn't just about averages. Pinpoint spikes or outliers in the data. These often hold valuable lessons.
For instance:
If you see a follower spike for a competitor in October, check their October content. Did they have a runaway hit Reel? A collaboration? Outliers can often be traced to specific events or posts.
If one competitor's Reel has exponentially higher views than their others, go watch that Reel. What's special about it? The format, topic, music, or even algorithmic luck?
Use your competitive data to ask "why" whenever you spot an anomaly. A competitor gained 1,200 followers last month while you gained 400. Why? Did they run an influencer partnership or get media coverage? Did they start posting twice as often, or have a Reel go super-viral with trending audio?
Competitive analysis will tell you what happened; it often requires sleuthing to uncover why it happened.
Pay attention to time patterns:
Do competitors see consistent dips in engagement on weekends, or spikes at certain hours? If you have timestamp data or a tool showing posting times and engagement, you might learn optimal posting times in your industry by observing when competitor content performs best.
Compare Content Strategies, Not Just Numbers
Metrics reflect content strategy. So go beyond the numbers and review qualitative differences in competitor Reels.
Content themes and topics: What themes do top-performing competitor Reels cover? Are there topics your competitors emphasize that you haven't touched? Perhaps you notice viral competitor Reels are often quick tutorials or funny skits, whereas yours are mostly product showcases. That contrast could explain an engagement gap and suggest trying more how-to or entertaining content.
Video style and length: Note if competitors typically make very short Reels (15 seconds) or longer ones (60+ seconds). A pattern here might indicate audience preference. If data shows a competitor's 15-second clips get more traction, experiment with snappier formats.
Some analytics even highlight which video lengths get the most views for an account, which can be a goldmine insight.
Use of features: Are competitors using captions, subtitles, stickers, or interactive elements on Reels? If one brand always uses trending music and you don't, that could be an edge for them in discovery. If they leverage captions to make their message clear even on mute, maybe their content retains viewers longer, boosting view count.
Frequency versus quality trade-off: Sometimes you'll find competitors posting less frequently have higher average engagement per Reel, hinting they focus on higher production value or curated content. Or the opposite: a competitor flooding Reels daily might have lower per-Reel engagement but wins on total impressions through volume.
Recognize these strategic choices. One competitor's strategy might prioritize maximum reach via quantity, another's might focus on posting less but making each Reel count. Benchmarking should illuminate these differences so you can decide where to position yourself.
Be Cautious Interpreting the Data
Avoid knee-jerk conclusions from raw comparisons. A classic mistake is treating the benchmark like a scoreboard ("Competitor A's Reels get 10k views, ours get 8k, we're losing!") without deeper context.
Correlation is not causation:
• They might be investing heavily in paid boosts. An e-commerce competitor might boost 50% of their Reels with ad spend. You might notice they have unusually high views but mediocre comments (a sign of paid reach). In documented cases, brands attempting the same strategy got more followers but later analysis showed organic Reels drove 3× more purchases than boosted ones.
• They could have had a one-off viral event. If over one quarter, a competitor's followers jumped drastically, maybe a single Reel went massively viral. If that's not repeatable, their baseline strategy might not actually be stronger than yours.
• They might benefit from external factors like seasonal trends or partnerships. A fitness coach competitor gained a big boost every January (New Year resolution season) simply because audience interest surged then. The real question is what they did with that opportunity.
In documented analyses, trainers noticed all rivals ramped up content in January. By analyzing the content, they found generic workout Reels underperformed while transformational challenge Reels (showing before/after progress) got much higher saves and shares. Those who adjusted their January content to focus on transformation stories gained more followers that month than any competitor.
The takeaway: Use competitor benchmarks to guide where to look deeper, but always add qualitative analysis to understand why the numbers are what they are.
Benchmark as a Guide, Not Gospel
Benchmarking is about improving your strategy, not obsessing over "beating" someone on every metric every week. If one competitor's Reel got 1,000 more likes than yours, that single data point doesn't mean you should pivot your entire content plan.
Instead, ask if there's something to learn. Did they tap into a trend or format you haven't?
Use benchmarks to set informed goals. For example: "Industry median engagement rate is roughly 0.5% on Reels, according to industry benchmarks. We're at 0.3%, so let's aim for 0.5% over the next quarter through better hooks and CTAs."
It's about context and continuous improvement.
How to Turn Benchmarking Into Action
Benchmarking is only valuable if it leads to action. After analyzing data and insights, here's how to apply what you've learned.
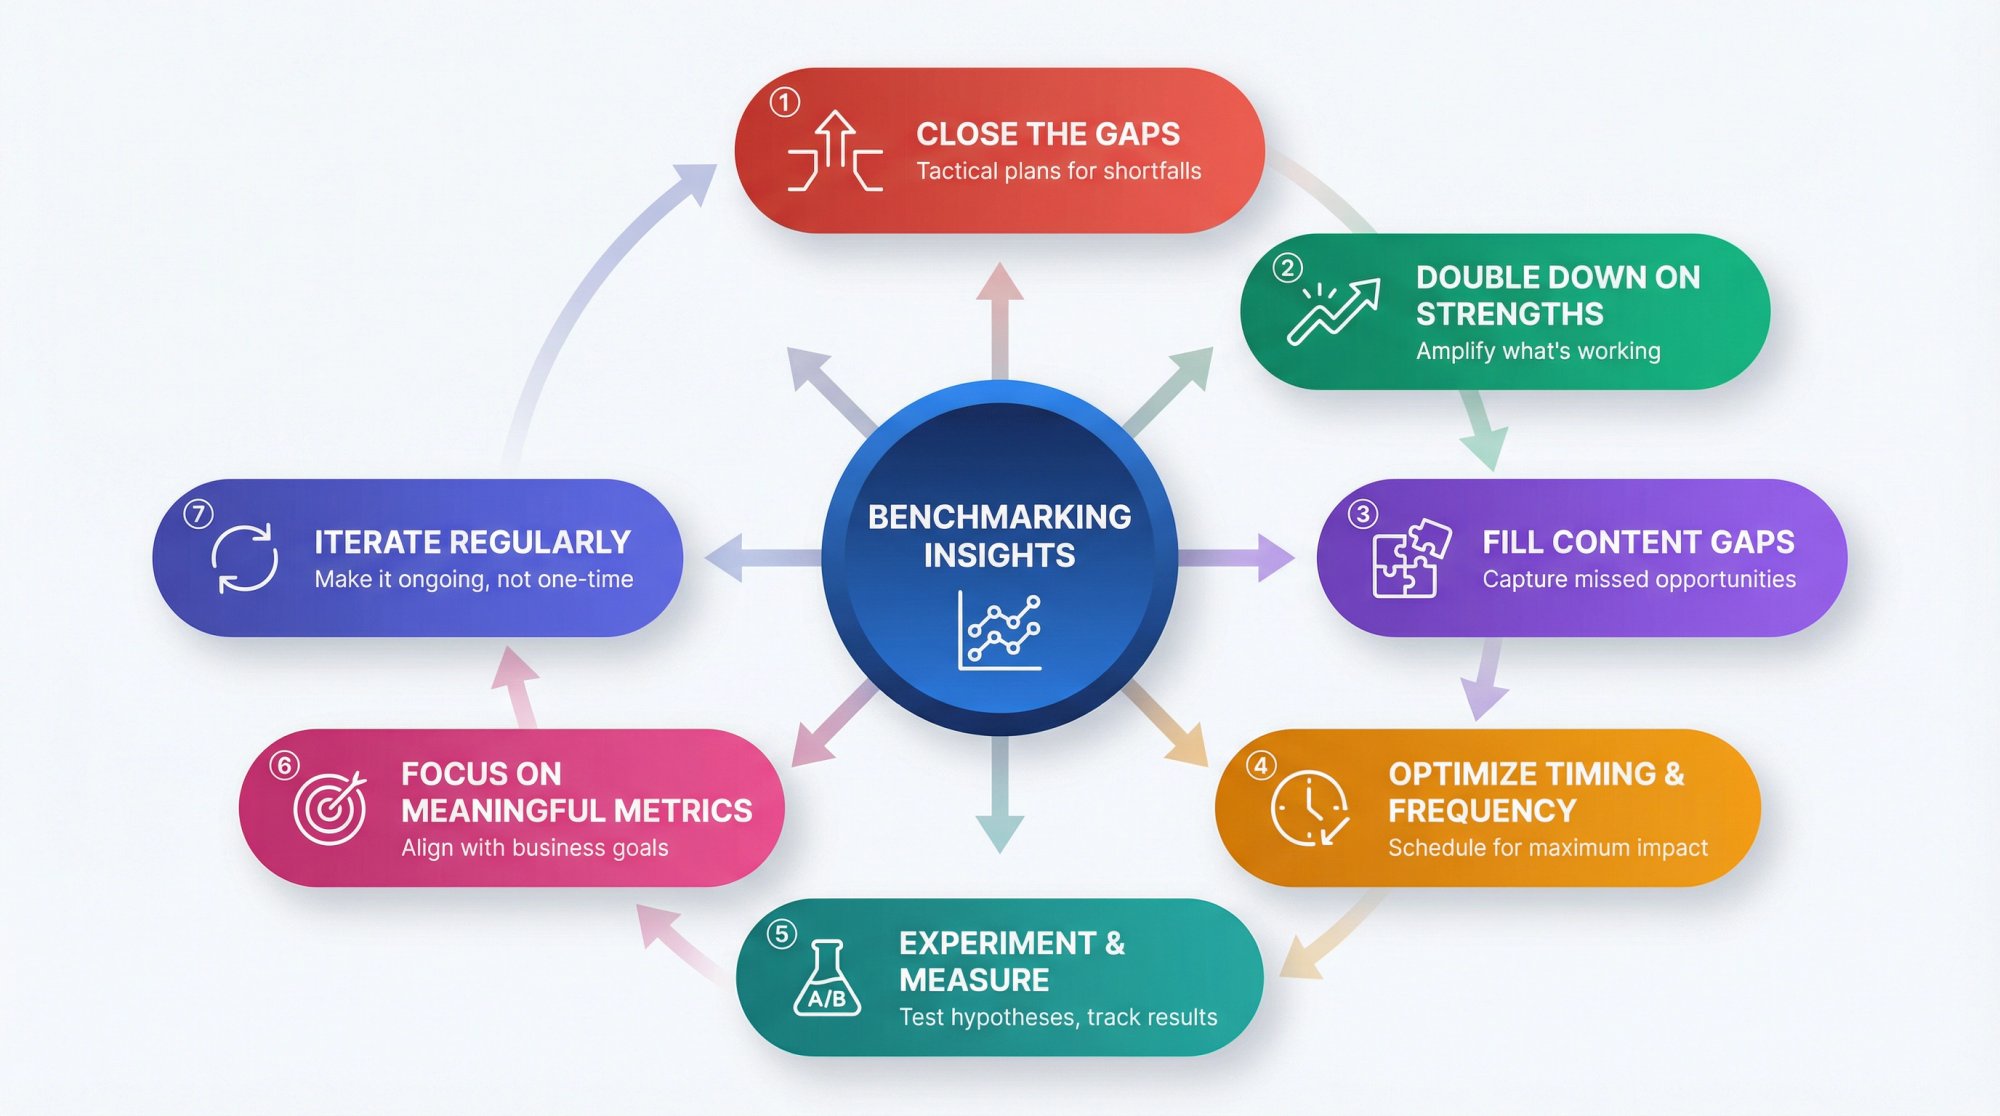
The Action Framework
① Close the Gaps
For each area where you found significant shortfall against competitors, devise a tactical plan.
If competitors' Reels get higher average views, maybe your distribution could improve. Try using more trending audio or collaborate with similar accounts to tap new audiences.
If your engagement rate lags, experiment with more interactive content: pose questions in captions, encourage comments (like "tag a friend" prompts), or incorporate audience polls in Stories to spill over engagement onto Reels.
If you're behind on posting frequency (they post daily, you post weekly), consider if upping cadence is feasible without hurting quality. You might not match them post-for-post, but you could incrementally increase output and monitor whether engagement holds steady or improves.
② Double Down on Strengths
Benchmarking might reveal areas where you are actually ahead. It could be higher engagement, better consistency, or faster responses to comments. Whatever sets you apart, maintain it.
For example, if your analysis shows your Reels have the highest share of saves (perhaps gleaned from "I'm saving this!" comments or anecdotal data), lean into that type of content. Or if your follower growth was best-in-class during a month where you ran a particular campaign, consider repeating or expanding that campaign.
③ Fill Content and Strategy Gaps
Look for content opportunities competitors missed, and capitalize on them.
Did your benchmarking uncover a topic none of your competitors have covered in Reels? That's a ripe opportunity for you to fill the void and become a go-to source.
If rivals' content skews heavily one way (like all slick promotional videos), you might differentiate with a more personal, behind-the-scenes approach. Competitor analysis can inspire new content ideas: maybe you realized none have leveraged a trending meme format in your niche, or their how-to content is shallow, leaving room for you to create more in-depth micro-tutorials.
④ Optimize Timing and Frequency
If your benchmarking indicated certain days or times work best (either for you or evidenced by competitors' engagement patterns), adjust your posting schedule.
For instance, you might discover through competitive data that Reels posted around 6 PM get noticeably higher engagement in your vertical. Test that timing for your own posts if you weren't already.
Similarly, if a competitor's consistency appears to benefit them (they never miss posting on Fridays and always get good traction), establish a consistent schedule for yourself.
⑤ Experiment and Measure
Treat your findings as hypotheses to test.
If a competitor's success seems linked to very snappy, meme-style Reels, try creating a couple of your own and see how your audience responds. If others gained followers via collaboration Reels (two brands or influencers co-creating content), line up a collab in the coming weeks.
The point is to iterate: implement one change at a time (if you change everything, you won't know what worked) and monitor your metrics for impact.
With the right tools, you can easily see if changes move the needle. By tracking your account in the same analytics platform as competitors, you can watch your engagement or follower growth line creeping closer to theirs or surpassing them over subsequent reports.
⑥ Focus on Meaningful Metrics
Keep your business goals in mind and don't get distracted by vanity metrics.
It's possible a competitor's Reels benchmarks are higher on superficial metrics, but if those aren't translating to what matters for you (sales, sign-ups, brand sentiment), prioritize improvements that align with your goals.
Focus on what matters: Simple volume comparison of posts to follower growth doesn't tell you much without looking at deeper metrics like clicks or shares that lead to actual outcomes.
For instance, maybe competitor A's Reels get 2× your views, but you notice competitor B (with slightly lower views) gets more comments from potential customers asking questions. If your aim is driving consideration or conversion, engagement quality could outweigh sheer view counts.
So when acting on benchmarks, weight the metrics that align with your objectives. If awareness is the objective, reach and follower growth benchmarks are key. If engagement and community are goals, focus on raising engagement metrics relative to peers. If conversion is key, benchmark click-throughs or use UTM tracking on your link in bio.
⑦ Iterate Competitive Benchmarking Regularly
Make competitor benchmarking an ongoing process, not a one-time project.
Markets evolve, algorithms change, and competitor strategies adapt. The benchmarks today might be different next quarter.
Set a cadence (monthly or quarterly) to review competitor metrics and see how trends shift. Continuous tracking alerts you if a new competitor emerges and starts outperforming the field, or if an existing competitor suddenly pivots strategies.
Many brands set up alerts (using Slack or Discord notifications) when a competitor has a breakout post or sudden surge. This way you can quickly investigate and react if needed.
Advanced Instagram Reels Benchmarking Framework
If you're managing multiple accounts or running an agency, you need a more sophisticated system than basic comparisons.
Now we're getting into the professional toolkit.
The Percentile-Based Approach
Stop using averages. Reels performance is "power-law": one viral Reel can distort the average completely.
Instead, use:
• Median views (P50): What does typical performance look like?
• P75 views: What does "strong" look like in your peer group?
• P90 views: What does "exceptional" look like?
Your targets should usually be P75, not P90. P90 is for specific campaigns or hero content.
Directional view rate benchmarks by follower size:
| Follower Range | Average View Rate |
|---|---|
| 1K-5K followers | ~20% |
| 5K-10K followers | ~10.2% |
| 10K-50K followers | ~8% |
| 50K-100K followers | ~5% |
| 100K-1M followers | ~4% |
These numbers come from industry benchmarks based on 31 million posts. Use them as directional guardrails while your competitor set matures.
The Diagnostic Quadrant
Plot competitors and your account on a 2×2 map:
X-axis: View Rate (distribution efficiency)
Y-axis: Engagement per View (resonance)
You'll see four archetypes:
① Stars (High view rate, high engagement/view)
Steal their formats and hooks immediately.
② Broadcasters (High view rate, low engagement/view)
Good at packaging; weaker at value or community.
③ Cult brands (Low view rate, high engagement/view)
Great resonance; may be niche or under-distributed.
④ Strugglers (Low view rate, low engagement/view)
No clear engine. Avoid copying them.
This quadrant is the fastest way to decide what to copy and what to ignore.
The Outlier Index
Calculate: Outlier Index = P90 views / Median views
Interpretation:
• High outlier index: Occasional big hits, inconsistent baseline
• Lower outlier index with solid median: Consistent performance engine
This tells you whether a competitor's strategy is "repeatable" or "lottery-ticket."
The 4-Layer Content Drilldown
For each top competitor Reel (P90+), tag it with:
→ Layer 1: Hook type
Shock statement, "3 mistakes" listicle, before/after, POV/meme, tutorial/demo, storytime
→ Layer 2: Value type
Entertainment, education, identity ("this is for people like us"), utility (templates, scripts, checklists)
→ Layer 3: Packaging
Duration bucket, caption style (micro, long-form, CTA), on-screen text density, pacing (cuts per 5 seconds)
→ Layer 4: Distribution triggers
Audio choice (trending/original), collab tag usage, hashtags pattern (broad versus niche), posting time pattern
Now you're benchmarking strategy, not just content.
How to Scale This with Shortimize
Manual benchmarking breaks when you manage multiple brands, multiple creators, or multiple platforms.
Shortimize is built specifically for tracking and benchmarking short-form across Instagram Reels, TikTok, and YouTube Shorts from one place.
The workflow:
① Create a competitor Collection
Examples: "Direct competitors – US", "Aspirational – EU"
Shortimize supports organizing accounts into Collections for collaborative workflows.
② Add competitor accounts by URL or handle
Shortimize's positioning is "track with just a link", ingesting public data and refreshing it automatically.
③ Use median and outlier views to benchmark properly
Shortimize's Instagram analysis pages explicitly emphasize median and virality metrics and quickly identifying outliers, not just averages.
④ Compare posting cadence and growth trends over time
The Instagram account analysis workflow includes dashboards showing growth, views, and engagement trends over time, useful for competitor cadence and momentum analysis.
⑤ Export for reporting
Competitive intelligence often ends in a deck or weekly email. Shortimize's positioning includes exporting tables and reporting at scale.
What This Unlocks (That Manual Tracking Can't)
Velocity tracking. Views over time, because the system keeps updating data instead of you taking one screenshot.
Outlier detection. So you can focus on what actually worked, not what looked cool.
Similar accounts discovery. To expand your competitor set beyond what you already know, based on performance patterns.
The Two-Week Reporting Cadence
URL: Manual template creation needed
Location: The Two-Week Reporting Cadence section
Instructions: Create a professional reporting template showing percentile metrics (View rate, Engagement/view, Comment rate, Posting cadence), what changed since last report, and 3 planned experiments. Export as PNG. See web-screenshots/captures/SC-05.md for full details.
Every 2 weeks, ship a one-pager:
1. Where We Stand (vs competitor percentiles)
• View rate: P__
• Engagement/view: P__
• Comment rate: P__
• Posting cadence: P__
2. What Changed Since Last Report
"Competitor X shifted to more memes; their median views increased 38%"
"Our view rate improved but engagement/view fell. Hook improved, value didn't"
3. What We're Doing Next (3 experiments)
• One distribution experiment (hook/package)
• One resonance experiment (format/value)
• One consistency experiment (cadence/series)
This makes benchmarking actionable instead of academic.
Common Questions About Reels Benchmarking
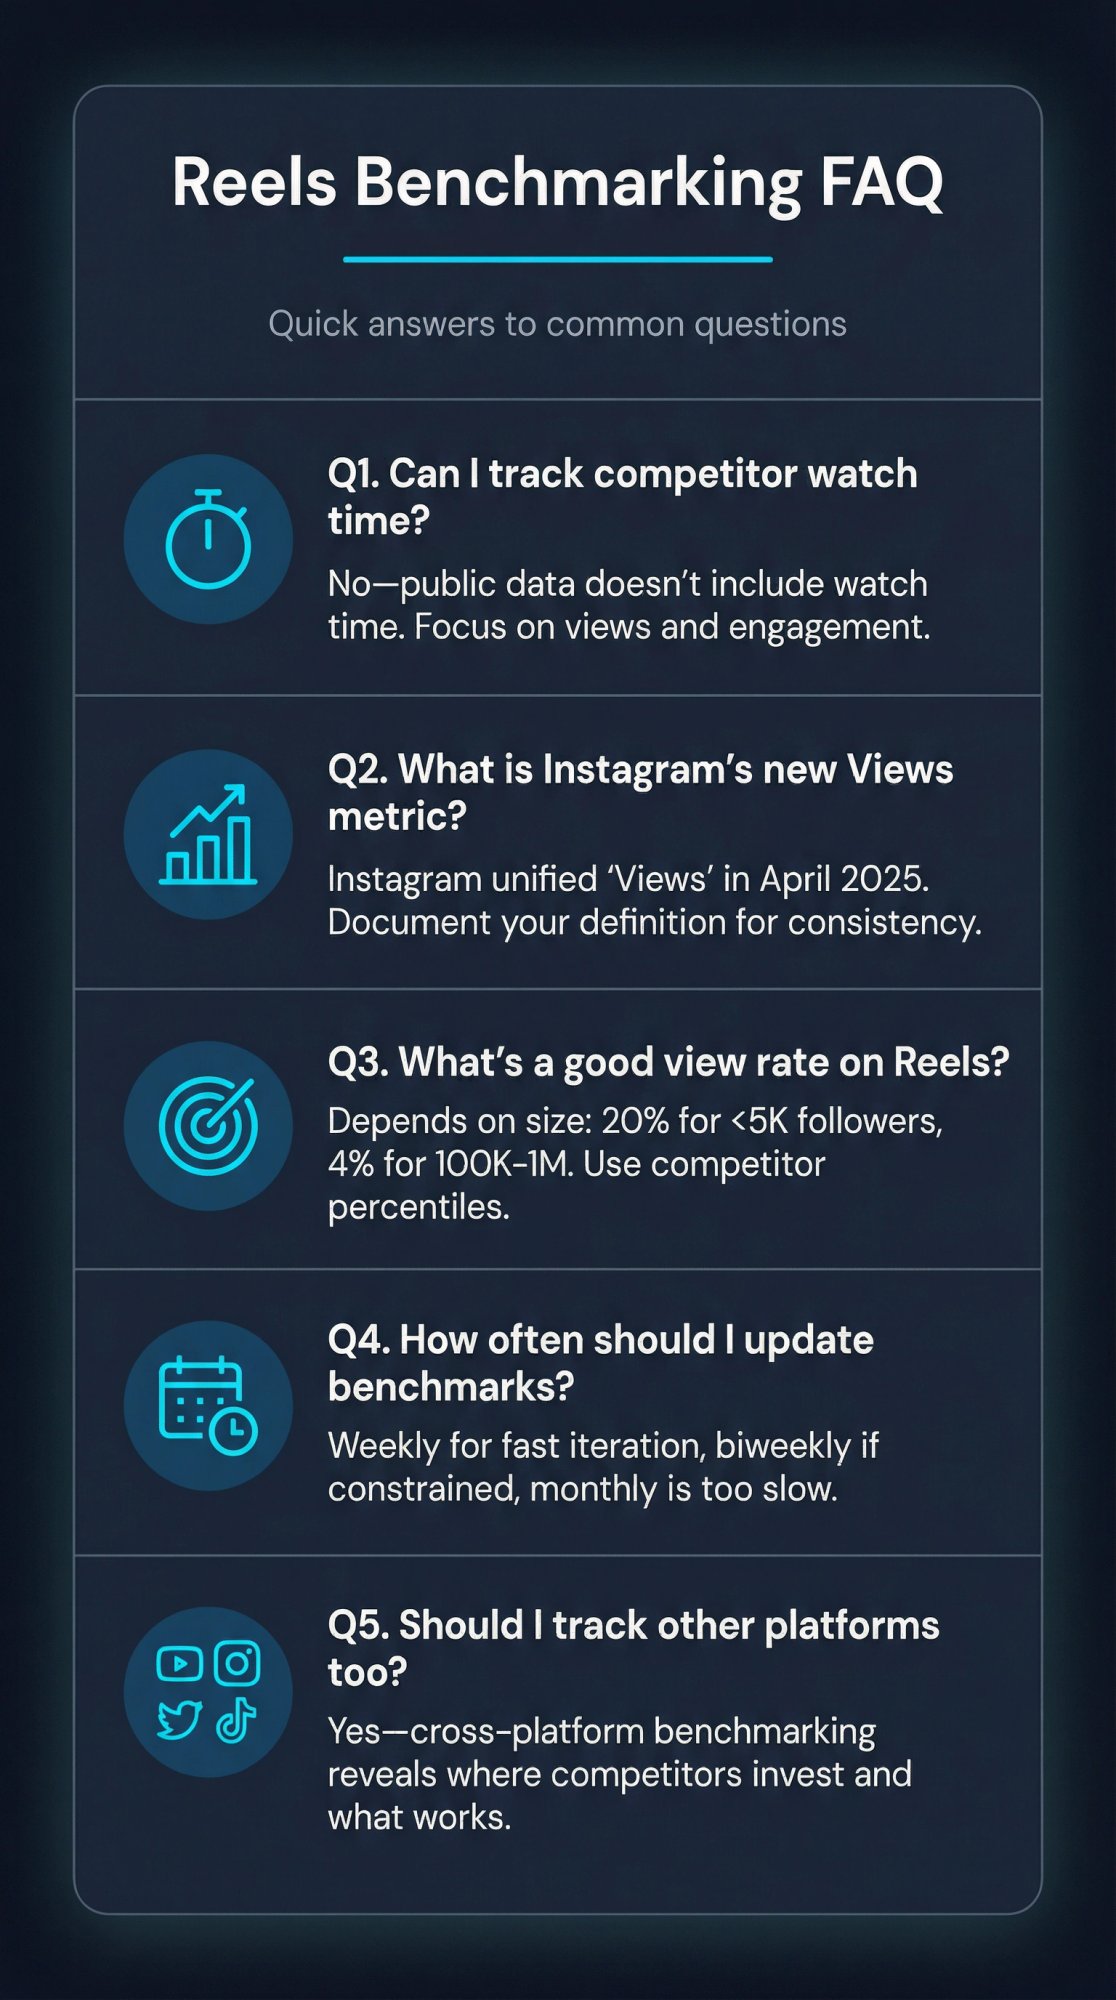
Can I Track Competitor Reels Watch Time?
Not reliably from public data. Watch time and average watch time are powerful internal diagnostics, but competitor benchmarking mostly relies on public views and visible engagement.
What Is Instagram's New Views Metric?
Standardize what you mean by Views for your benchmark system and document it. Industry analysts have documented Instagram insight metric deprecations and remappings around April 2025, and "Views" has become the central measurement concept across formats.
What's a Good View Rate on Instagram Reels?
It depends on follower size and niche. As a directional reference, industry benchmarks show view rate declining with account size (roughly 20% for 1K-5K followers, around 4% for 100K-1M).
But your competitor percentile is still the best target.
How Often Should I Update Benchmarks?
Weekly if you're running aggressive creative iteration.
Biweekly if you're resource constrained.
Monthly is often too slow for short-form.
Should I Track Competitors on Other Platforms Too?
Absolutely. If your competitors are active on TikTok or YouTube Shorts, cross-platform benchmarking reveals where they're investing energy and what formats work across channels. Tools like Shortimize track all three platforms in one dashboard, which makes this practical instead of painful.
The Reality Check You Need to Hear
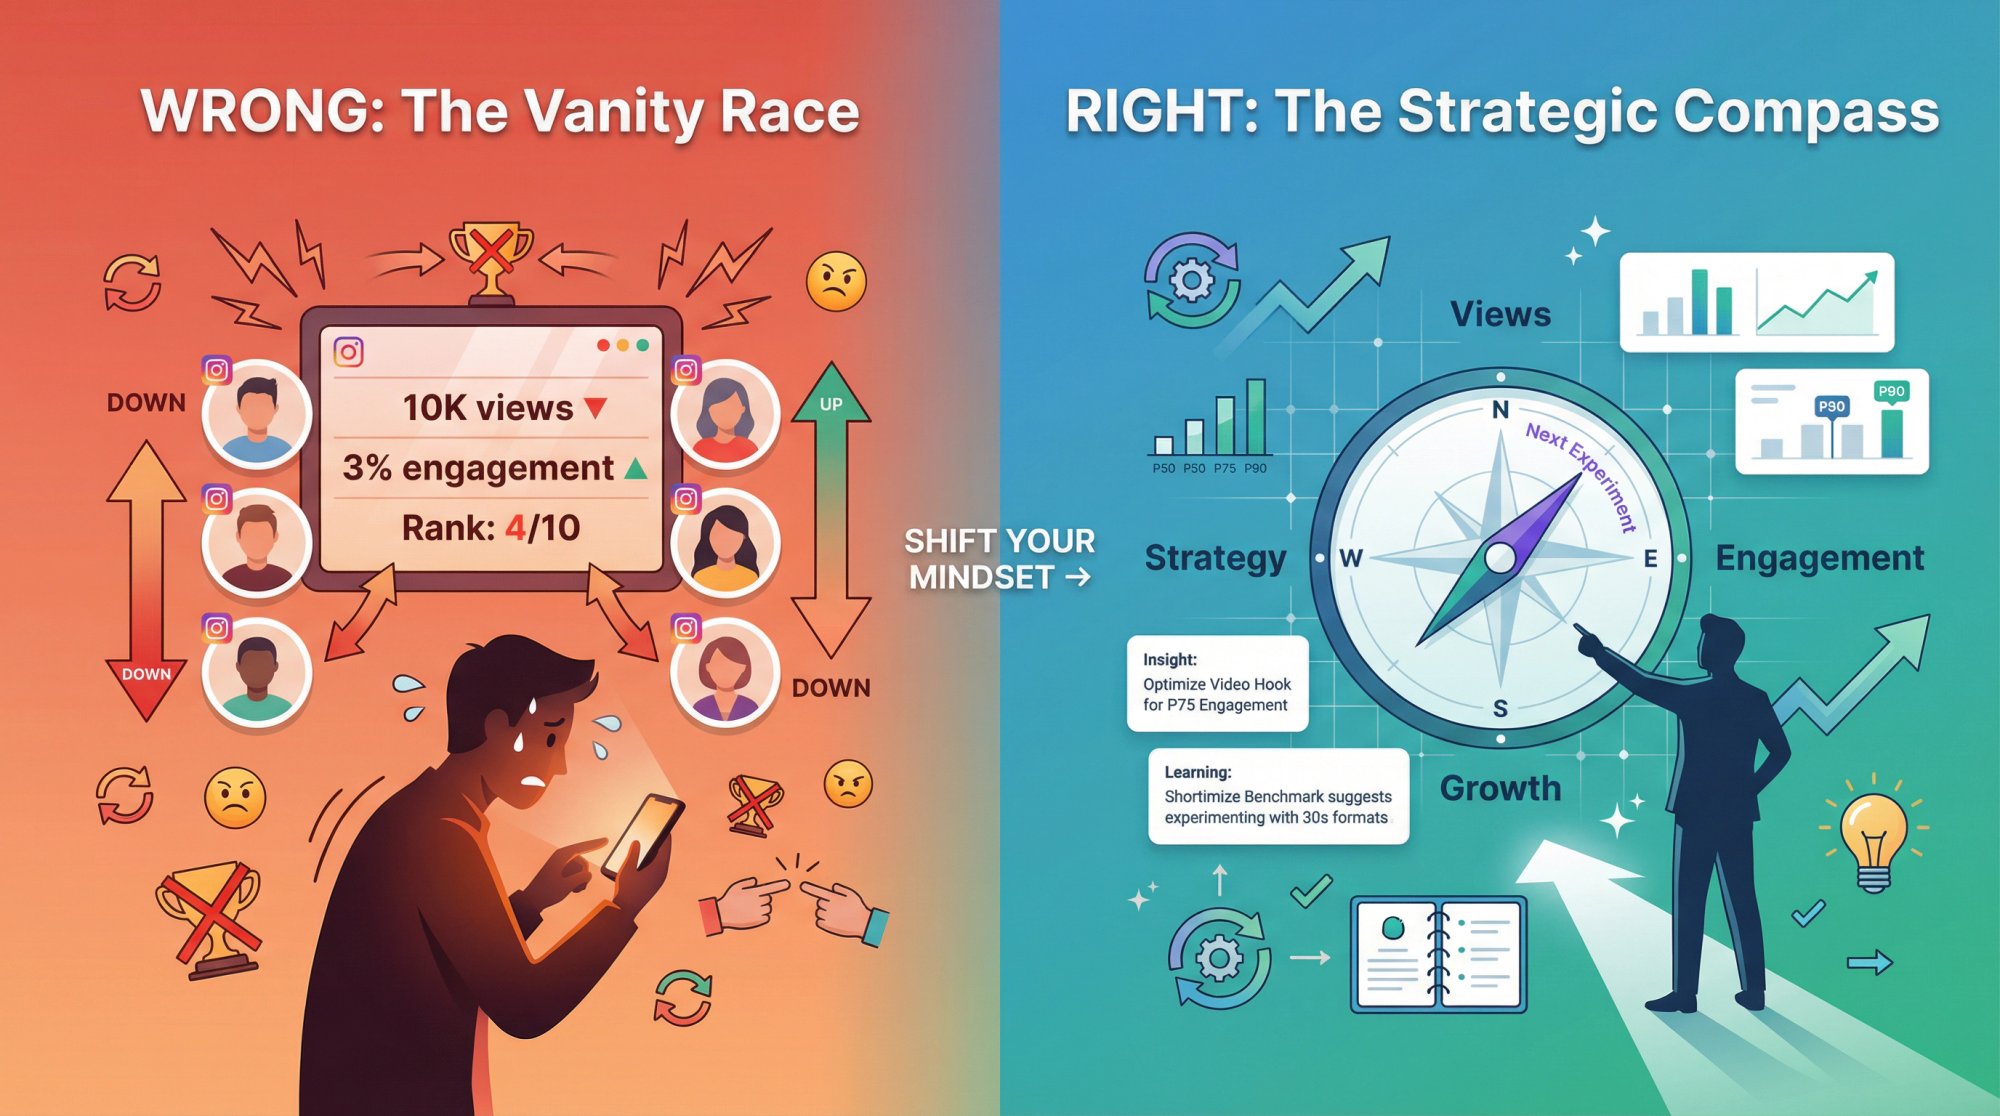
Benchmarking your Reels against competitors isn't about winning a vanity metrics race. It's about building a system that shows you exactly where you stand and exactly what to improve.
If one competitor's Reels dominate in views, use that knowledge to examine their tactics and experiment with your own content. You might find a twist that works even better for your brand.
If another competitor lags behind on engagement, analyze what they might be doing wrong. It could validate certain approaches you're taking, or caution you away from pitfalls.
The evolving nature of social media matters here. Today's advantage can become tomorrow's average. Instagram's introduction of the Competitive Insights tool in 2025 underscores how benchmarking is becoming standard practice for social strategy.
But as we've seen, that native tool only scratches the surface. Serious marketers need to go deeper, looking at engagement quality, shareability, cross-platform impact, and conversion metrics that aren't captured in basic comparisons.
This is where dedicated analytics solutions come in, providing the comprehensive view needed to connect the dots between a competitor's social metrics and business outcomes.
As you implement your benchmarking insights, also track how those changes impact your bottom line. For example, if increasing your average Reels views by 30% (thanks to ideas gleaned from competitors) also leads to a 15% uptick in website traffic or product inquiries, that's a true win. One that pure competitor metrics wouldn't show, but your internal analytics will.
Use competitor benchmarks as a compass, not a scorecard.
Stay curious about why competitors are doing well or poorly. Stay critical by questioning the numbers. Stay agile by adapting your strategy with the lessons you learn.
Do this, and benchmarking your Reels against competitors becomes not an exercise in comparison, but a driver of continuous improvement and innovation for your own brand's content.
Don't be afraid to leverage the tools at your disposal to make this process easier. Whether it's Instagram's built-in comparisons or a robust platform like Shortimize that tracks every metric across multiple accounts automatically, these tools exist to save you time and surface insights you might otherwise miss.
With a free trial available, you can run a quick competitive audit on your top rivals and see the data for yourself. However you do it, commit to weaving competitor benchmarking into your routine.
In the fast-paced world of Reels and short-form video, the brands that learn fastest are the ones that win. And there's no quicker way to learn than by observing those around you.