Your Shorts retention is confusing right now. Not because you're missing something obvious, but because YouTube literally changed how it works.
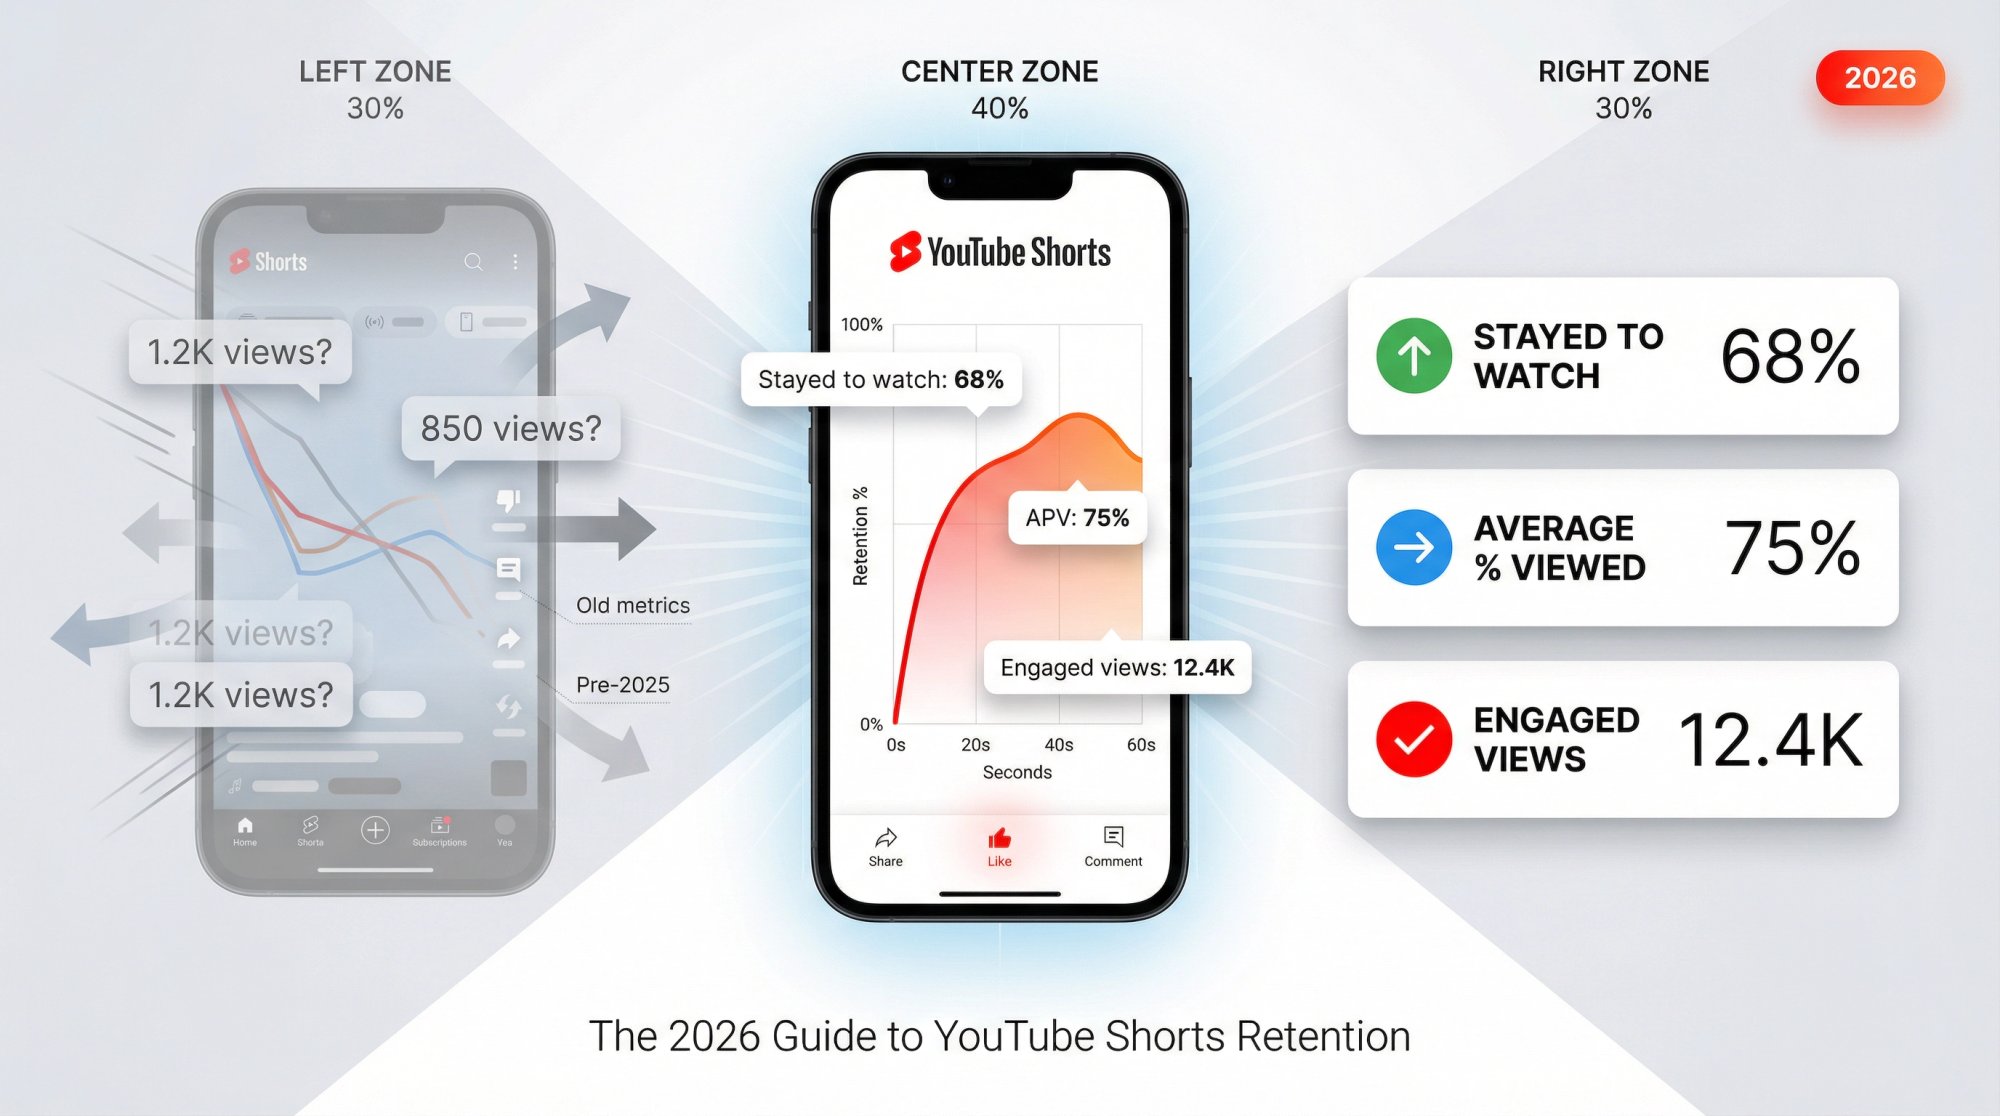
On March 31, 2025, YouTube updated Shorts view counting. A "view" now counts the moment a Short starts to play or replay, with no minimum watch time. They also kept the old behavior under a new metric called Engaged views. And here's the part that matters: YouTube Partner Program eligibility and Shorts ad revenue sharing are based on engaged views, not the new views metric.
So if you've been reading older retention guides (or even some 2025 ones), they're defining "views" in a way that's no longer accurate.
This guide reflects January 2026 reality. Current definitions, what actually matters, and exactly how to improve it.
What Is Retention Rate for YouTube Shorts?
When people say "retention rate" for Shorts, they're usually talking about one of these metrics (or confusing several of them):
How Many Viewers Stayed to Watch vs Swiped Away
This is your scroll-stopping power. The percentage of times viewers watched your Short versus swiped away.
You'll see this in YouTube's Shorts analytics as:
→ "Stayed to watch" (definition: percent of times viewers viewed vs swiped away)
→ Or "How many chose to view" in the Content tab (same concept: viewed vs swiped away)
This isn't your retention curve. It's the gate that determines whether viewers even give you a chance.
Average View Duration (AVD)
The average time watched among viewers who stayed to watch. For Shorts, YouTube calculates AVD from engaged views and their corresponding watch time.
Average Percentage Viewed (APV)
The average percentage of your Short watched among those who stayed to watch. For Shorts, APV is calculated from engaged views + watch time.
Quick translation:
Stayed to watch = hook performance
APV / AVD = story + pacing performance
What Are Engaged Views on YouTube Shorts?
Because Shorts "views" now include any play start (even quick scroll-bys), YouTube preserved the older view logic as Engaged views: "how many times viewers stayed to watch past the initial seconds", and it doesn't include loops.
Use engaged views when you want to compare Shorts performance over time, or when you want a metric closer to "real views" in the old sense.
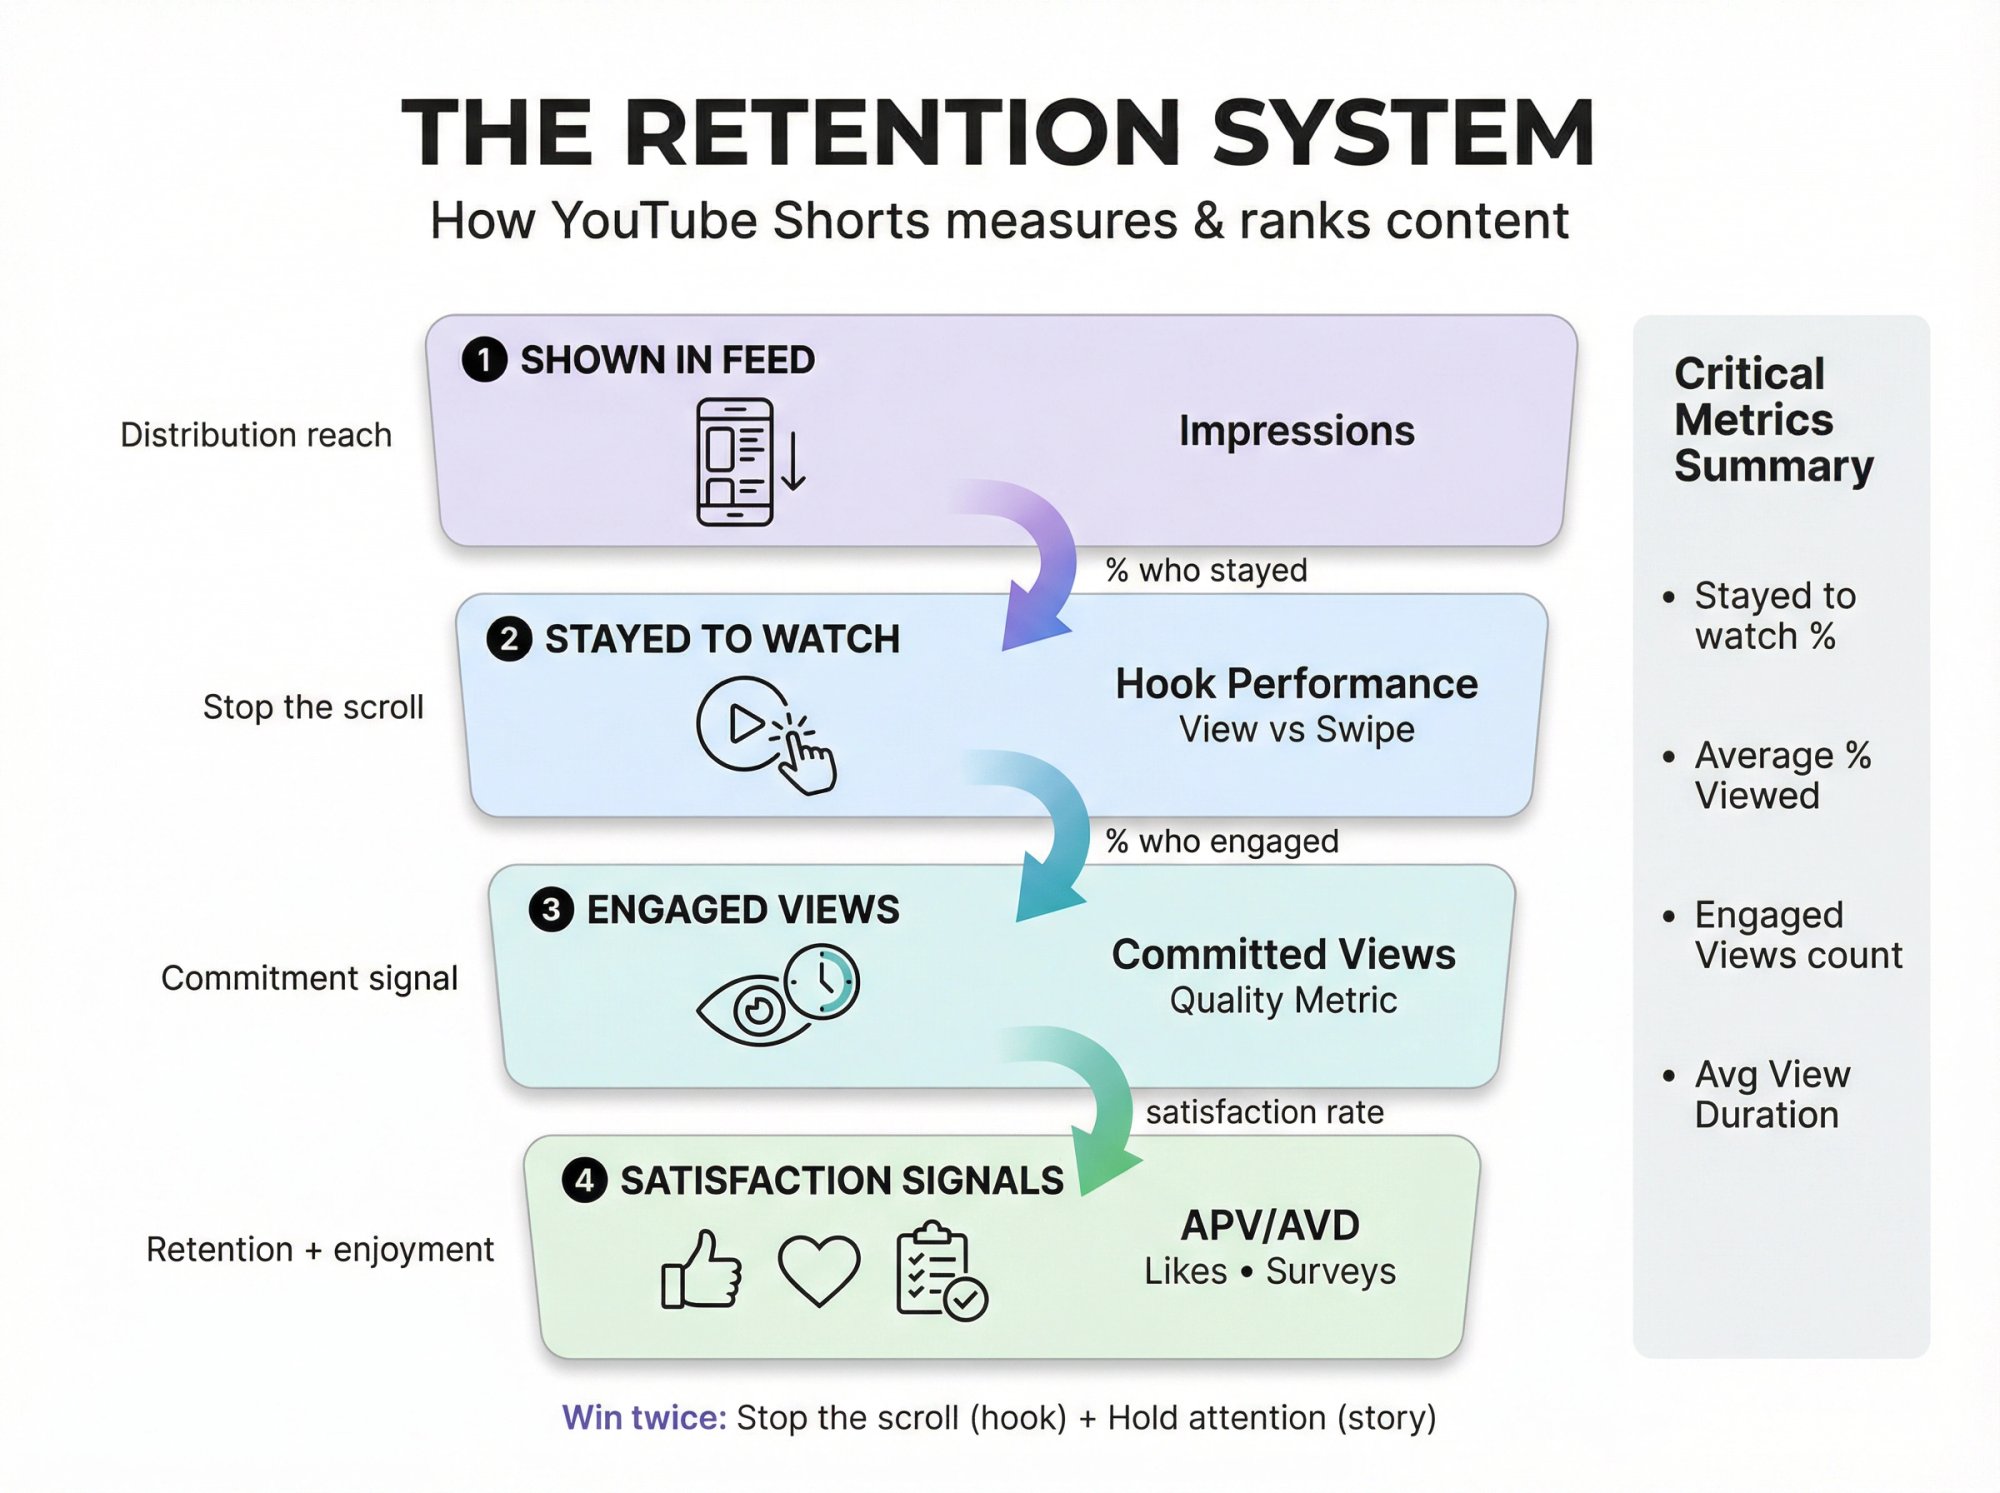
How the YouTube Shorts Algorithm Actually Works
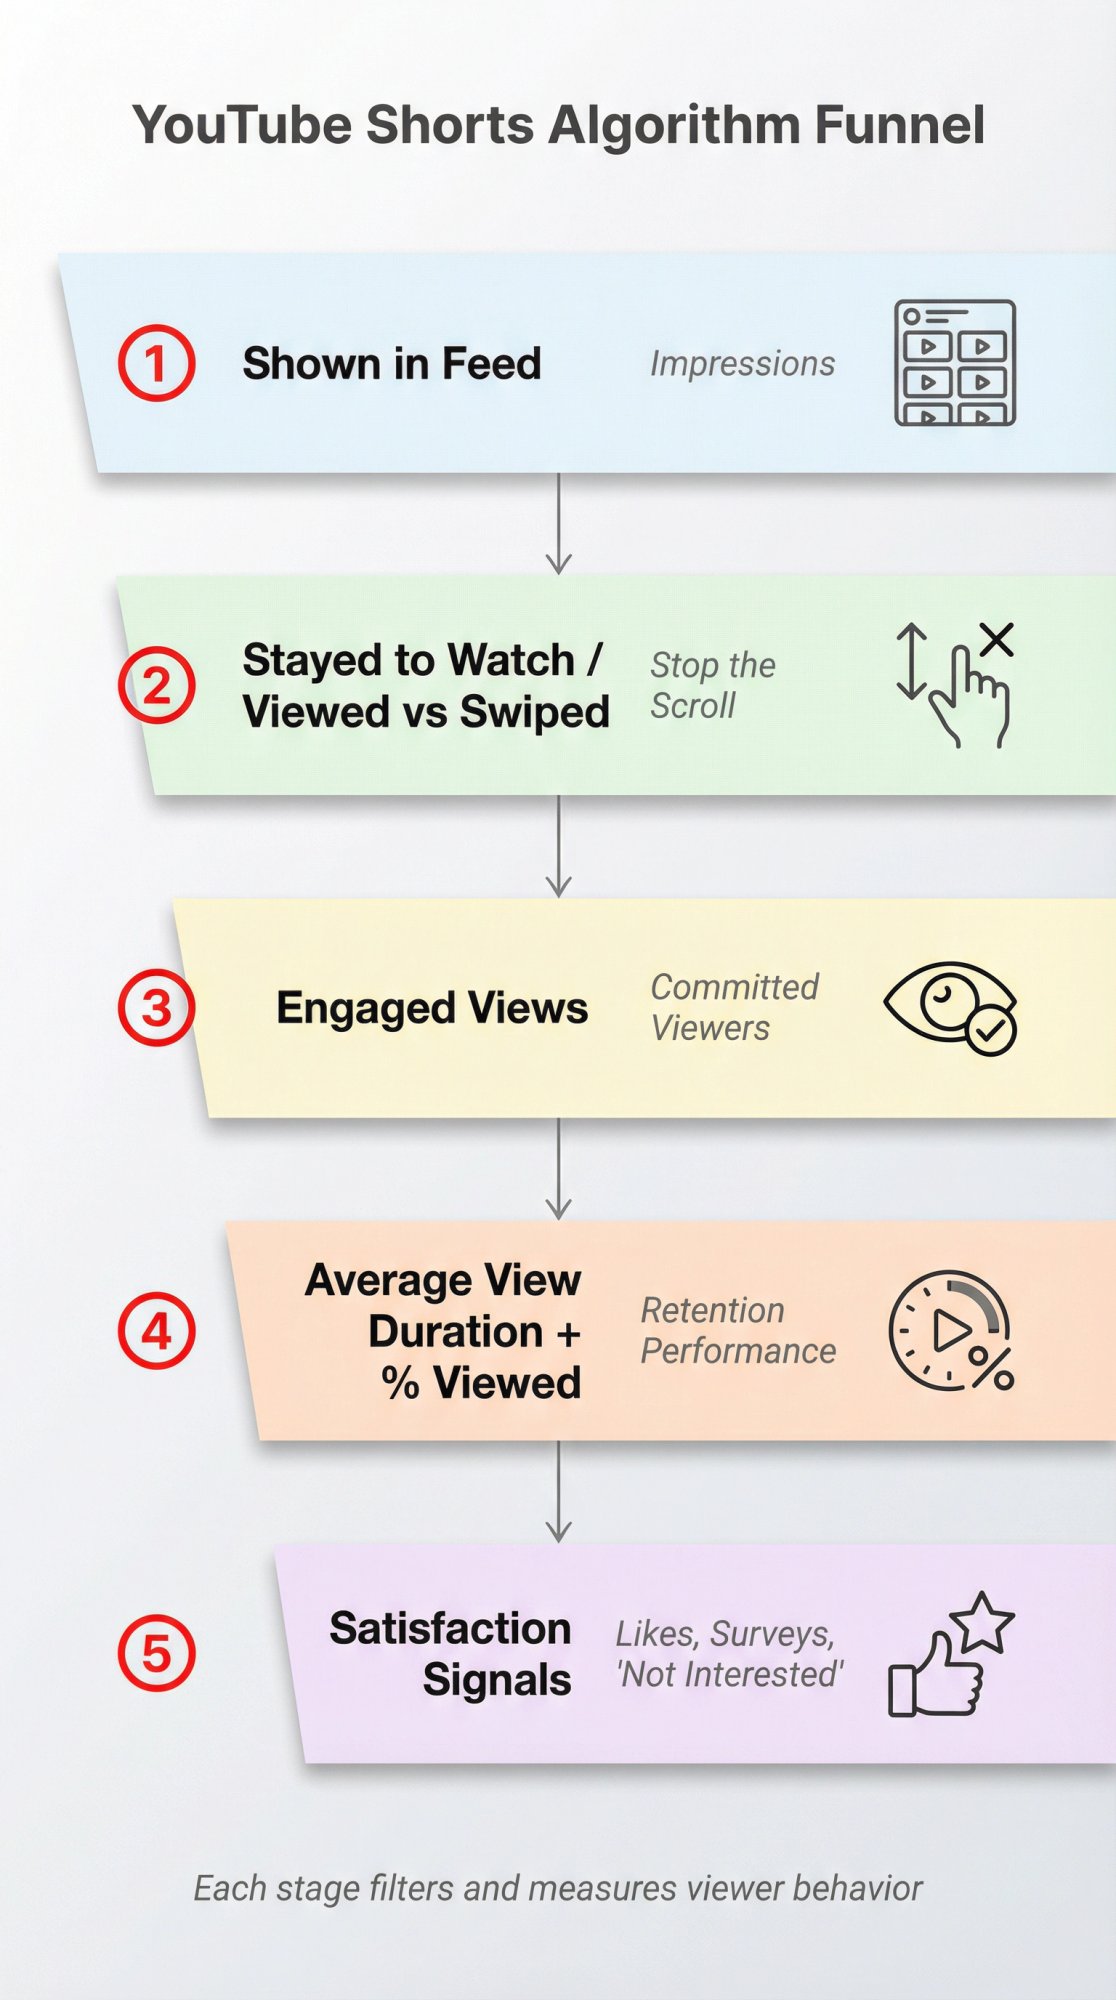
Think of Shorts as a funnel YouTube can measure extremely quickly:
① Shown in feed → how often your Short appeared (YouTube's metric)
② Stayed to watch / viewed vs swiped away → did you stop the scroll?
③ Engaged views → how many people "committed" beyond the initial seconds
④ Average view duration + average % viewed → did your pacing hold attention?
⑤ Satisfaction signals → likes/dislikes, "Not interested," and even post-watch survey feedback (yes, that exists)
YouTube's creator guidance explicitly says their systems look at whether viewers choose to watch or ignore (or hit "not interested"), then whether viewers stick around. They specifically mention average view duration and average % viewed as ranking signals, plus viewer enjoyment signals like likes/dislikes and surveys. Understanding how the YouTube Shorts algorithm works can help you optimize for these signals more effectively.
Why this matters:
If you only focus on APV but your Stayed to watch is weak, you can have "great retention" among the few who stayed and still get throttled in the feed.
Where to Find YouTube Shorts Retention in YouTube Studio
How to Find Retention for a Single Short
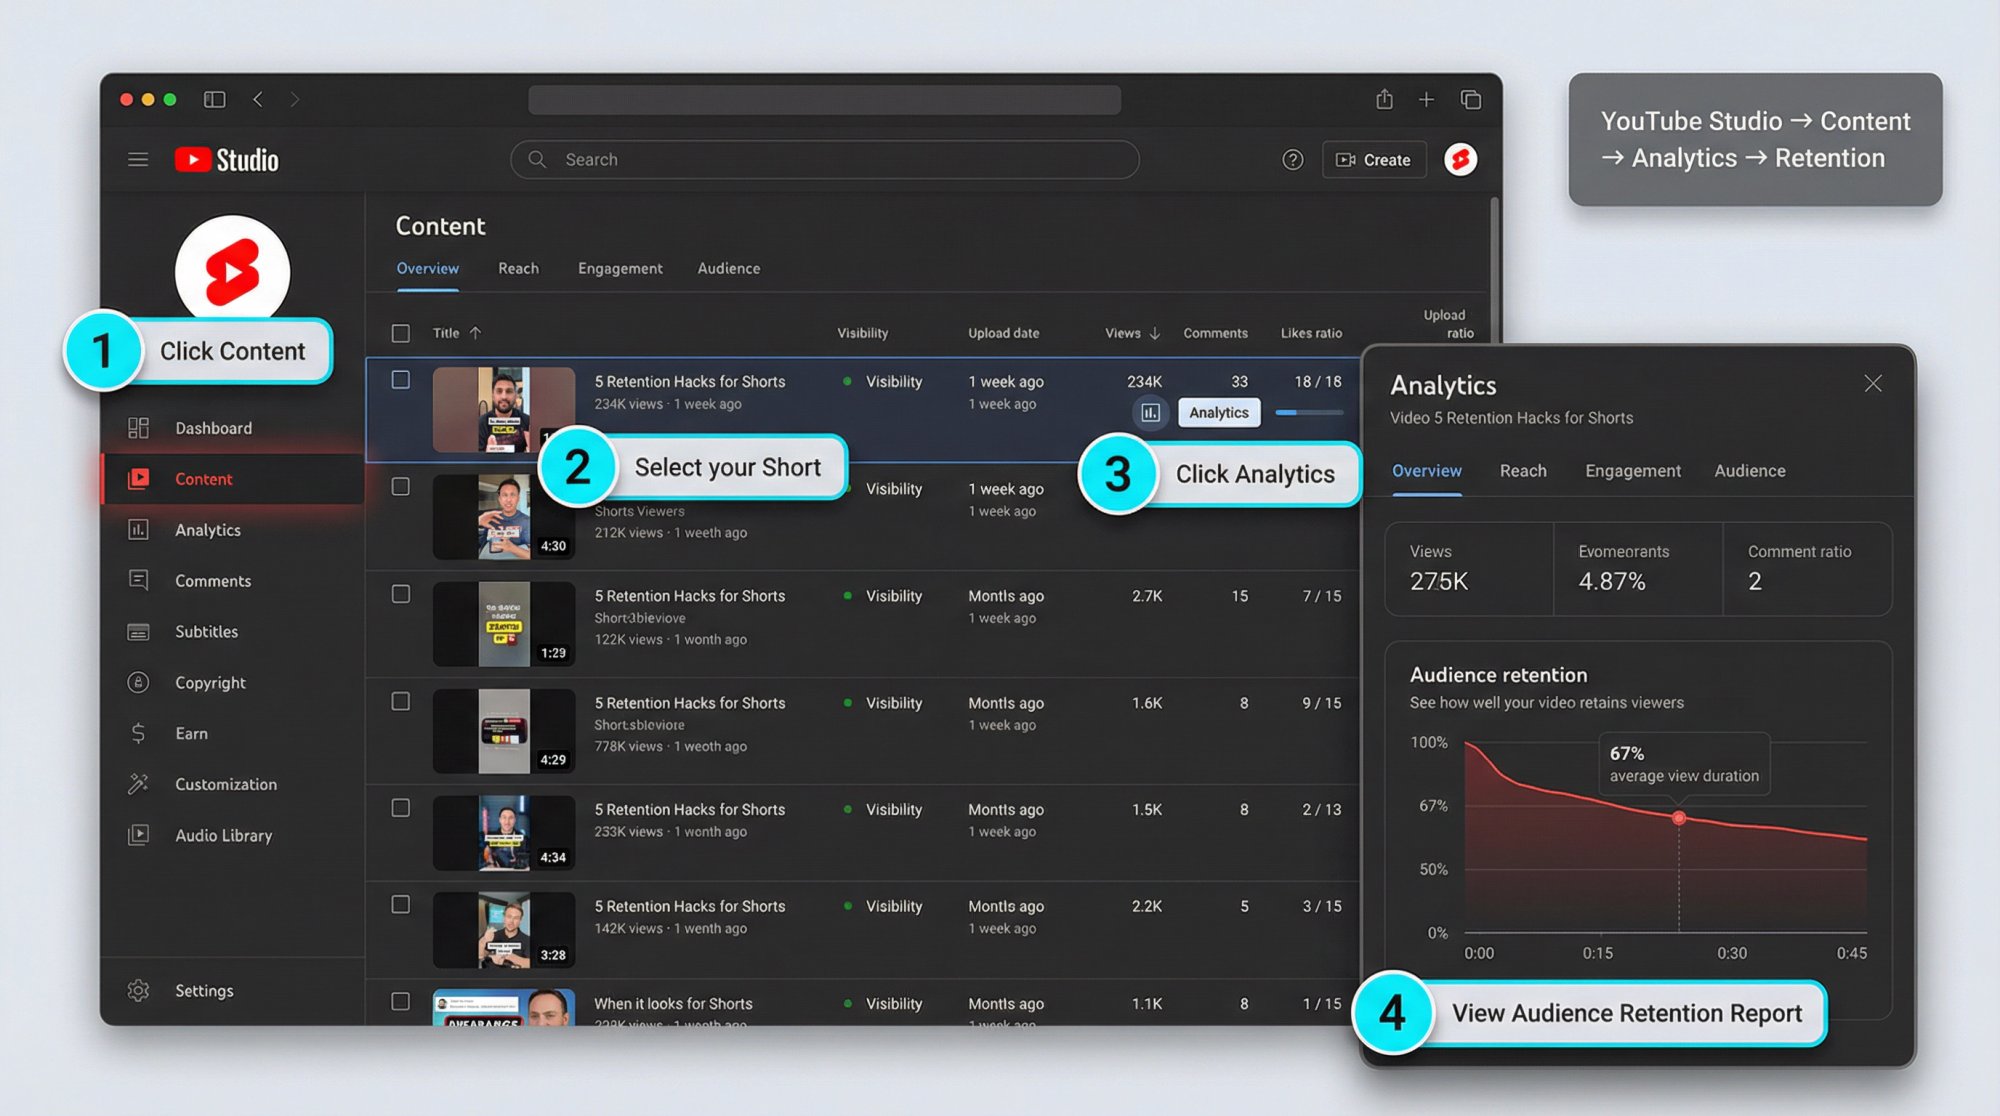
YouTube's retention report flow:
• Sign in to YouTube Studio
• Go to Content
• Select the video and click Analytics
• Check Overview or Engagement for the Audience retention report (click SEE MORE to compare against similar-length videos)
That same workflow applies when you're analyzing Shorts accounts from your Content list (filter to Shorts first).
Where to Find Shorts Scroll Metrics
In YouTube Studio Analytics, go to the Content tab, select the Shorts chip, and you'll see Shorts metrics like Shown in feed and How many chose to view (view vs swipe).
How Long Does It Take for Retention Data to Appear?
YouTube notes audience retention data typically takes 1–2 days to process and is available at the video level.
Also, "key moments" highlights (intros, spikes, dips) may require a minimum threshold. YouTube notes the video should be at least 60 seconds and have at least 100 views for certain highlights.
How to Calculate YouTube Shorts Retention Rate

The Basic Retention Math
If you're using Average Percentage Viewed (APV) as "retention rate":
Retention (APV) = (Average View Duration / Video Length) × 100
| Element | Example Value |
|---|---|
| Short length | 20s |
| Average view duration | 16s |
| APV | 80% (16 / 20) |
Why YouTube Shorts Retention Can Exceed 100%
Two things are happening:
① Shorts are designed to be rewatched (especially via loop-like behavior). Even if engaged views don't count loops as additional engaged views, watch time can still accumulate when viewers rewatch parts.
② YouTube explicitly notes that the absolute views for a segment can exceed your video's overall view count because "within a single view the same viewer may watch portions of your content multiple times."
Practical takeaway:
Don't panic when you see spikes/rewatches or oddly high "effective" retention. It often means you created a moment worth replaying (or a moment that confused viewers enough to rewind). The retention graph tells you which it is.
What Is a Good Retention Rate for YouTube Shorts?
Most articles try to give you a single benchmark number. That's rarely helpful, especially after the March 31, 2025 views change.
Here's what actually holds up:
Compare to Typical Retention for Similar-Length Videos
YouTube explicitly lets you compare retention against "all YouTube videos of similar length," and it also mentions using typical retention comparisons for your latest videos of similar length.
This is the closest thing to a trustworthy benchmark because it's contextual:
• A 12-second Short and a 2:45 Short shouldn't have the same APV expectation.
• Different niches behave differently (comedy loops, tutorials dip, etc.).
Understanding optimal video length sweet spots can help you set more realistic retention goals for different content types.
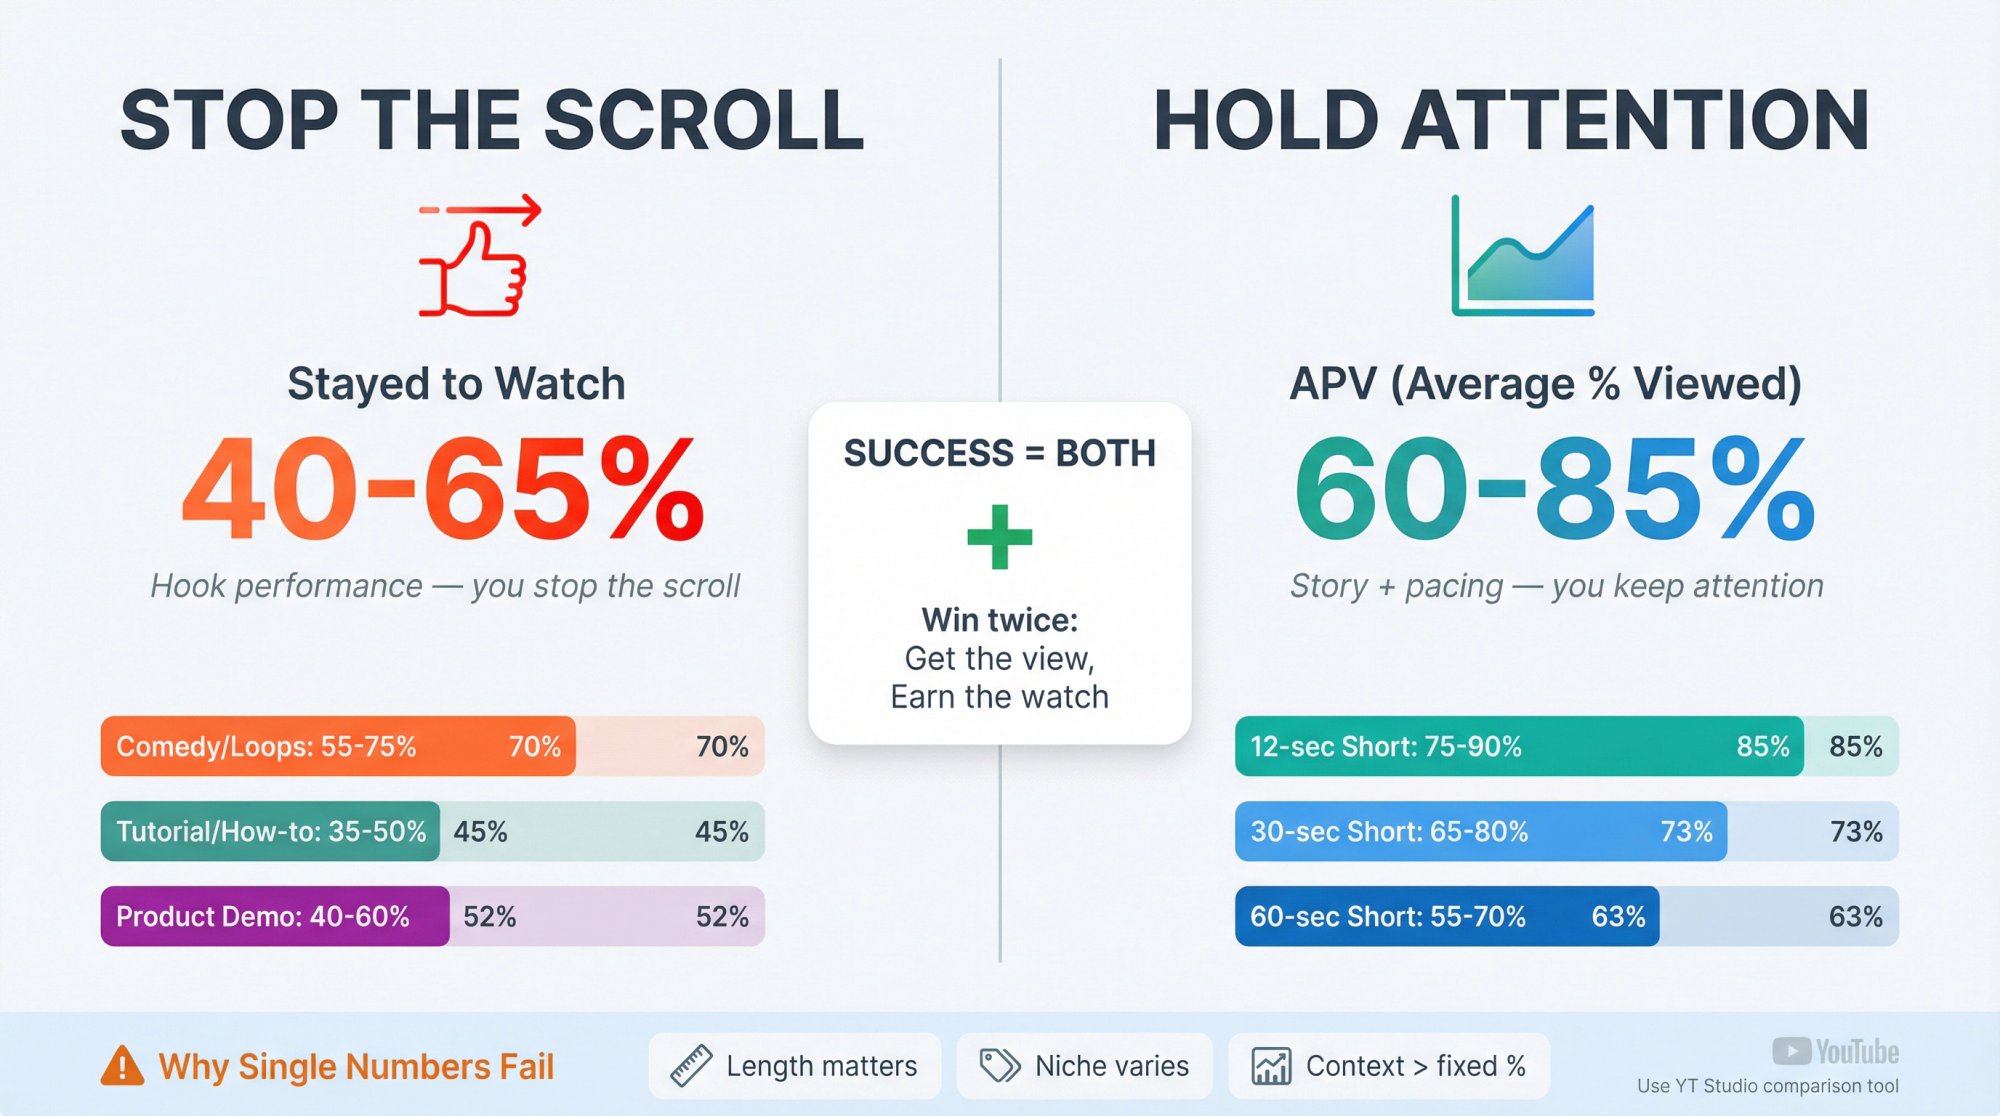
How to Judge Retention: Stop + Hold Performance
A "good retention rate" for Shorts isn't one metric. It's the combination:
| Metric | What It Measures |
|---|---|
| Stayed to watch | Hook performance (you stop the scroll) |
| APV / AVD | Story + pacing performance (you keep attention) |
If you want a single sentence to operate by:
A great Short wins twice: it gets the view (stop), then it earns the watch (hold).
Why Relative Watch Time Matters More for Short Videos
YouTube's own guidance notes that, broadly, relative watch time is more important for short videos and absolute watch time is more important for longer videos.
Translation for Shorts:
Percent watched (APV) and the retention curve shape matter a lot.
How to Diagnose YouTube Shorts Retention Problems
Use this diagnostic like a decision tree. It'll save you months.
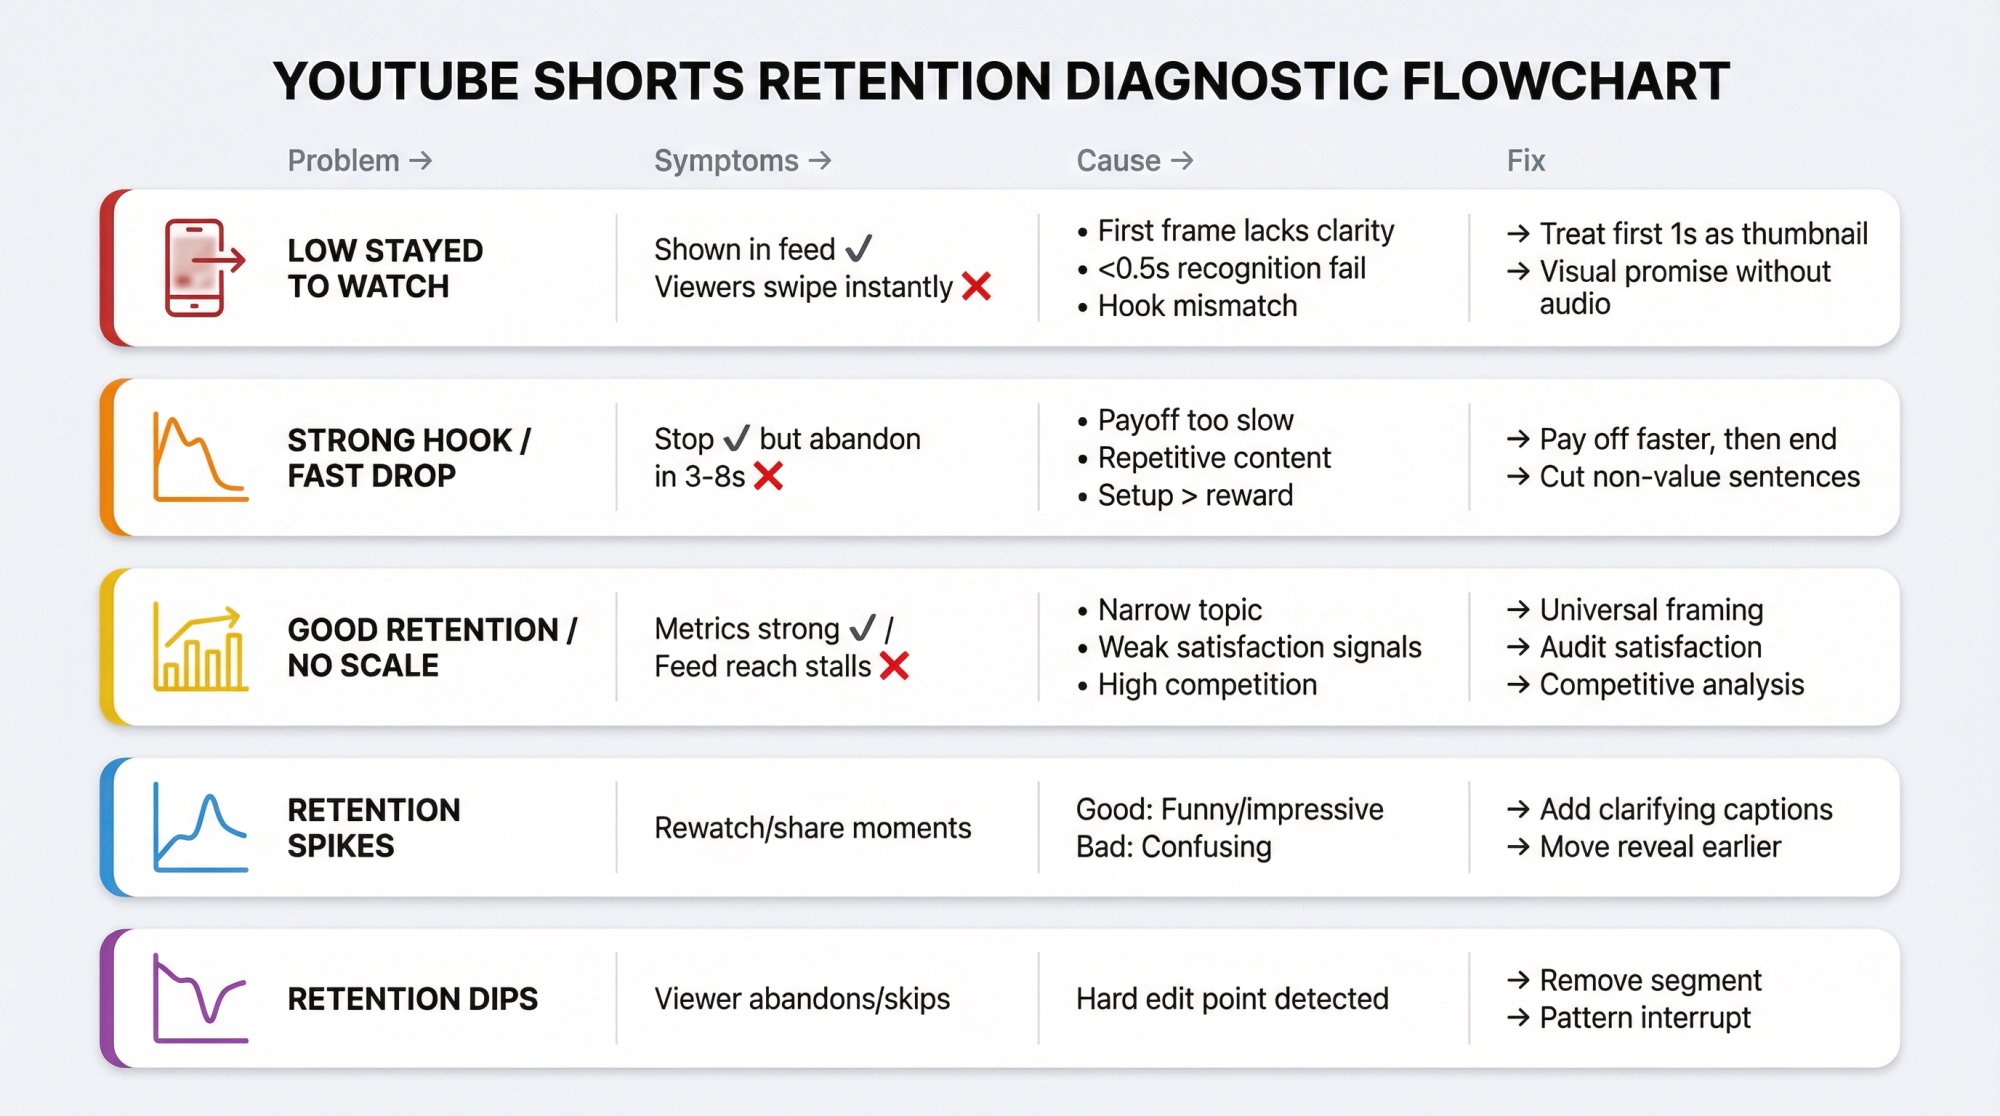
Low "Stayed to Watch" (Viewers Swipe Instantly)
Symptoms
Shown in feed is decent, but viewers swipe instantly.
Cause (usually)
• First frame doesn't create curiosity or clarity.
• Viewer can't tell what's happening in <0.5 seconds.
• Hook promises something the opening doesn't deliver (so they bail).
Fix
• Treat the first 1 second as your thumbnail.
• Make the promise visually obvious without audio.
Strong "Stayed to Watch" But APV/AVD Drops Fast
Symptoms
People "stop" but abandon in the first 3–8 seconds.
Cause (usually)
• Hook is good, but the payoff takes too long.
• The video repeats itself.
• The setup is bigger than the reward.
Fix
• Pay off faster, then end. Shorts aren't long-form. Don't "build" for 20 seconds if the payoff is 2 seconds.
• Cut every sentence that isn't value.
Good Retention But Distribution Stalls
Symptoms
Your metrics look strong, yet "Shown in feed" doesn't scale.
Cause (usually)
• Topic is too narrow or demand is low.
• Satisfaction is weak (likes/dislikes, "Not interested," surveys).
• Competition: other Shorts in the niche are outperforming at that moment.
Fix
• Change packaging inside the video: clearer promise, more universal framing, stronger "why should I care?"
• Audit satisfaction: if comments are negative or confused, retention alone won't save it.
• Use competitive analysis tools to understand what's working in your niche right now.
What Do Spikes in the Retention Graph Mean?
YouTube explains spikes appear when viewers are rewatching or sharing those parts.
Interpretation
Good spike: replay because it's funny, impressive, or surprising.
Bad spike: replay because it's confusing.
Fix
• If spike happens right after a key line, add an on-screen caption that clarifies.
• If spike happens on a visual reveal, consider moving that reveal earlier.
What Do Dips at Specific Timestamps Mean?
YouTube describes dips as moments viewers abandon or skip.
Fix
That timestamp isn't "a small issue." It's a hard edit point. Remove that segment or replace it with a pattern interrupt.
27 Proven Ways to Improve YouTube Shorts Retention
Below is what we see working across high-performing short-form formats. Not theory. These are the levers you can actually pull.
How to Stop the Scroll (First 1.5 Seconds)
This affects viewed vs swiped away / "how many chose to view".
① Show the result first, then explain.
② Use a pattern break: unusual framing, motion, or contradiction ("This is why your hook is failing…").
③ Make the topic legible on mute with 3–6 words of on-screen text.
④ Avoid slow intros: no greetings, no context dumps.
⑤ Start mid-action ("Watch what happens when…").
⑥ Remove ambiguity: if someone can't categorize your Short instantly, they swipe.
How to Hold Attention Through the Middle
YouTube uses average view duration and average % viewed as ranking signals.
⑦ Cut the setup in half. Then cut it again.
⑧ Every 1–2 seconds, change something: shot size, overlay, angle, pace, visual.
⑨ Use "micro open loops" every 5–8 seconds: "but here's the twist…"
⑩ Add proof early (screenshot, demo, before/after).
⑪ Remove repeated words (Shorts die from redundancy).
⑫ Use captions that match pace (fast captions for fast videos; don't lag).
⑬ One idea per Short (if it needs multiple steps, make it a series).
⑭ Make it obvious what to watch for ("Look at the top-left…")
⑮ Trim pauses to zero (silence feels like an exit ramp).
How to Engineer the Ending for Rewatches
⑯ End exactly at the payoff. Don't linger.
⑰ Loop with intention: the last frame should connect seamlessly to the first conceptually (not necessarily literally).
⑱ Use a callback line that makes the first second more meaningful on rewatch.
⑲ Avoid long CTAs (on Shorts, a 3-second CTA can be 10% of your runtime).
Understanding the best times to post YouTube Shorts can also help maximize your initial engagement window and retention.
How to Protect Satisfaction Signals
YouTube explicitly cares about long-term viewer satisfaction and uses feedback signals.
⑳ Don't bait-and-switch. Match hook promise to payoff.
㉑ Deliver value faster than expected.
㉒ Make the viewer feel smart (clear, structured, not chaotic).
㉓ Avoid "fake loops" that waste time without delivering.
㉔ Optimize for repeat viewing, not rage. Rage can spike views and kill distribution later.
YouTube Shorts Format Rules That Affect Retention
㉕ Shorts can be up to 3 minutes, but classification and monetization rules vary by upload date and channel type.
㉖ Any Short over one minute with an active Content ID claim can be blocked globally (not playable/recommended/monetizable).
㉗ Remember: views and engaged views are different post–March 31, 2025. Use the right metric for the right question.
14-Day Plan to Improve YouTube Shorts Retention
If you don't systematize retention improvement, you'll end up "trying random things." Here's a tight plan:
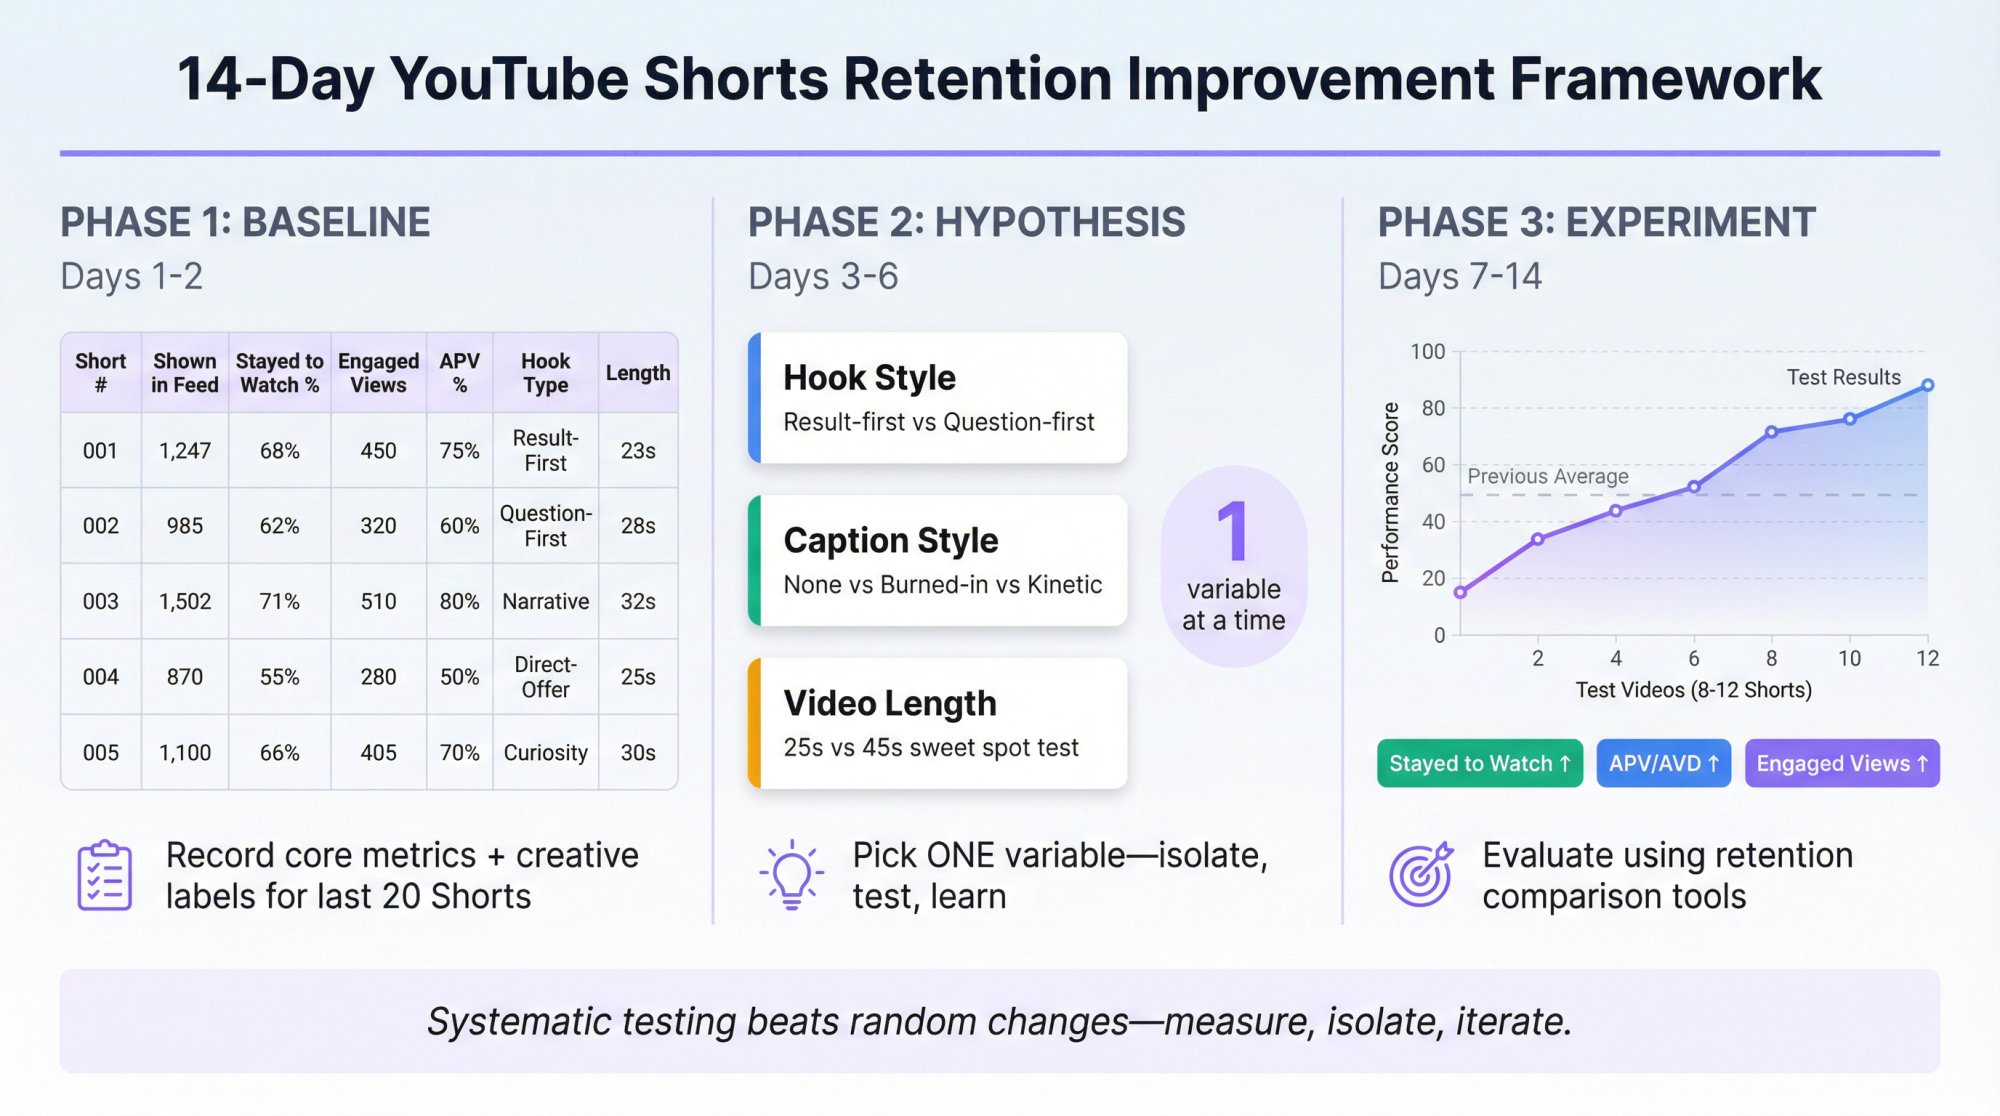
Day 1–2: Baseline Your Last 20 Shorts
For each Short, record:
Core metrics:
• Shown in feed
• Stayed to watch (viewed vs swiped away)
• Engaged views
• APV + AVD
Creative labels:
Then label each Short with:
• Hook type (question / shock / result-first / contrarian / story)
• Format (talking head / screen recording / montage / captions-only)
• Length bucket (≤15s / 16–30s / 31–45s / 46–60s / 61–180s)
Tracking your video performance systematically makes this baseline analysis much easier, especially if you're managing multiple accounts or creators.
Day 3–6: Pick One Variable to Test
Examples:
• Hook style (result-first vs question-first)
• Caption style (none vs burned-in vs kinetic captions)
• Length (25s vs 45s)
Don't change everything at once. If you do, you can't learn.
This is where A/B testing for YouTube Shorts becomes valuable, testing one variable at a time with proper measurement.
Day 7–14: Run Controlled Tests with 8–12 Shorts
Evaluate using:
• Stayed to watch (hook success)
• APV/AVD (hold success)
• Engaged views (the comparable "quality view" number)
Use YouTube's retention comparison tools (SEE MORE / similar-length comparisons) to judge performance fairly.
How Shortimize Helps You Win Retention (Without Seeing Competitor Data)
Here's the uncomfortable truth:
Your own Shorts retention data is private inside YouTube Studio.
Your competitors' retention data is not visible to you.
So how do the best growth teams still "solve retention" competitively?
They use a two-layer system:
Layer 1: YouTube Studio (Your Private Retention Data)
You get the exact retention curve, APV, AVD, and view-vs-swipe signals.
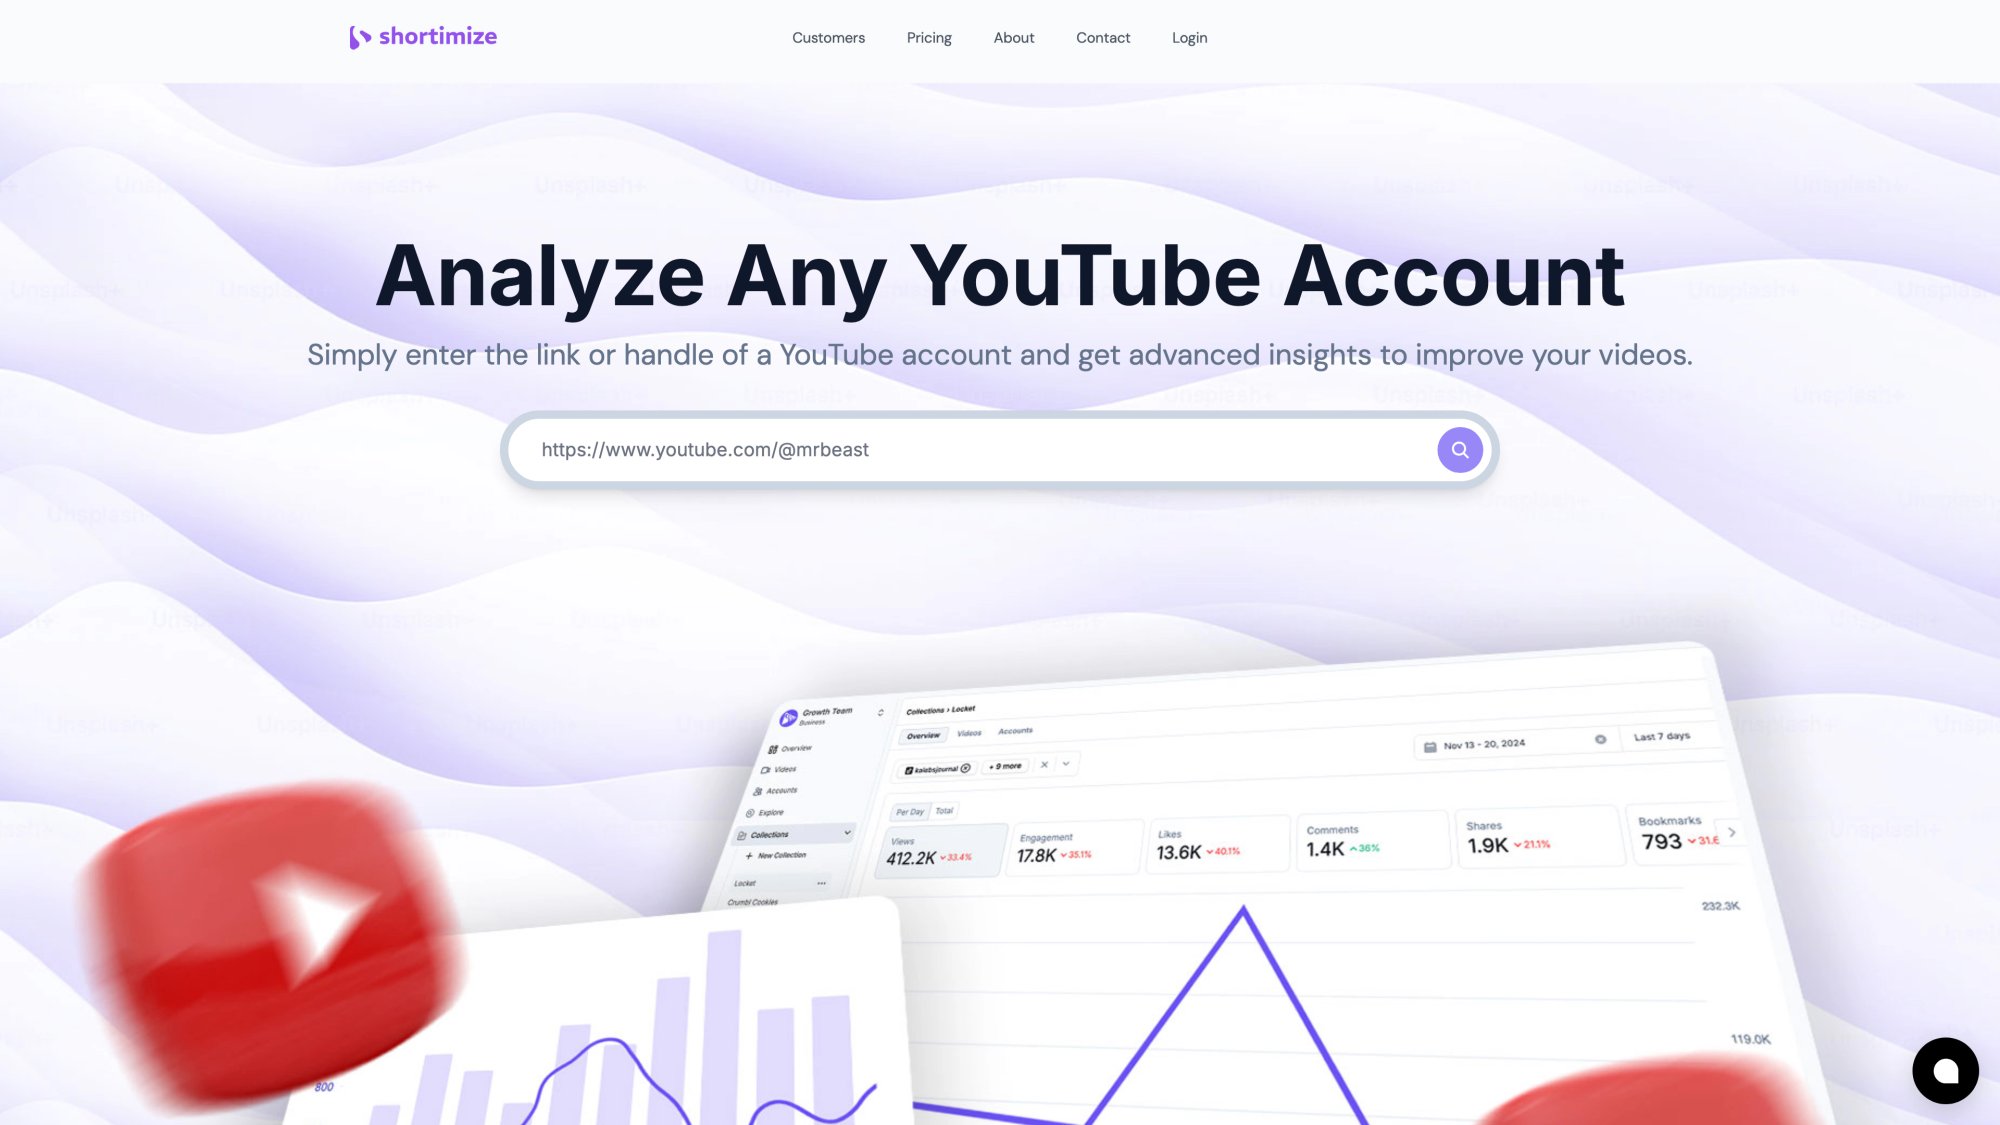
Layer 2: Shortimize (Public Performance Patterns)
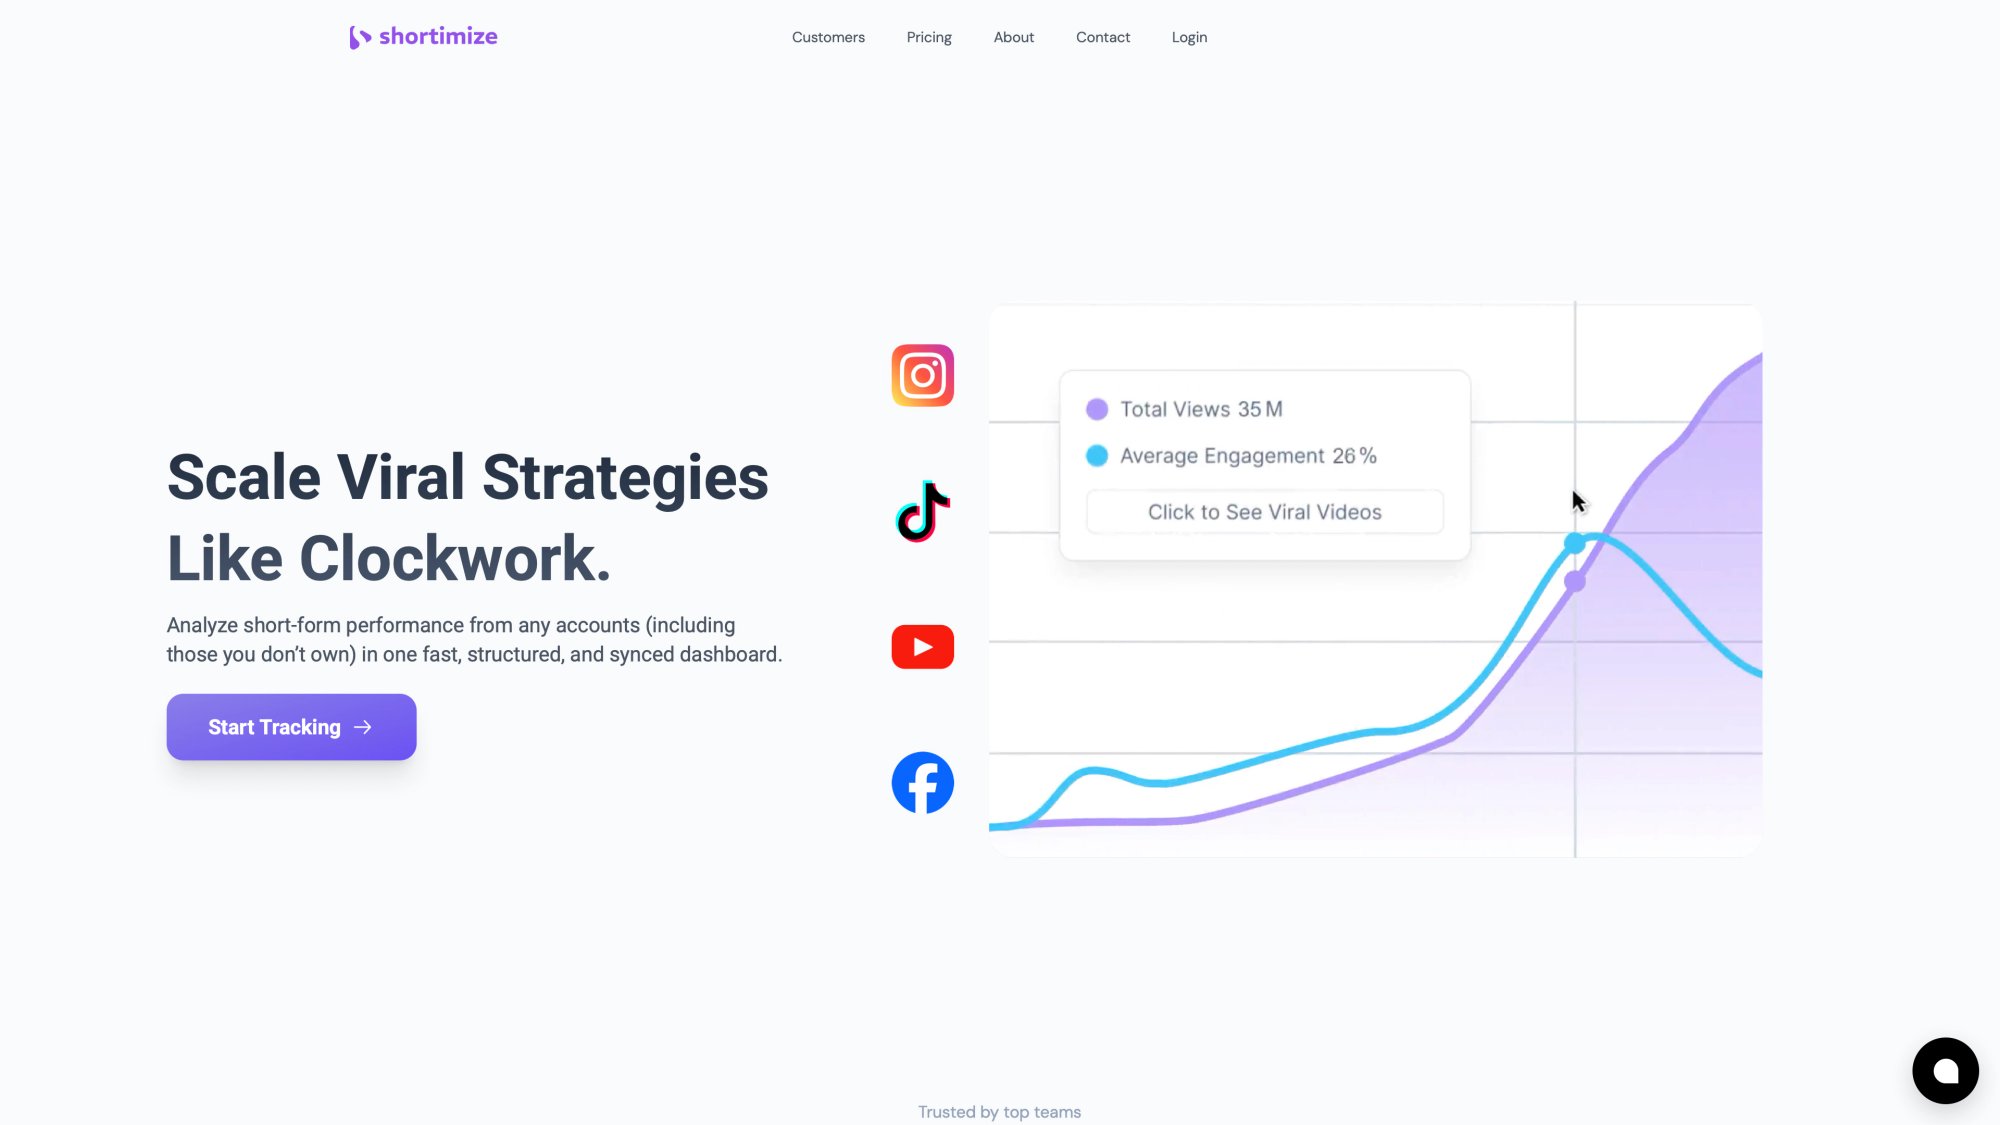
Shortimize lets you analyze any public YouTube account by URL/handle and pull every video with exportable tables, posting schedules, and insights like which video lengths drive the most views.
That enables a powerful workflow:
The "Retention Reverse-Engineering Loop"
① Identify your top-retention Shorts in YouTube Studio (your internal winners).
② Extract the creative pattern: hook type, pacing style, length, ending style.
③ Use Shortimize to find public performance outliers on competitor channels (high view velocity, repeatable formats, length distributions).
④ Combine both into a template library:
• "Result-first demo (18–28s)"
• "Contrarian myth-bust (25–40s)"
• "List + rapid captions (12–20s)"
⑤ Run controlled experiments (Section 8) and iterate.
Shortimize also supports organizing accounts into collections and analyzing multiple accounts at scale, which is useful if you manage multiple creators or client portfolios.
Why cross-platform comparison matters:
Many retention principles work across Shorts, Reels, and TikTok. Comparing watch time across platforms helps you identify universal patterns versus platform-specific quirks.
Suggested resources:
• Shortimize's guide to analyzing Shorts performance (useful if you want a structured measurement system)
• Deep-dive on analyzing YouTube Shorts accounts (for competitive patterns)
• Understanding the Shorts algorithm (for optimization strategies)
Frequently Asked Questions
What's the Most Important Retention Metric for YouTube Shorts?
There isn't one. You need:
• Stayed to watch / viewed vs swiped away (hook)
• Average view duration + average % viewed (hold)
And you should track engaged views for clean performance comparisons after the March 31, 2025 change.
Did YouTube Change How Shorts Views Are Counted?
Yes. As of March 31, 2025, a Shorts view counts when a Short starts to play or replay with no minimum watch time requirement, and engaged views remain available (and used for YPP eligibility + Shorts revenue sharing).
Can YouTube Shorts Retention Exceed 100%?
It can in practice when viewers rewatch parts. YouTube notes segment views can exceed overall views because viewers may watch portions multiple times within a single view.
Where Do I Find the YouTube Shorts Retention Graph?
In YouTube Studio: Content → select the video → Analytics → Overview or Engagement → Audience retention report (SEE MORE for deeper comparisons).
Does YouTube's Algorithm Actually Use Retention for Recommendations?
Yes. YouTube's creator guidance explicitly says their systems use avg. view duration and avg. % viewed as signals and also consider satisfaction signals like likes/dislikes and post-watch surveys.
How to Benchmark YouTube Shorts Performance Against Competitors
You can't see competitors' private retention data, but you can use Shortimize's YouTube Shorts analysis tools to track their public performance metrics, posting patterns, and video lengths, then reverse-engineer what's working.
Final Takeaway: Retention Is a System, Not a Number
If you remember only one thing:
Shorts growth happens when you improve the entire retention funnel:
Shown in feed → stop the swipe → hold attention → satisfy the viewer.
And in 2026 specifically, make sure you're using the right metrics after the Shorts view-count change:
• Use Stayed to watch to measure your hook.
• Use APV/AVD + the retention graph to measure your pacing.
• Use Engaged views as your stable "quality view" metric for comparisons and monetization-relevant performance.
Ready to optimize your Shorts retention systematically? Start your free 7-day trial and get access to cross-platform analytics, competitive insights, and the tools growth teams use to reverse-engineer viral patterns.