Influencer marketing isn't experimental anymore. It's a core channel, with U.S. creator ad spend projected to hit $37 billion in 2025 (up 26% year-over-year according to the IAB's 2025 report). We're talking about a $32+ billion global industry where 57% of brands run campaigns on Instagram and 52% on TikTok.
The uncomfortable truth? Measurement is still completely broken.
According to industry research, 79% of marketers cite measurement as their top challenge. Platforms define engagement differently. Agencies report inconsistently. And every few months, the rules change. Case in point: YouTube Shorts completely changed how it counts "views" on March 31, 2025. Now views count any time a short starts or replays, with no minimum watch time. The old metric still exists as "engaged views" in YouTube Analytics.
So if your measurement system is basically "ask for screenshots and compare view counts," you're not measuring success. You're collecting vibes.
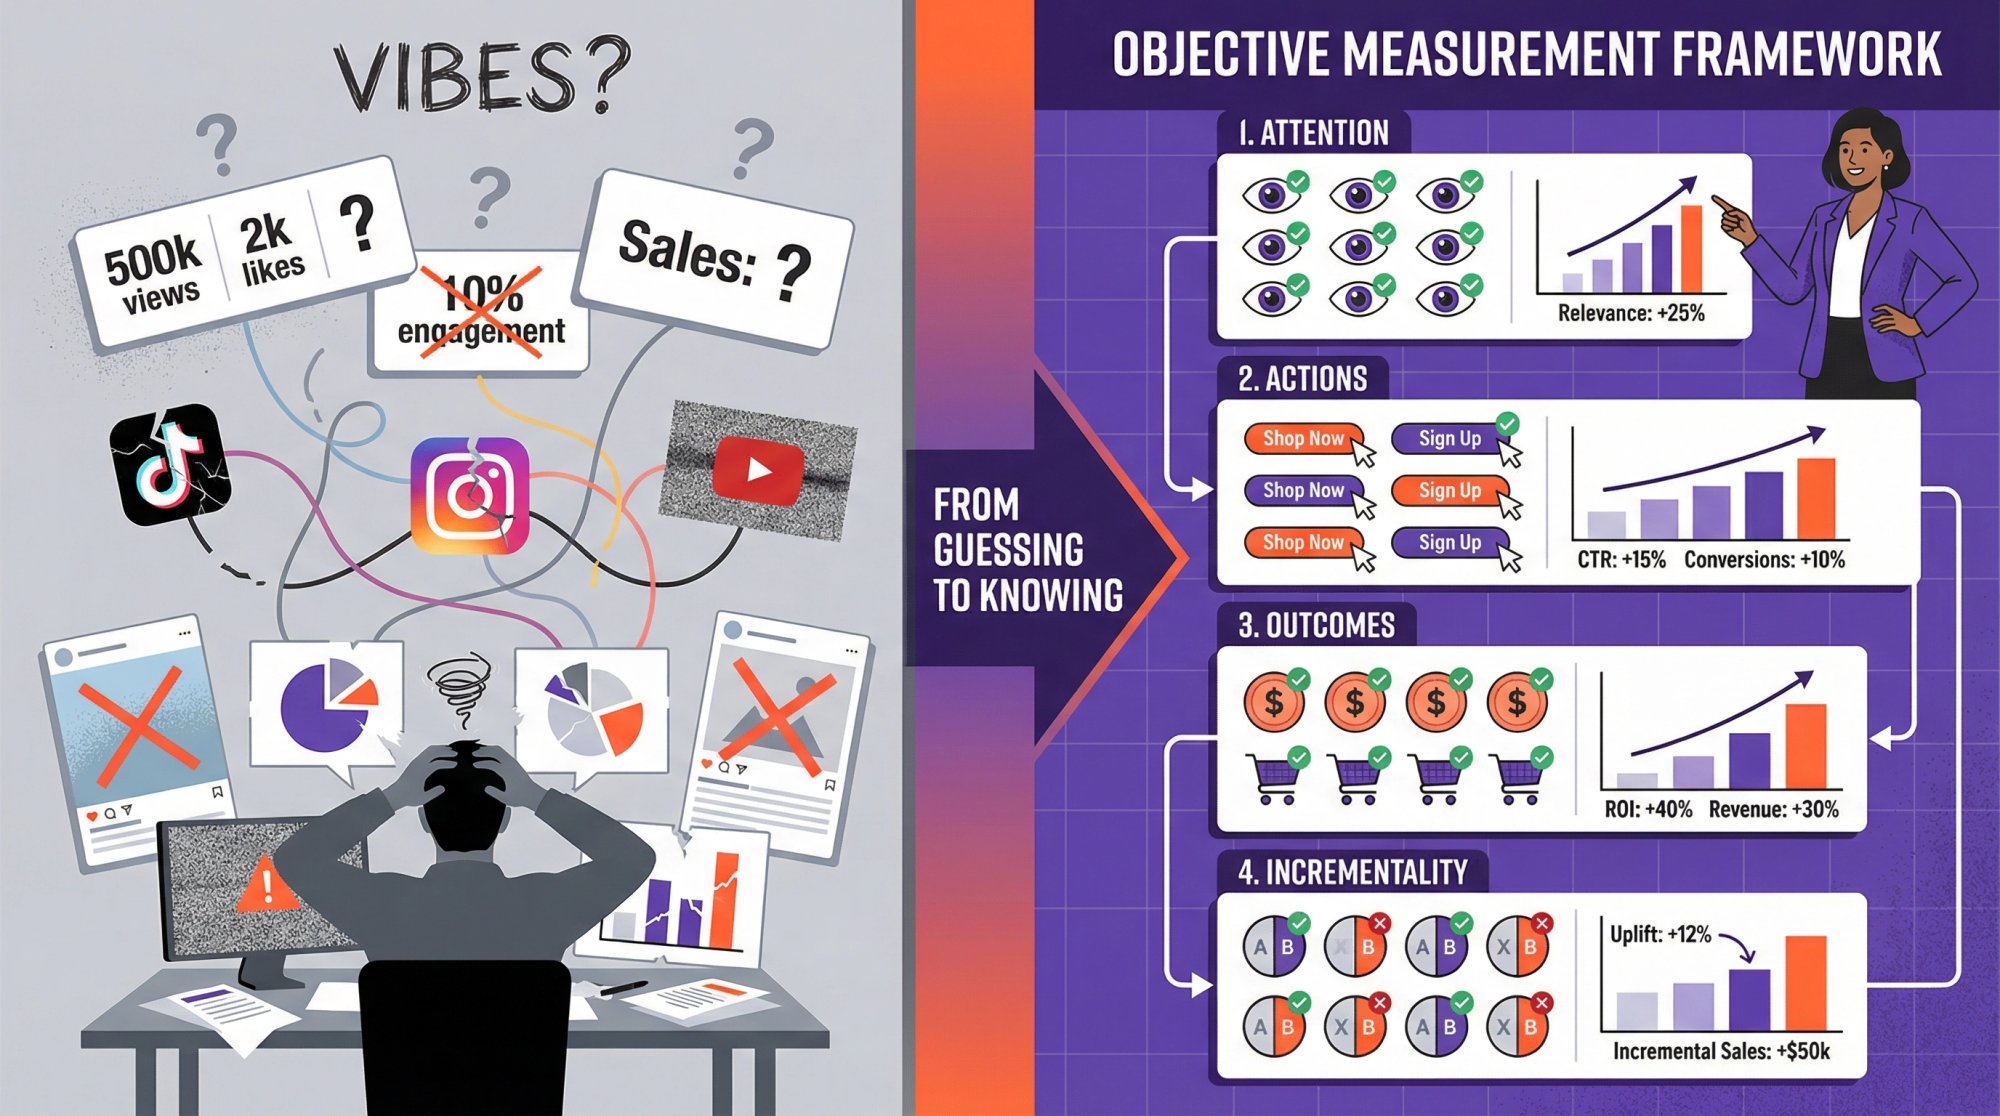
This guide gives you a real measurement framework: attention, then actions, then outcomes, then incrementality. Plus a scorecard you can copy/paste to decide who to rebook, who to scale with paid amplification, and who to cut.
What does influencer success actually mean?
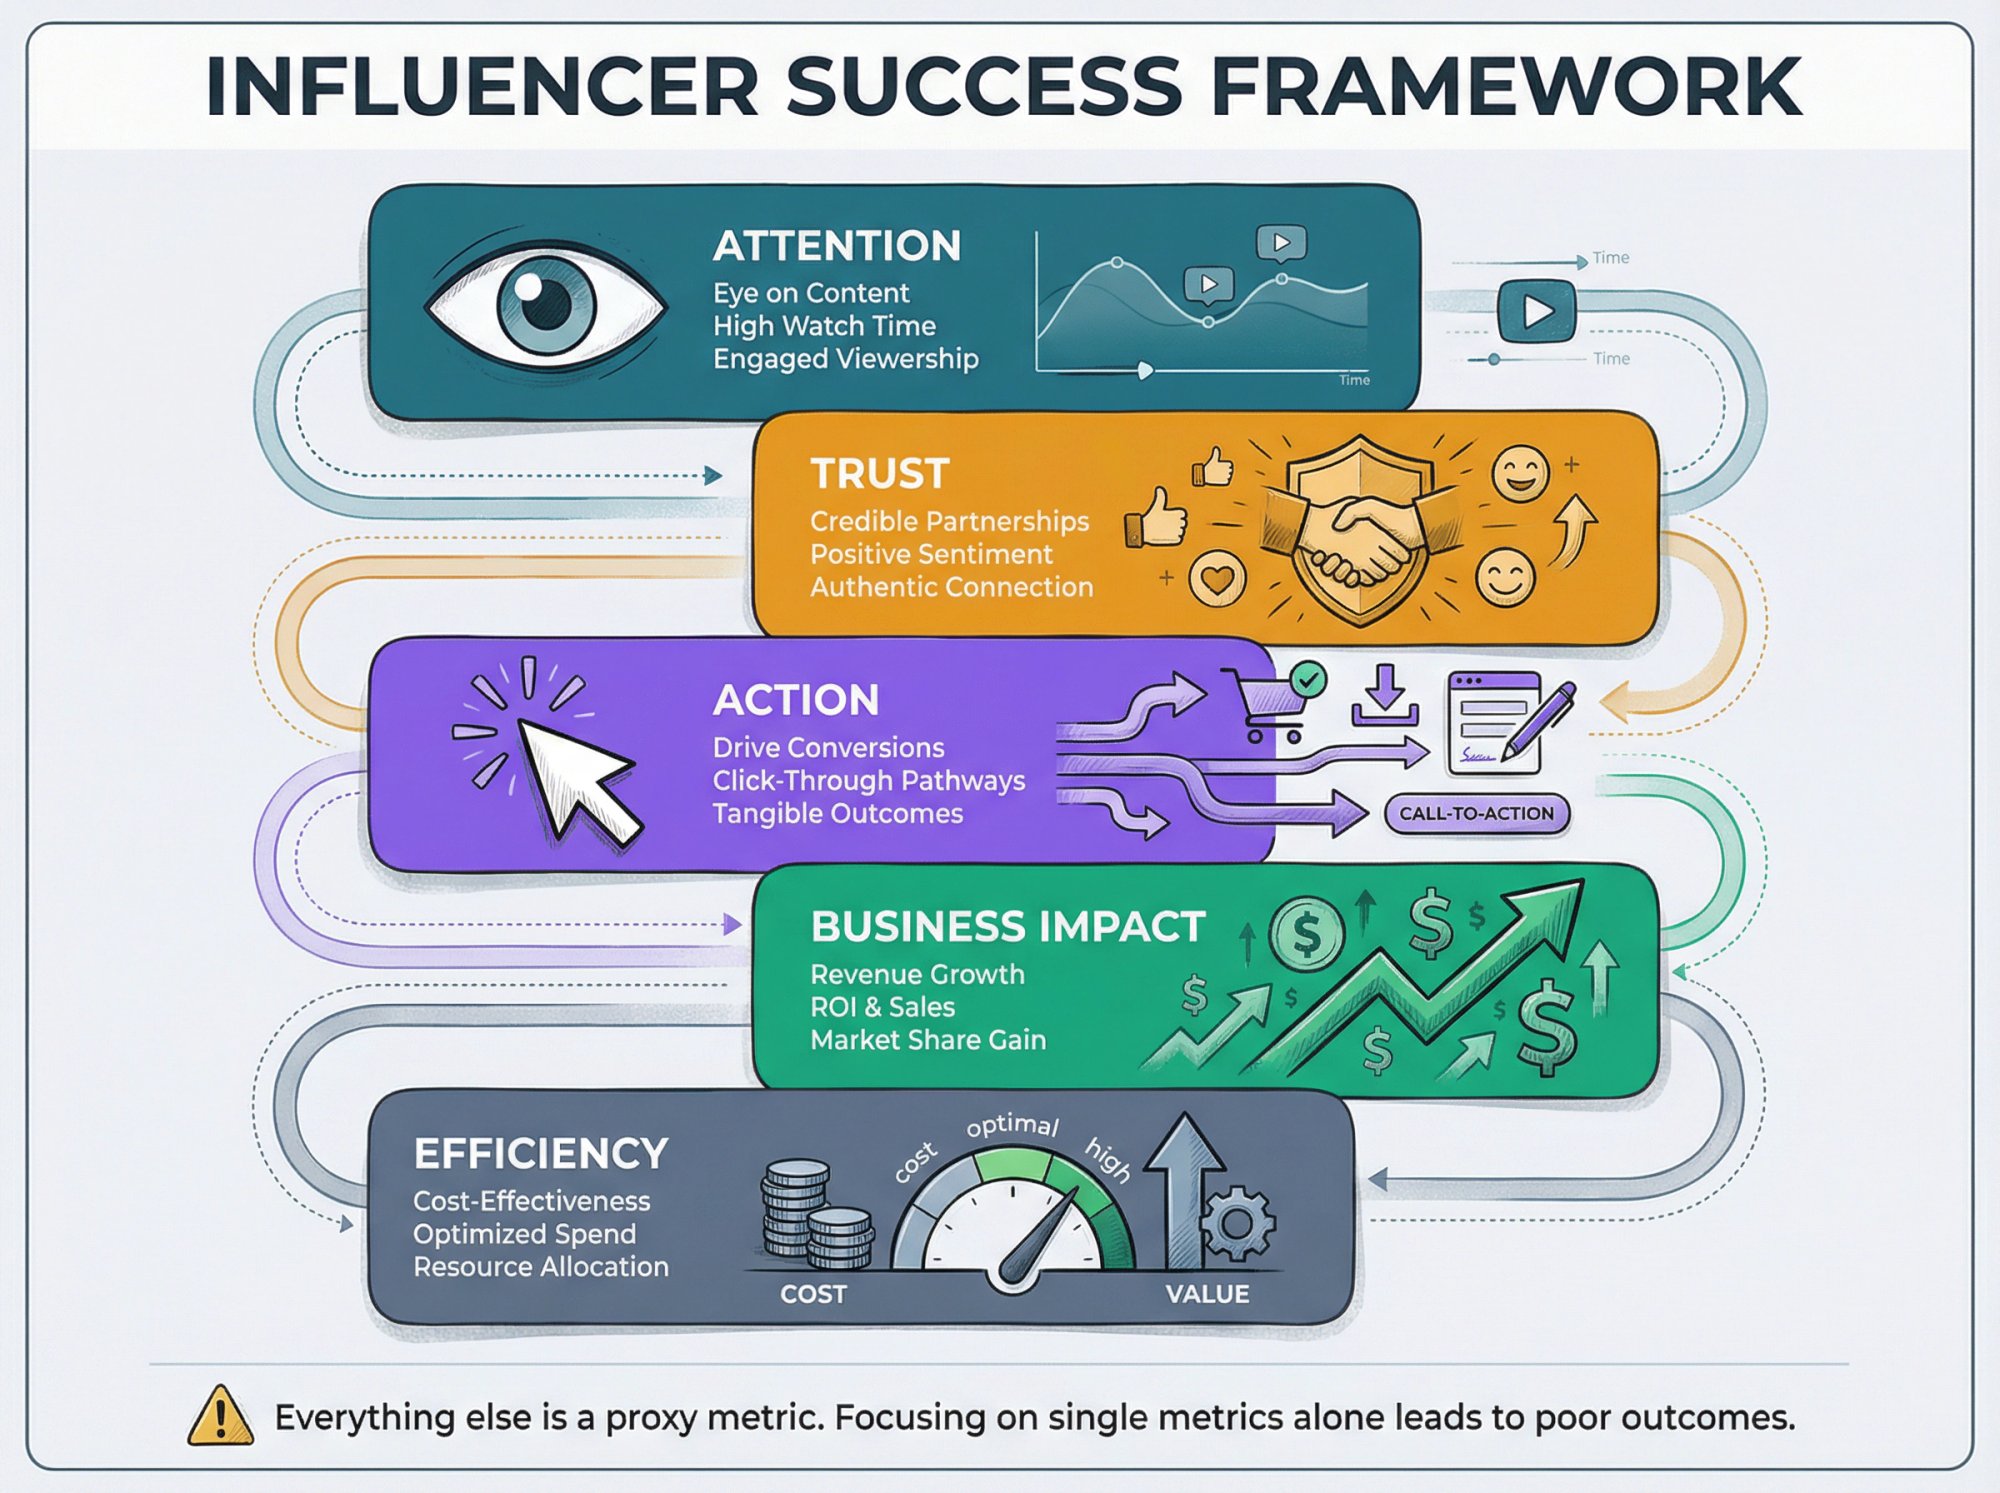
Influencer success isn't a single number. It's a collection of signals that answer different questions:
Attention: Did real humans actually watch? Not just scroll past.
Trust: Did the content create positive intent, or just noise and objections?
Action: Did people click through, search your brand, install your app, add to cart?
Business Impact: Did you create incremental revenue, profit, or retained users that wouldn't have existed otherwise?
Efficiency: Did you get that impact at a cost that beats your alternatives?
Everything else is a proxy metric. You can optimize proxies all day and still lose money.
How to measure influencer marketing in 3 layers
If you skip a layer, you either can't prove value or you optimize the wrong thing. Think of measurement in three layers:
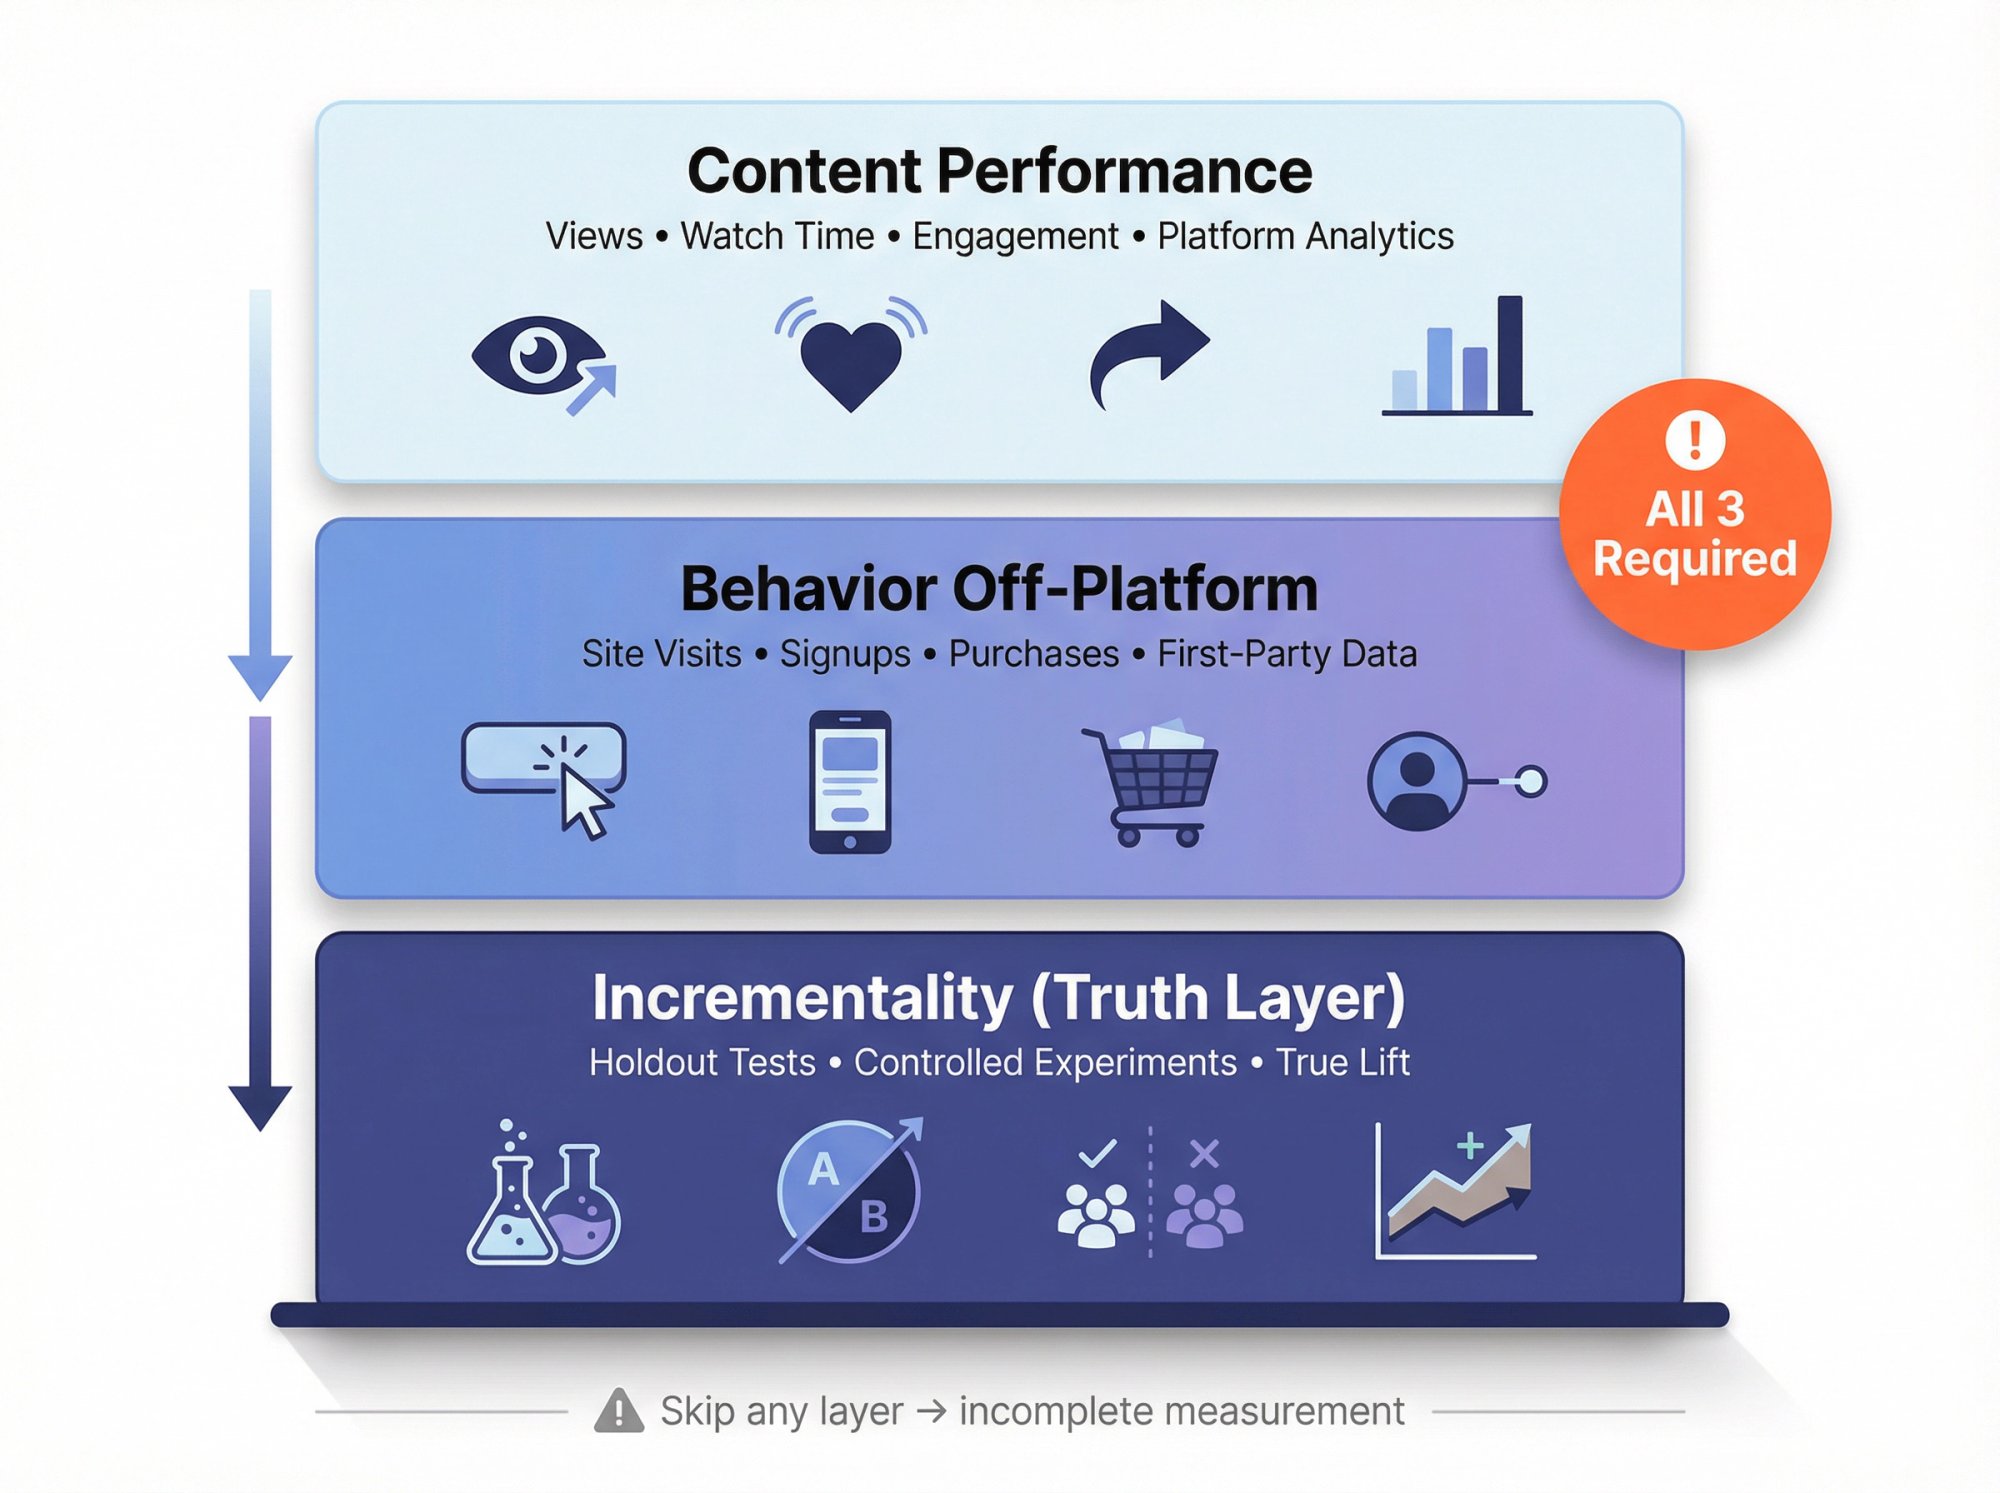
Layer 1: Content performance (public + platform analytics)
What happened on-platform. Views, watch time, engagement, shares, saves, audience demographics. This is where platform analytics live (TikTok Analytics, Instagram Insights, YouTube Studio).
Shortimize automates the collection of these public metrics across TikTok, Instagram Reels, and YouTube Shorts so you don't have to manually scrape data or chase creators for screenshots.
Layer 2: Behavior off-platform (first-party data)
What people did after exposure. Site sessions, app installs, signups, purchases, retention cohorts. This requires your own tracking infrastructure (UTMs, events, attribution).
Layer 3: Incrementality (the truth layer)
How much of Layer 2 would have happened anyway. This is where geo holdouts, audience holdouts, and controlled experiments live.
Critical insight: Attribution tells a story. Incrementality tells the truth.
Attribution says "these 500 conversions came through this creator's link." Incrementality says "300 of those would have bought anyway, so you actually created 200 new customers." That distinction is the difference between profitable scaling and wasting budget on demand harvesting that would've happened anyway.
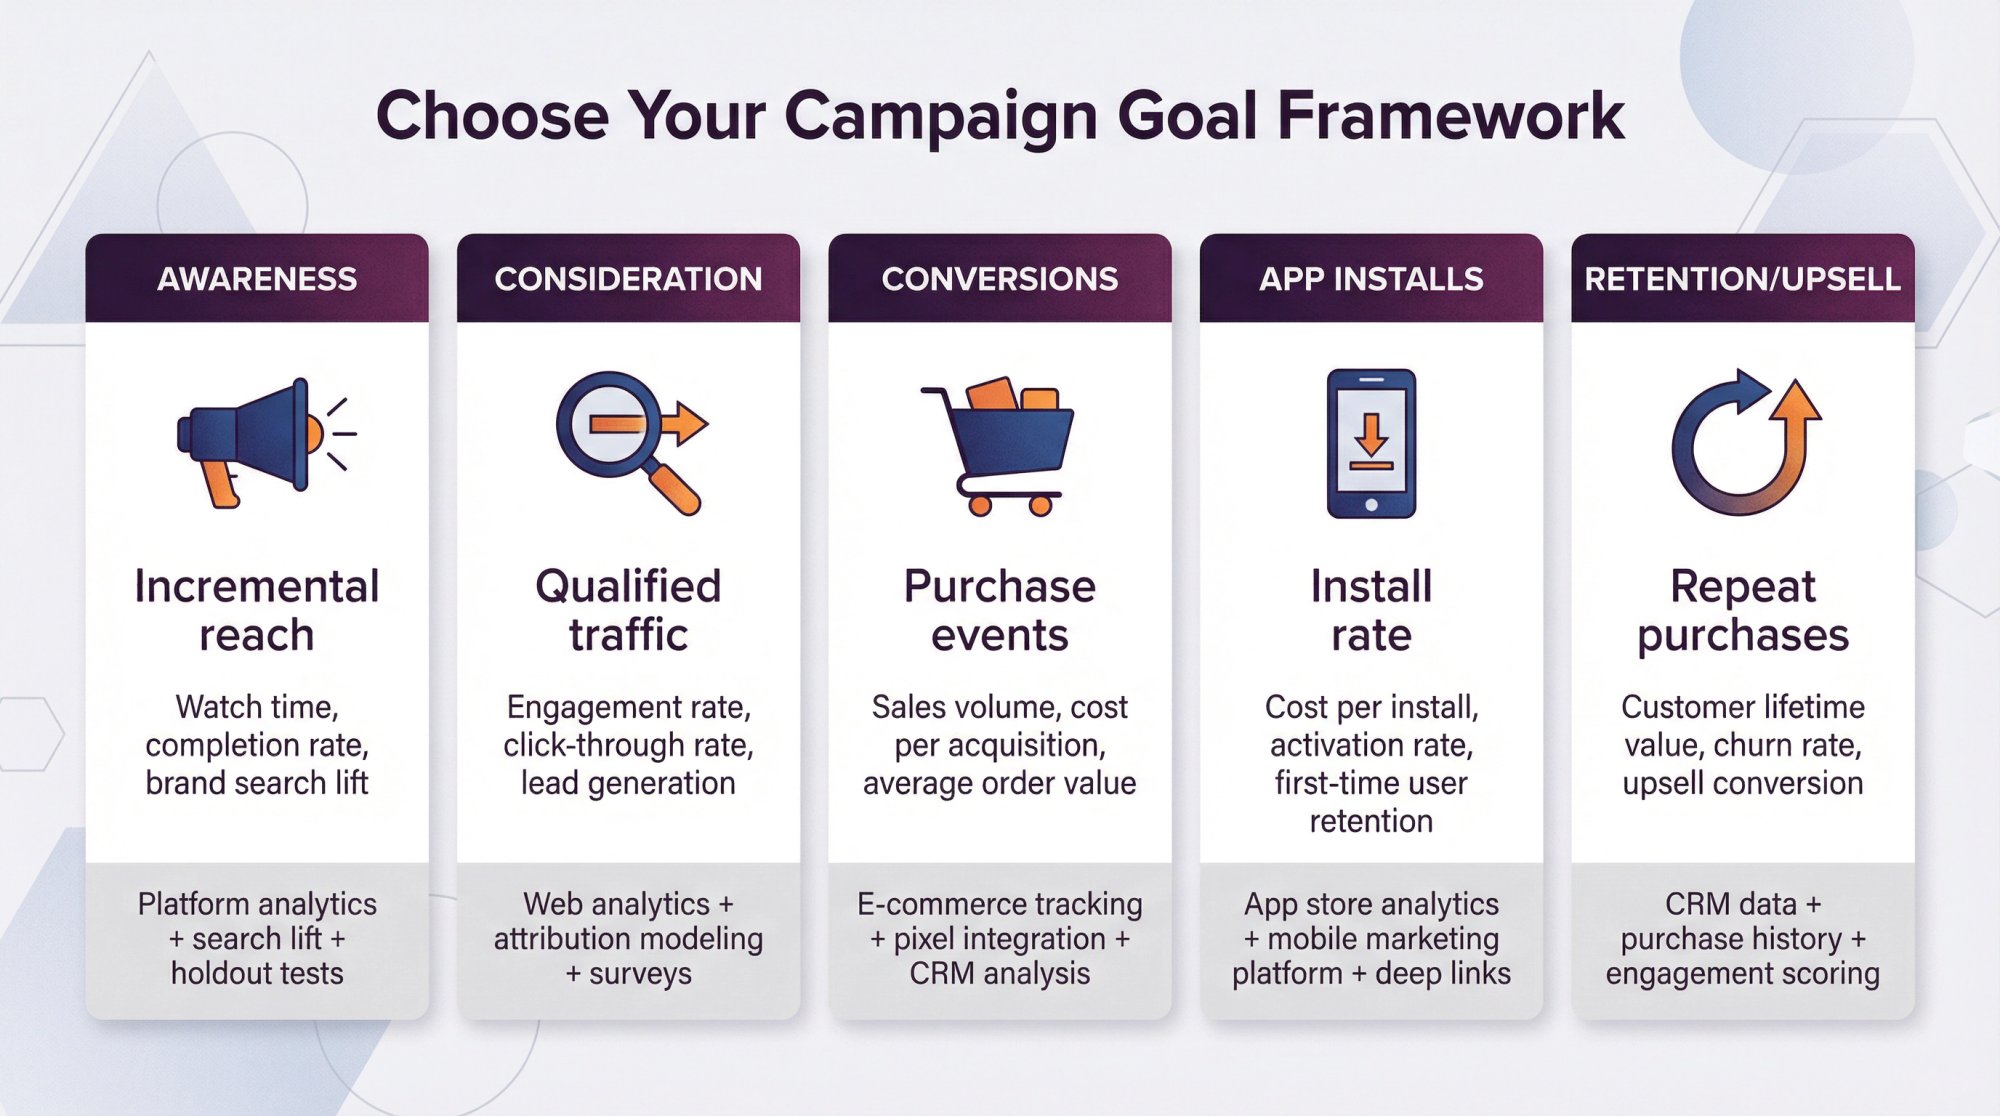
Step 1: How to choose the right campaign goal for influencer marketing
Most influencer programs fail because they try to do everything at once. Awareness and performance and UGC content and community and brand love and app installs.
Pick one primary job per campaign. Then add secondary metrics.
The mapping:
| Campaign Goal | Primary Metric | Best Supporting Metrics | Measurement Method |
|---|---|---|---|
| Awareness | Incremental reach / attention | Watch time, completion rate, saves/shares, brand search lift | Platform analytics + search lift + holdout tests where possible |
| Consideration | Qualified traffic | Profile visits, link clicks, time on site, signup starts | UTMs + landing pages + on-site events + survey assist |
| Conversions | Incremental conversions | CVR, AOV, CPA, ROAS, new customer rate | UTMs/codes + pixel/events API + controlled tests |
| App Installs | Incremental installs | CPI, D1/D7 retention, CPA to activated user | Mobile attribution + geo/holdout + post-install cohorts |
| Retention/Upsell | Incremental reactivations | Reactivation rate, revenue per user, churn reduction | Cohort analysis + targeted creator drops + holdout |
Notice something? Every serious goal needs first-party tracking. Platform metrics are necessary, not sufficient.
Step 2: What metrics actually matter for influencer success?
How to measure attention (the most undervalued signal)
Views are cheap. Attention is scarce.
Watch time / total play time: The total minutes humans spent watching. This is your best attention proxy.
Average view time: Watch time divided by views. Shows how long people actually stay.
Completion rate: Percentage who watched the entire video. Strong signal for content quality.
2-second / 6-second view rates: When available, these work as "hook" and "hold" proxies.
Platform definitions matter here. Let's compare how each platform counts views:
| Platform | View Definition | Key Metric | Important Note |
|---|---|---|---|
| TikTok | Video starts + replays | Total play time | Video completion rate = complete views / total video views |
| Instagram Reels | Starts + replays | Reach (unique viewers) | Views include replays; reach is the unique count |
| YouTube Shorts | Starts + replays (since March 31, 2025) | Engaged views | "Views" have no minimum watch time; "engaged views" = chose to keep watching |
Practical takeaway: If you want cross-platform sanity, treat attention as:
→ Reach / exposures: Platform "views" + platform "reach" when available
→ Attention: Watch time, average view time, completion rate, engaged views (YouTube)
→ Quality actions: Saves, shares, meaningful comments
What engagement rate formula should you use?
"Engagement rate" is meaningless unless you actually define the denominator.
Engagement rate = (likes + comments + shares) / total video views
That's a good default for short-form because views are closer to exposures than followers are.
Use two engagement rates in your reporting:
1) ER per view (content resonance)
$$ER_{view} = frac{likes + comments + shares + saves}{views}$$
2) ER per reach (audience intensity)
$$ER_{reach} = frac{engagements}{reach}$$
(Only if you have reach data)
Key engagement signals include:
• Likes and reactions: Simple indicators that people saw and appreciated the content
• Comments: Look at number and nature. Quality matters. Are people tagging friends, asking questions, or leaving generic praise?
• Shares/saves: Strong indicator of value. High share counts amplify reach organically and serve as trust metrics.
• Engagement rate benchmarks: Average engagement rates vary significantly by platform. TikTok's viral nature yields around 2.5% average engagement, whereas Instagram averages closer to 0.5-1%. Micro-influencers often hit 5%+ because of tighter audience relationships.
• Sentiment of engagement: High engagement with negative sentiment indicates a mismatch. Monitor whether responses are actually favorable.
What outcome metrics predict influencer ROI?
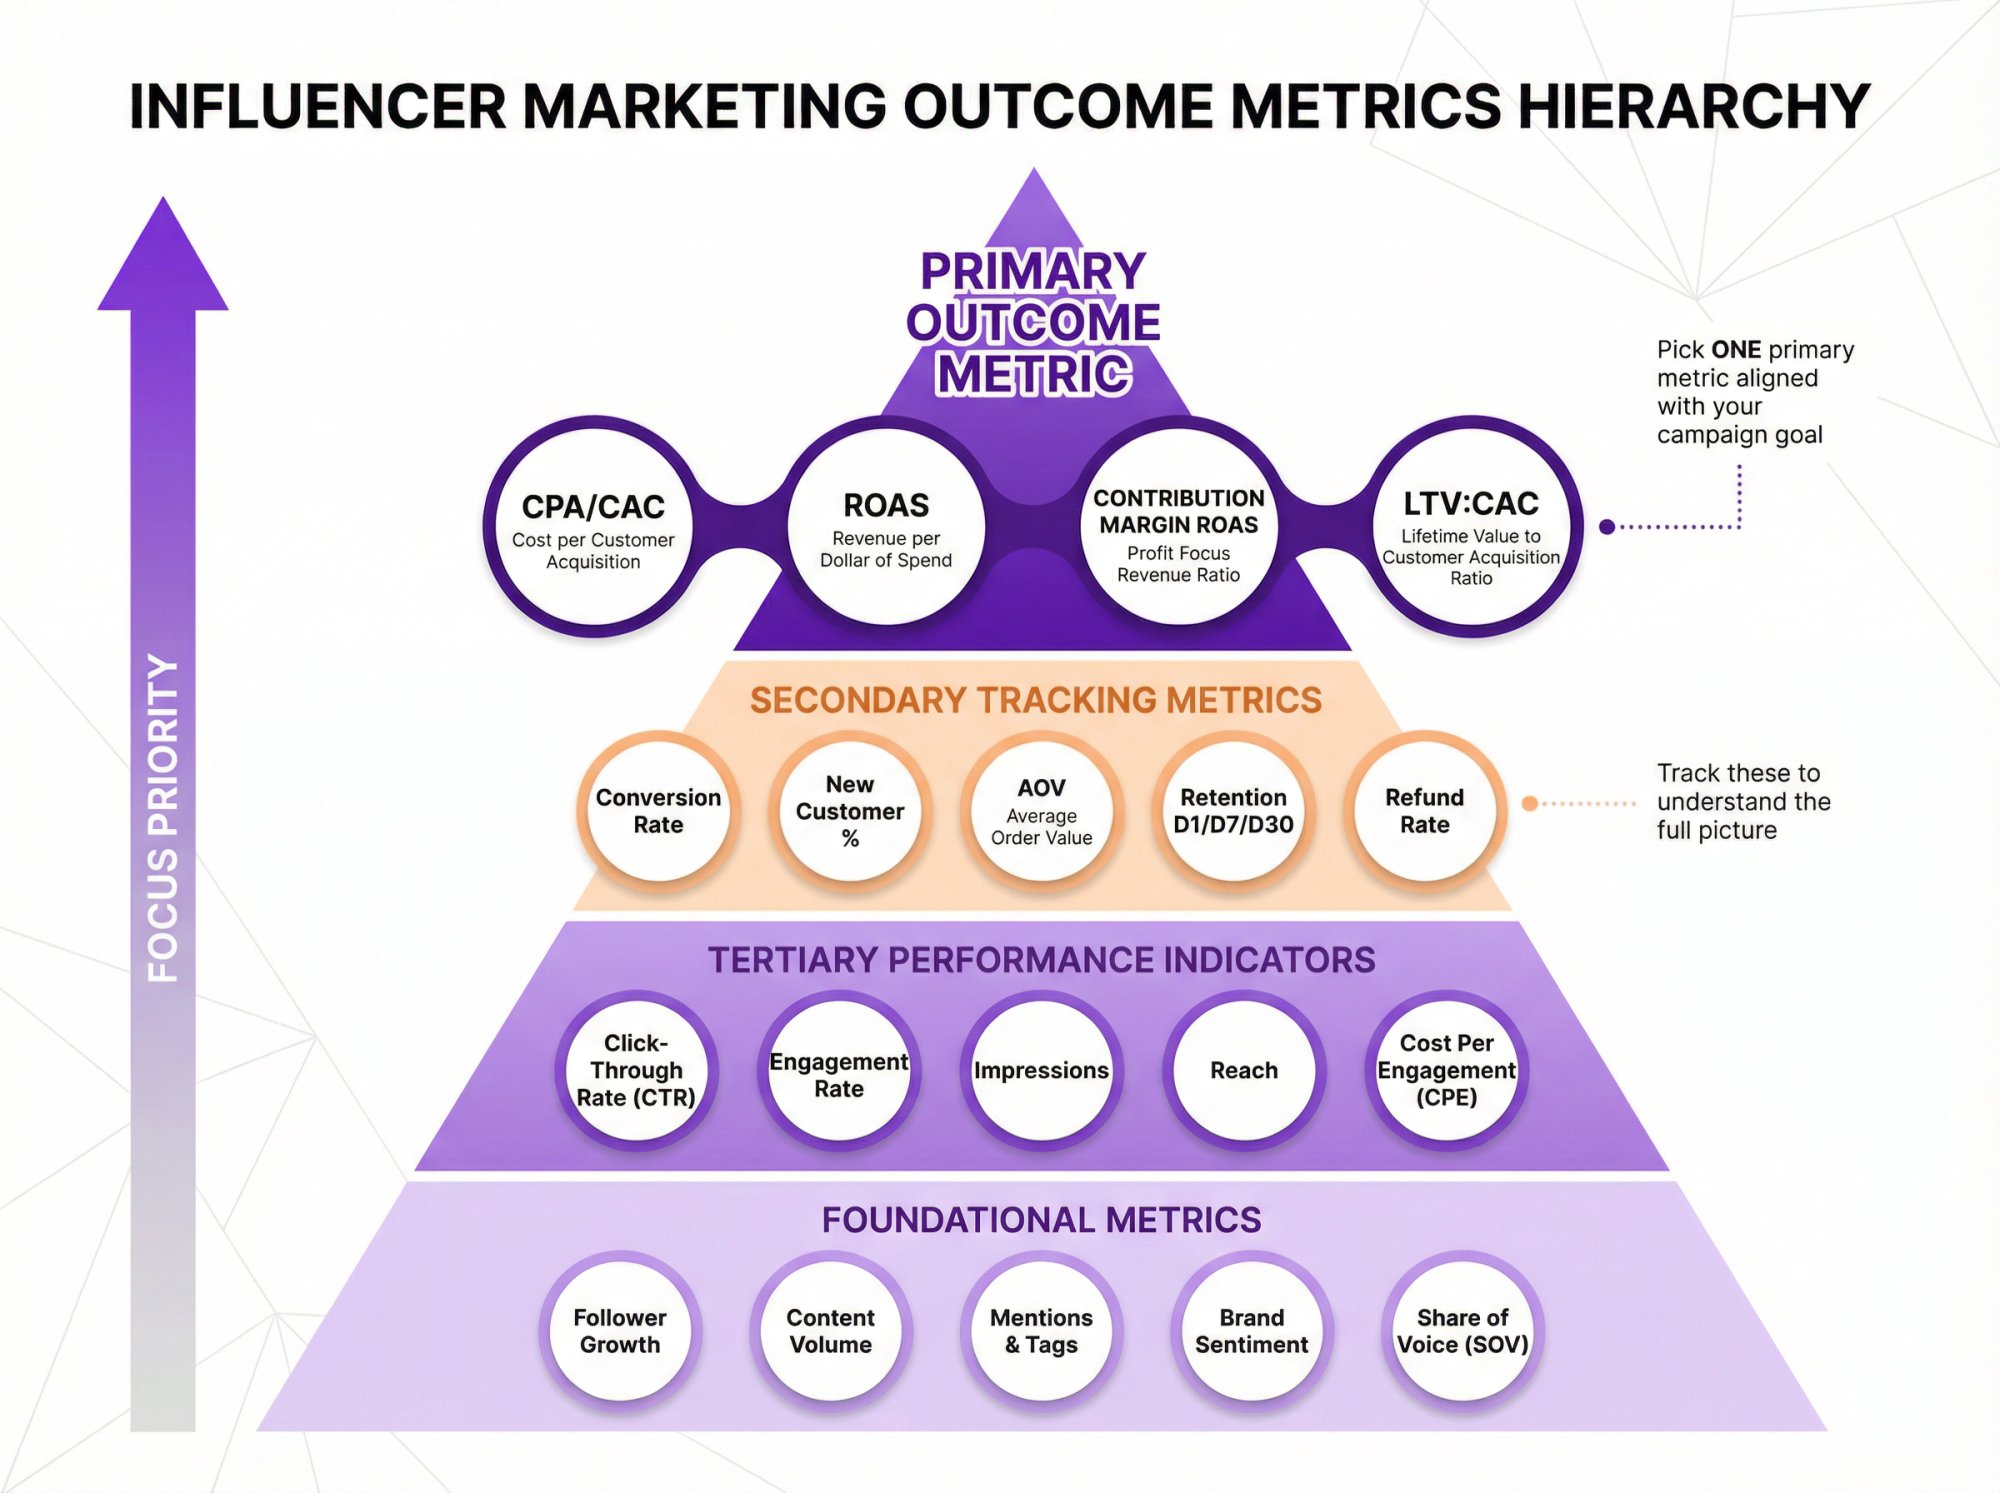
Pick one primary outcome metric:
→ CPA / CAC: Cost per customer or activated user
→ ROAS: Revenue per dollar spent
→ Contribution margin ROAS: Profit per dollar spent (more honest than revenue ROAS)
→ LTV:CAC: If you have real lifetime value data
Track these secondaries:
Conversion rate
New customer percentage
Average order value (AOV)
Retention (D1/D7/D30)
Refund/chargeback rate (yes, creators can drive low-quality buyers)
Key conversion benchmarks:
• Conversion rate: Of people who clicked through, what percentage converted? Influencer marketing conversion rates often sit in low single digits. Anything around 3% or higher is strong.
• Cost per acquisition: Industry data shows influencer CAC can be 30-50% lower than paid advertising for the right brands and creators.
• Return on investment: The ultimate metric. Research suggests an average influencer marketing ROI of roughly $5.20 in value per $1 spent, with some analyses showing influencer marketing can be 10.5× more cost-effective than paid media.
Step 3: How to build tracking infrastructure for influencer campaigns
You need three types of tracking because people behave differently:
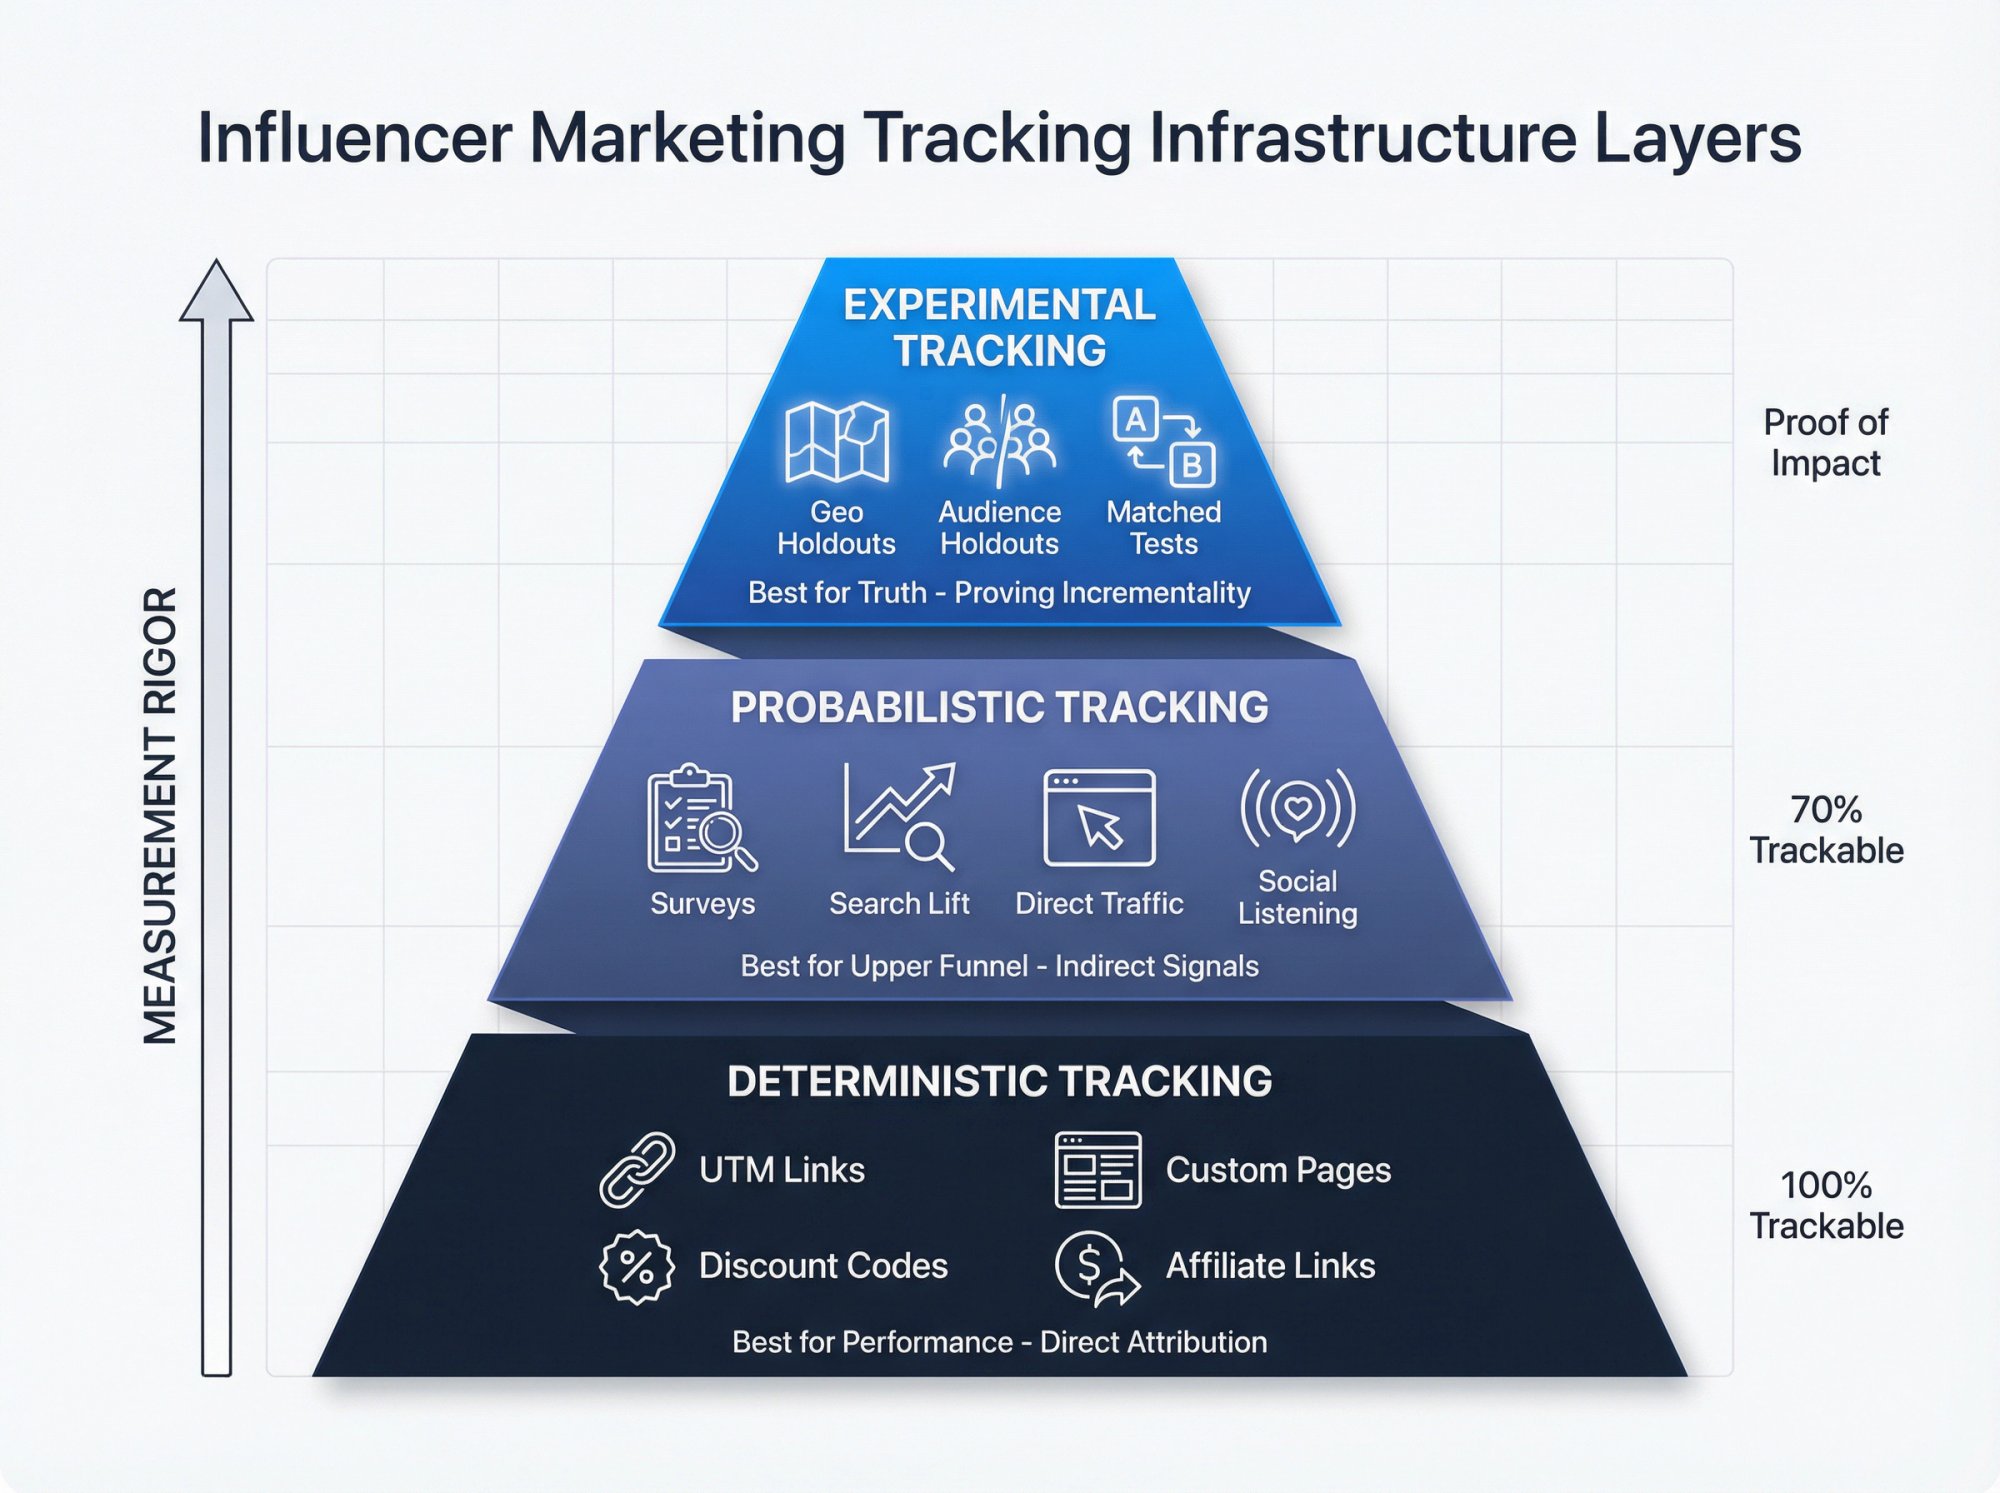
1) Deterministic tracking (best for performance)
This is your baseline for any performance program.
UTM links (creator-specific): Generate unique links for each influencer using UTM parameters:
yourwebsite.com/promo?utm_source=instagram&utm_campaign=winter-launch&utm_content=maria-name
Creator-specific landing pages: Build microsites for each influencer (yoursite.com/influencer-name) to clearly segment traffic and measure conversion paths.
Affiliate links: Use affiliate platforms that track clicks and conversions automatically.
Creator-specific discount codes: Give each influencer a unique promo code (like "MARIA10" for 10% off). This directly counts purchases and makes attribution simple.
2) Probabilistic tracking (best for upper funnel)
When people don't click the link but still convert later. This happens more than you think.
Post-purchase survey: Add "How did you hear about us?" with a creator dropdown. Simple but surprisingly accurate.
Brand search lift: Monitor branded search volume (Google Trends, Google Ads) before and after creator posts.
Direct traffic lift: Watch for spikes in direct traffic and conversions during campaign windows.
Social listening: Track brand mentions and sentiment shifts using social media monitoring tools.
3) Experimental tracking (best for truth)
The only way to prove incrementality.
Geo holdouts: Run campaigns in region A, hold out region B (matched market), then compare lift in conversions and revenue.
Audience holdouts: Use paid amplification (TikTok Spark Ads, Instagram Partnership Ads) to target a defined audience and hold out a control slice.
Matched-market tests: Book similar creators but stagger posting dates, then compare day-level lift.
Why this matters: If you don't measure incrementality, you'll overpay creators who simply harvest demand you already created via other channels. You'll reward the wrong people and cut the actually effective ones.
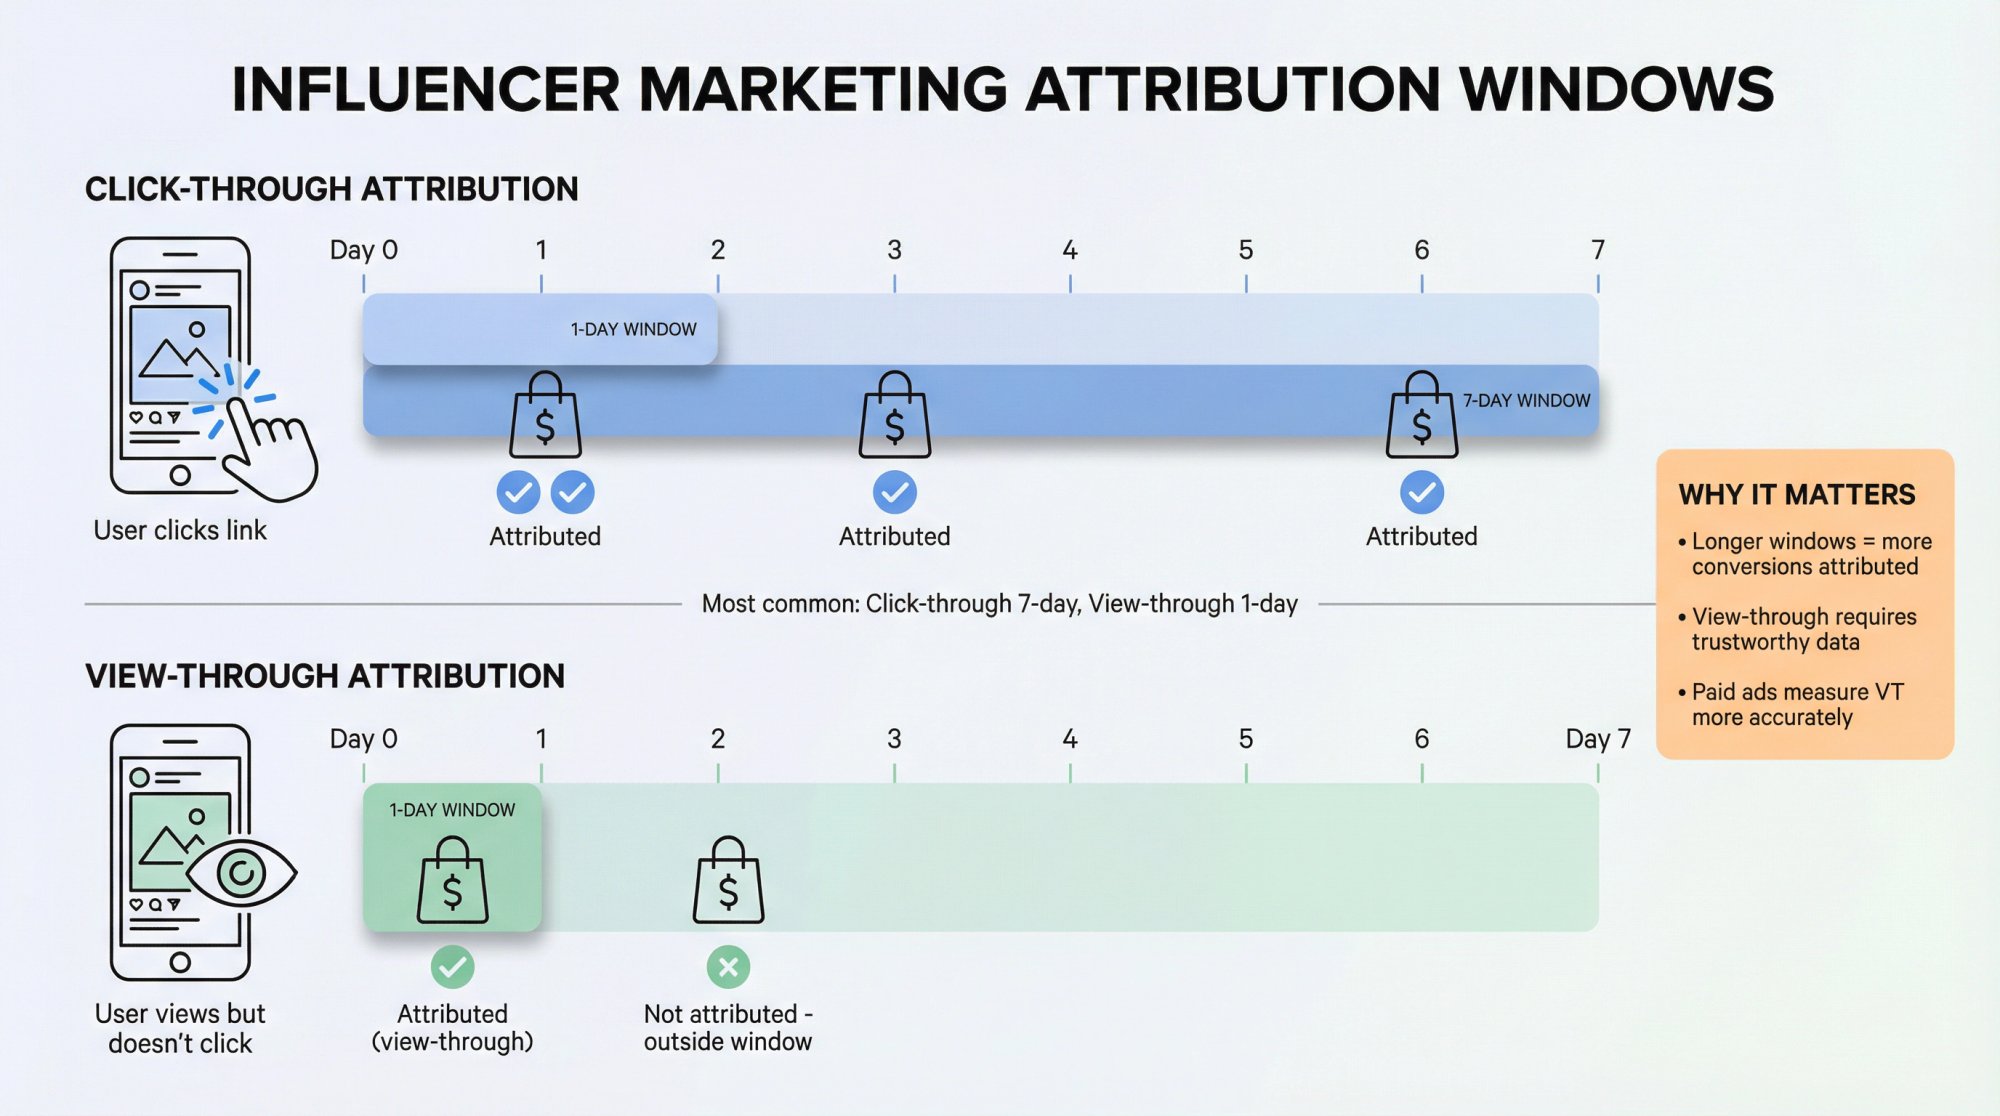
Step 4: How to set up attribution windows for influencer marketing
Otherwise every report becomes a political argument.
Recommended defaults for influencer programs
Here's how the industry typically approaches attribution windows:
| Attribution Type | Standard Window | Fast Commerce Window | When to Use |
|---|---|---|---|
| Click-through | 7 days | 1-3 days | Performance reporting |
| View-through | 1 day | 1 day | Only if data quality is trustworthy |
| Multi-touch | Both | Both | Optimization and understanding assist value |
TikTok explicitly defines view-through attribution as conversions that happen after an ad view (no click) within the attribution window.
Important nuance: If you're boosting influencer posts with Spark Ads or Partnership Ads, you can measure view-through more cleanly because it's paid media with tracking. For purely organic influencer posts, view-through attribution is basically model-driven guesswork unless you're running controlled experiments.
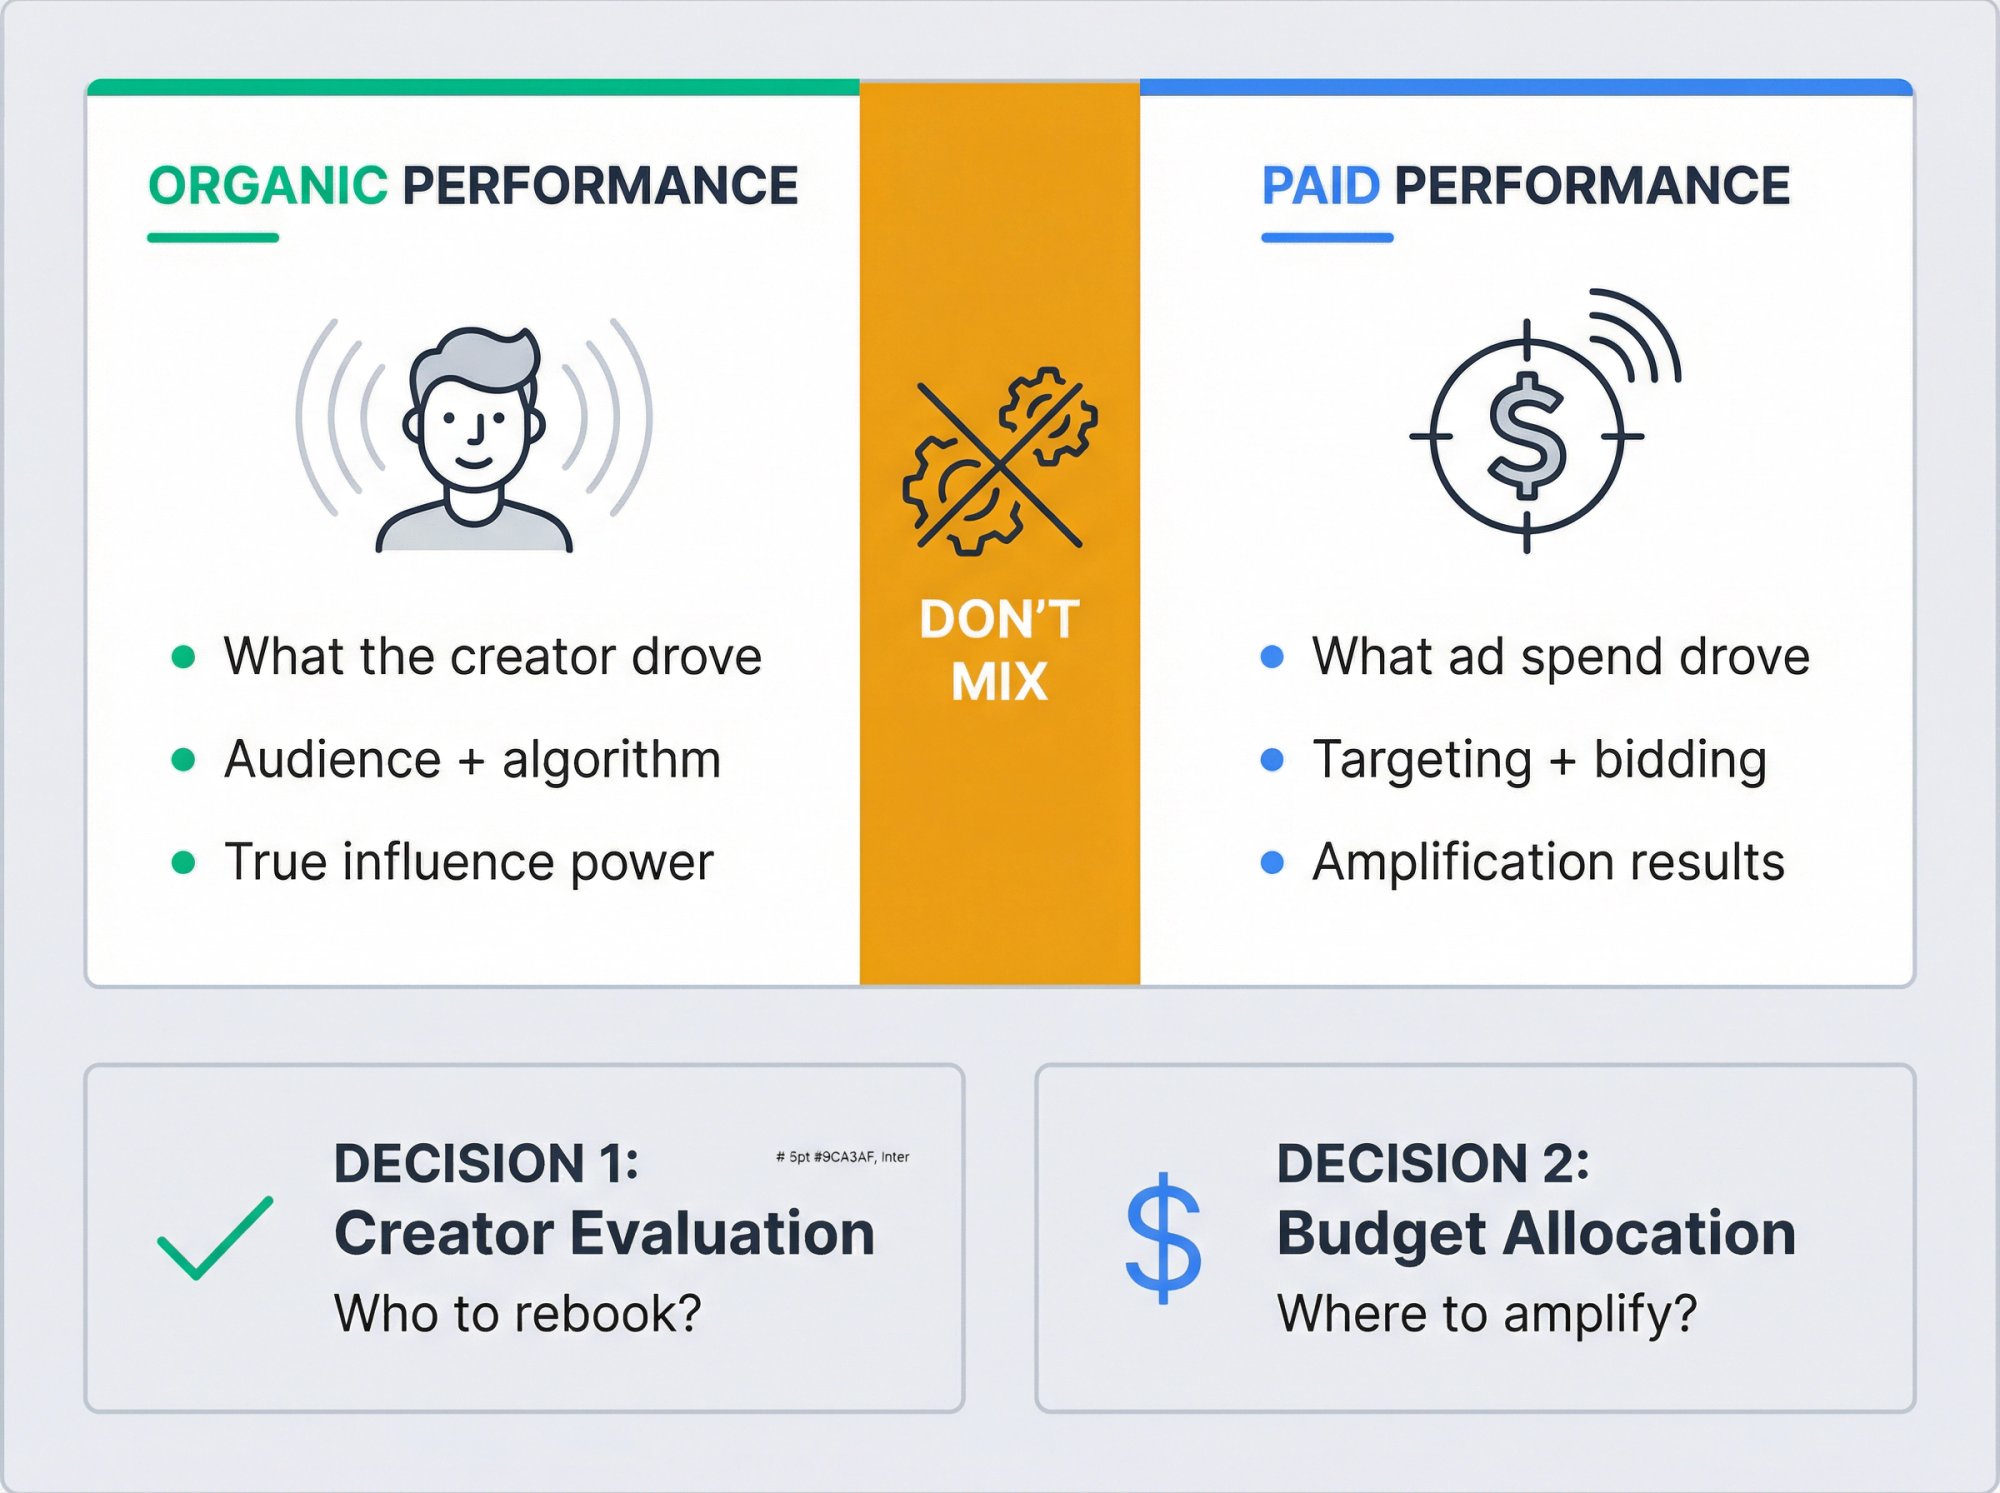
Step 5: How to separate organic from paid influencer performance
A creator post can perform because:
It's a banger (organic distribution)
You put paid spend behind it (amplification)
Both
• Organic video views vs paid video views (Spark Ads)
So your reporting must split results into:
→ Organic outcomes: What the creator actually drove through their audience and the algorithm
→ Paid outcomes: What your ad spend drove through targeting and bidding
→ Combined outcomes: What your total program delivered
This matters for two critical decisions:
Creator evaluation: Who deserves to be rebooked based on their organic performance?
Budget allocation: Which posts should you scale with paid amplification?
If you mix organic and paid results, you can't make either decision correctly.
Step 6: How to compare influencer performance fairly
Raw views are the laziest metric because they're mostly driven by niche, format, platform luck, and follower base.
Instead, normalize performance.
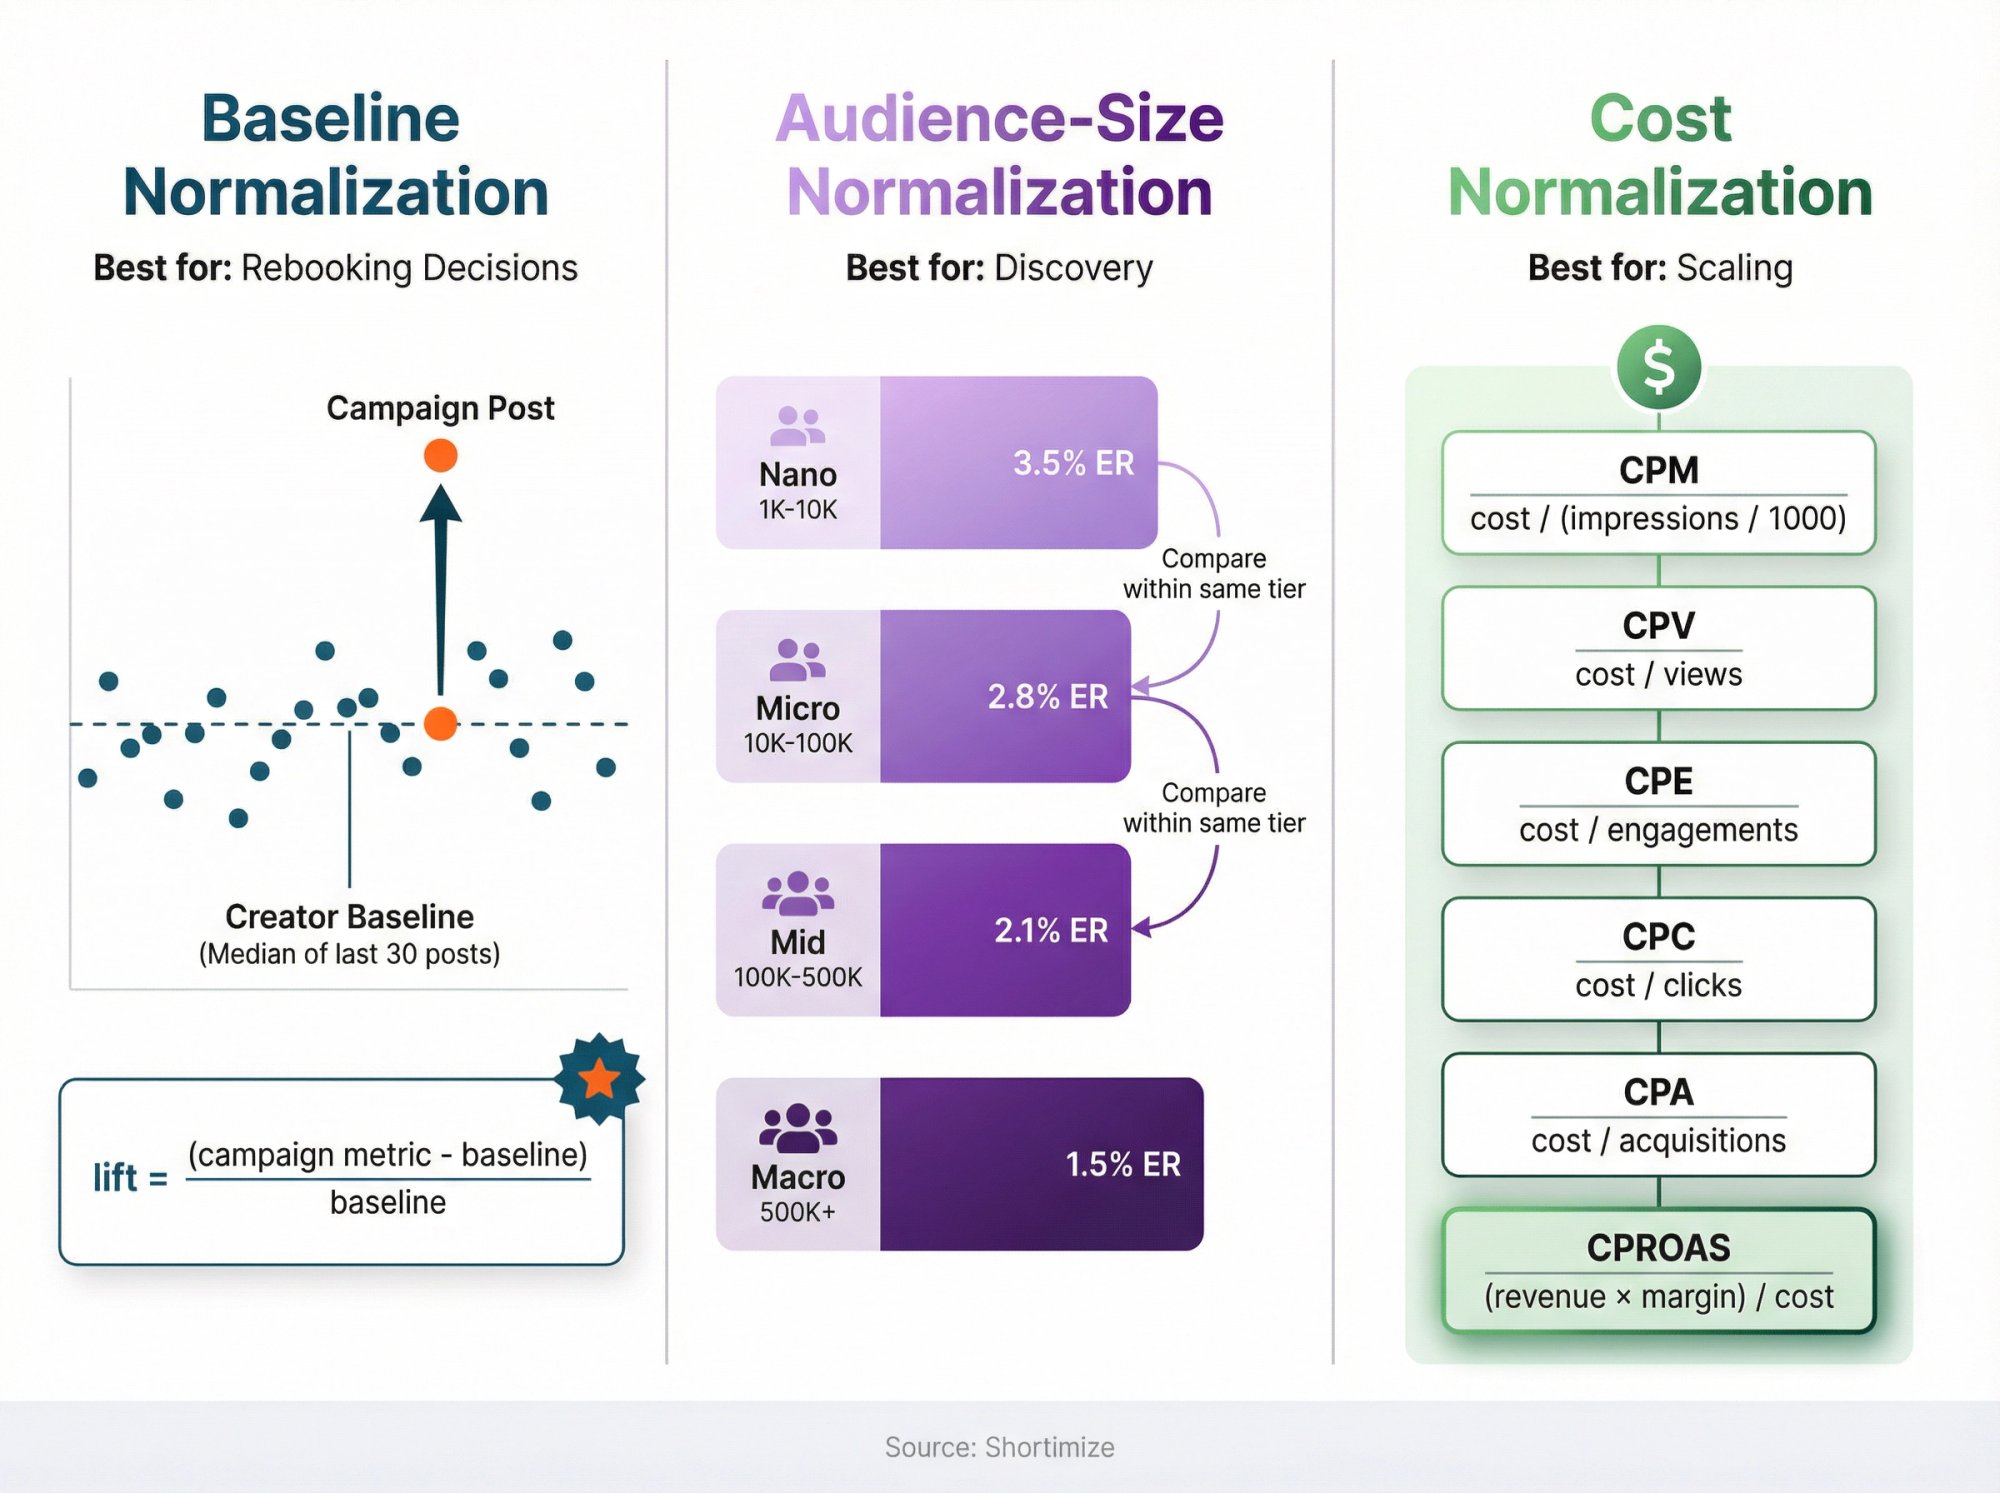
Baseline normalization (best for rebooking decisions)
Compare each post to the creator's typical performance:
Baseline views = median views of last 30 posts
Baseline watch time = median watch time
Baseline ER_view = median ER_view
Then compute lift:
$$lift = frac{campaign metric – baseline}{baseline}$$
This tells you whether the creator overperformed for them, not just for the internet.
Audience-size normalization (best for discovery)
Group creators by size bands (nano/micro/mid/macro), then compare within the band.
Benchmarks help here. These vary wildly by dataset, niche, and how "engagement rate" is defined. Use benchmarks to ask "are we in the right ballpark?" not "did we hit the exact number?"
Cost normalization (best for scaling)
Everything becomes clear when you convert to unit economics:
CPM = cost / (impressions / 1000)
CPV = cost / views
CPE = cost / engagements
CPC = cost / clicks
CPA = cost / acquisitions
CPROAS = (revenue × gross margin) / cost
If you can't compute at least CPV and CPE, you don't have a measurement system.
Step 7: Influencer success scorecard template (copy/paste this)
You want a one-page view that answers:
Did it work?
Why?
What do we do next?
The goal here is brutal simplicity. One scorecard, one decision.
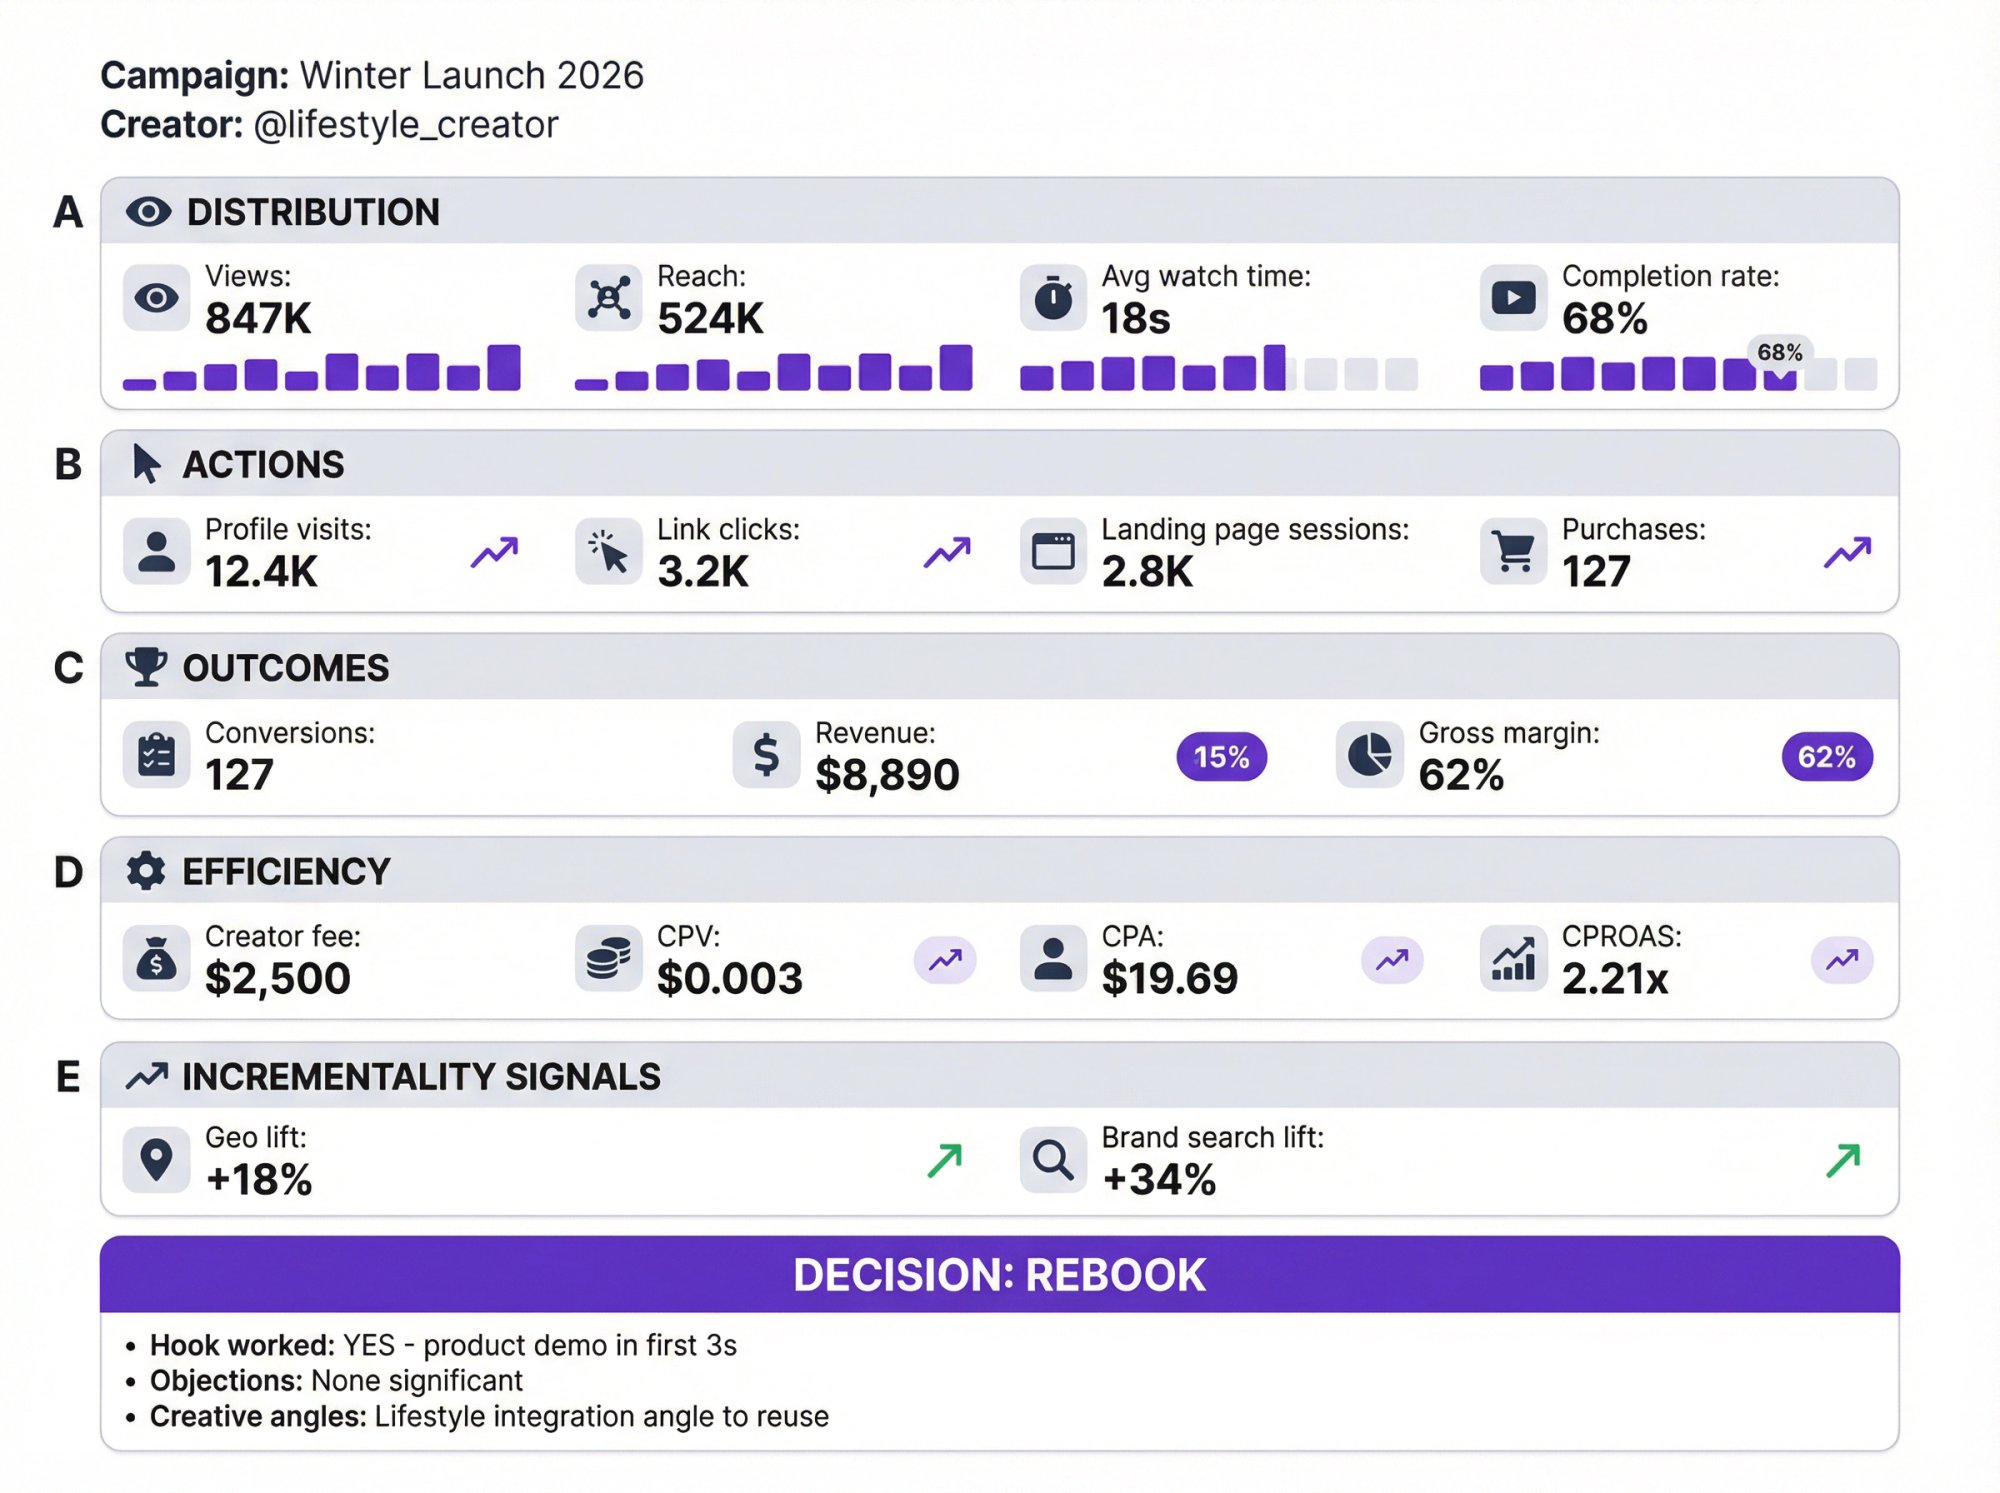
Influencer success scorecard (copy/paste this)
Campaign: __________
Creator: __________
Platform: __________
Post URL: __________
Post Date: __________
Deliverable Type: (reel/short/tiktok/story/live)

A) DISTRIBUTION
- Views: __________
- Reach (if available): __________
- 3s/2s views (if available): __________
- Avg watch time: __________
- Completion rate: __________
- Shares: __________
- Saves: __________
- Comments: __________
- ER_view: __________

B) ACTIONS
- Profile visits: __________
- Link clicks: __________
- Landing page sessions (UTM): __________
- Signup starts: __________
- Add to carts: __________
- Purchases: __________

C) OUTCOMES
- Conversions (primary): __________
- Revenue: __________
- Gross margin %: __________
- Contribution margin: __________
- New customer %: __________
- Refunds %: __________

D) EFFICIENCY
- Creator fee: __________
- Production cost: __________
- Paid amplification spend: __________
- CPV: __________
- CPE: __________
- CPC: __________
- CPA: __________
- CPROAS: __________

E) INCREMENTALITY SIGNALS
- Geo lift % (if tested): __________
- Holdout lift % (if tested): __________
- Brand search lift %: __________
- Post-purchase survey mentions: __________

DECISION:
→ Rebook / scale with paid / pause / test again

NOTES:
- Hook worked? (yes/no + why)
- Objections in comments?
- Creative angles to reuse?
How to use it:
Don't let people add "extra metrics." Force a decision. Require a written "why" so you build institutional knowledge over time.
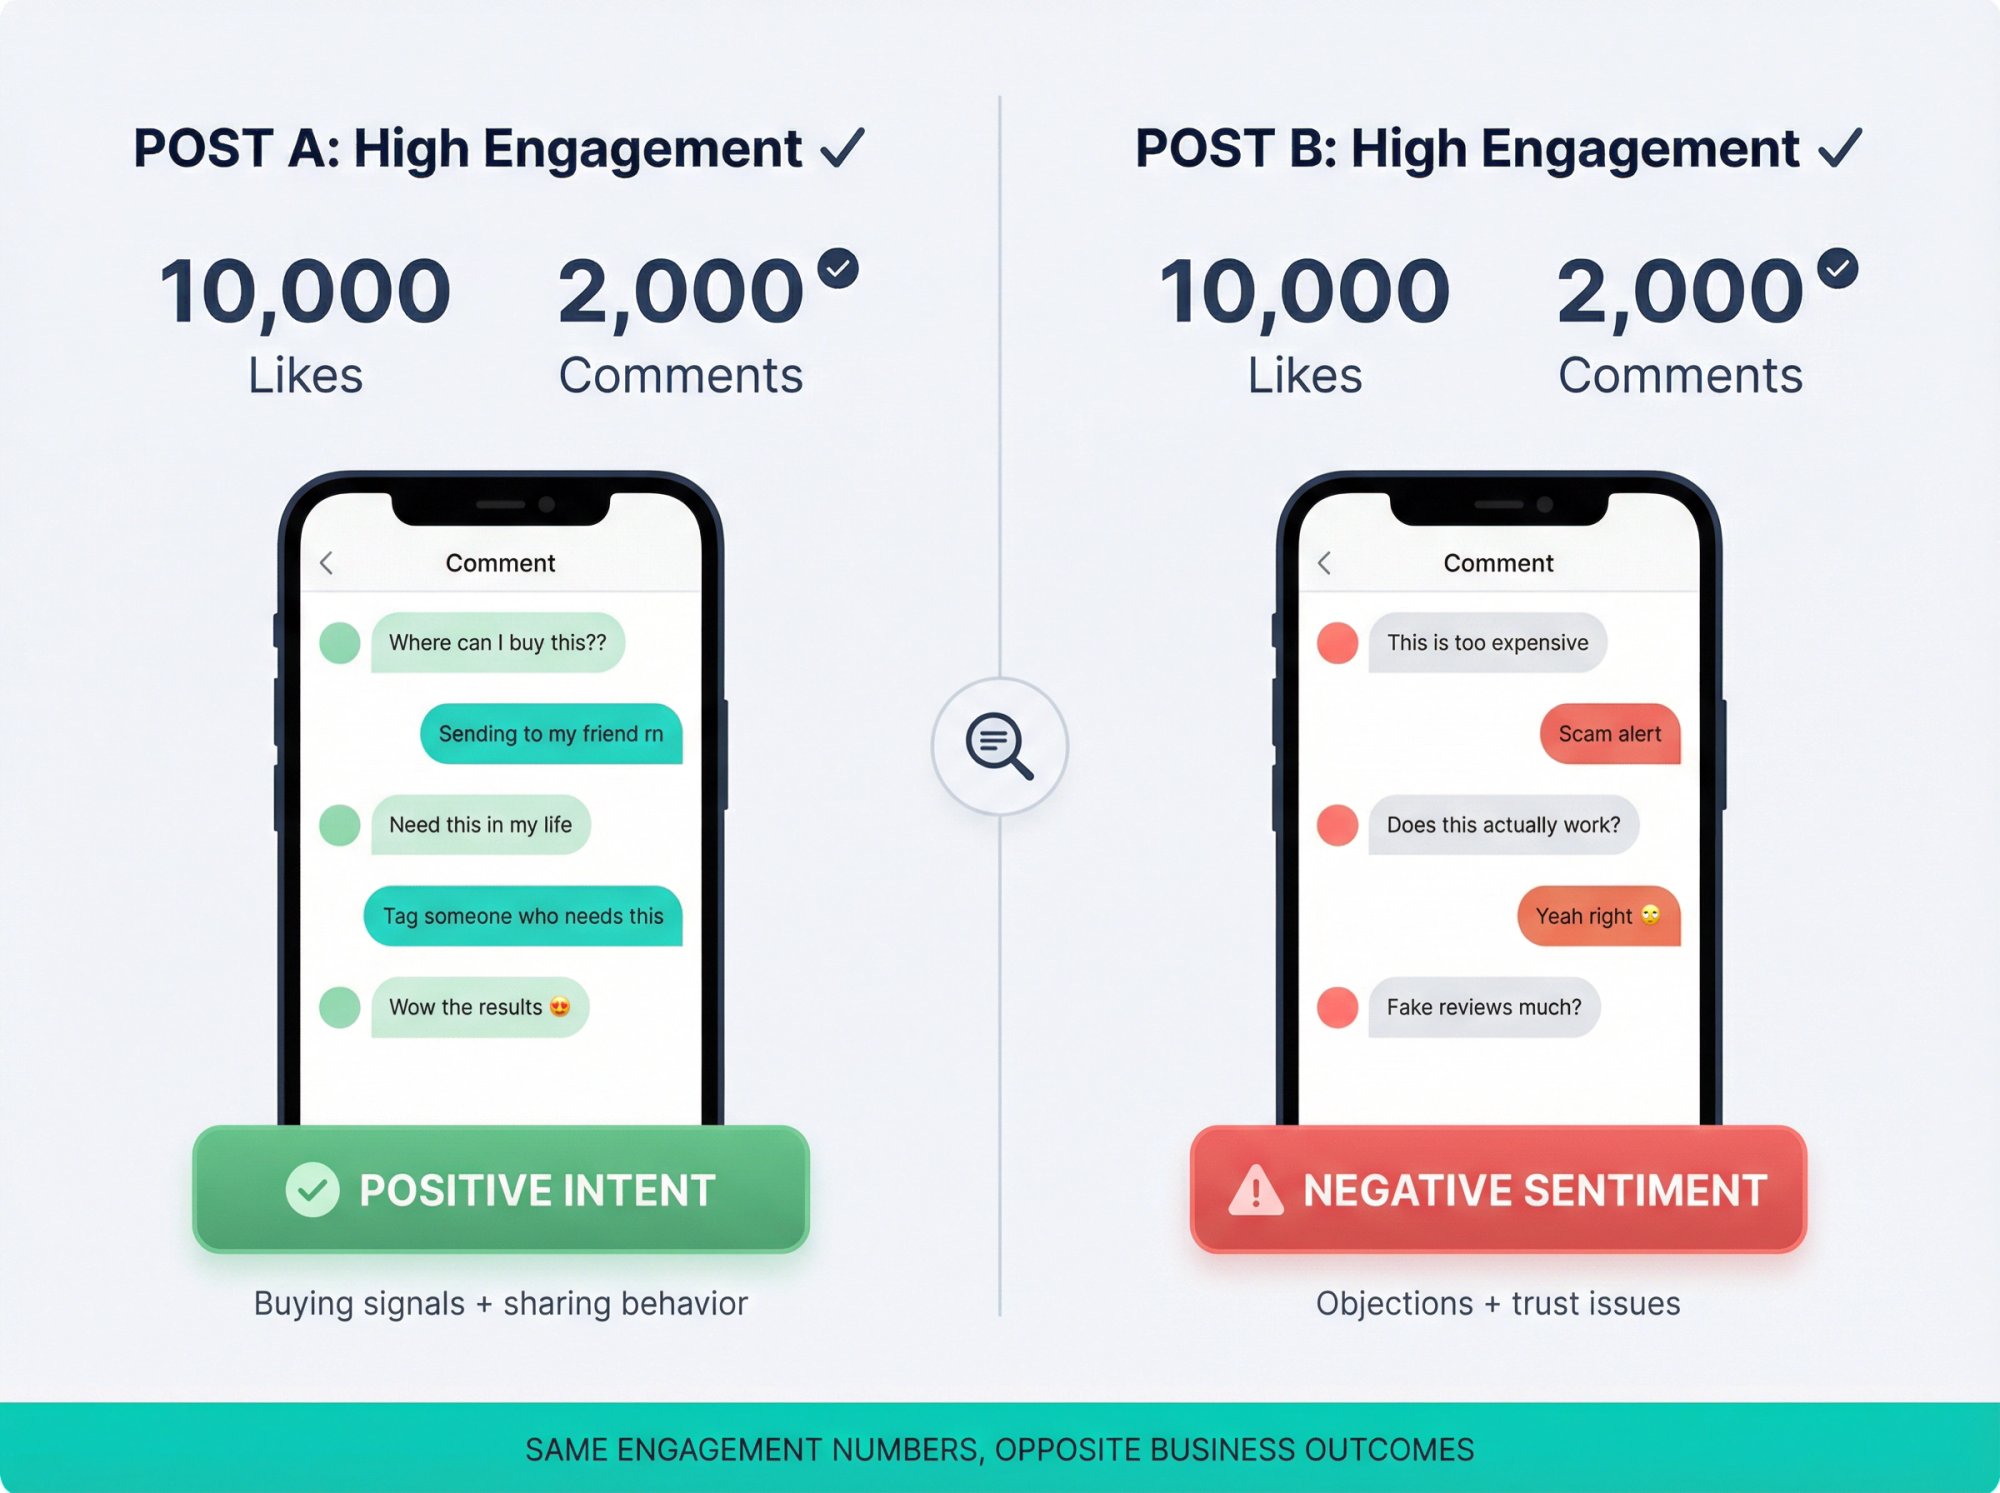
Step 8: How to measure influencer sentiment and comment quality
Industry research warns that engagement can be misleading if it's driven by negative reactions. High engagement doesn't automatically mean success.
You need basic sentiment + comment quality:
Percentage positive/neutral/negative comments: Manual sampling works. Read 50-100 comments and categorize.
Recurring objections: Track patterns like "too expensive," "scam," "doesn't actually work."
Question volume: "Where can I buy?" is a buying signal. "Is this real?" is a trust problem.
Save/share intent: Comments like "need this" or "sending to my friend" indicate strong positive intent.
Step 9: How to prove incrementality in influencer marketing
If you do only one advanced thing from this post, do this.
Attribution is easy to game, incrementality is hard to fake
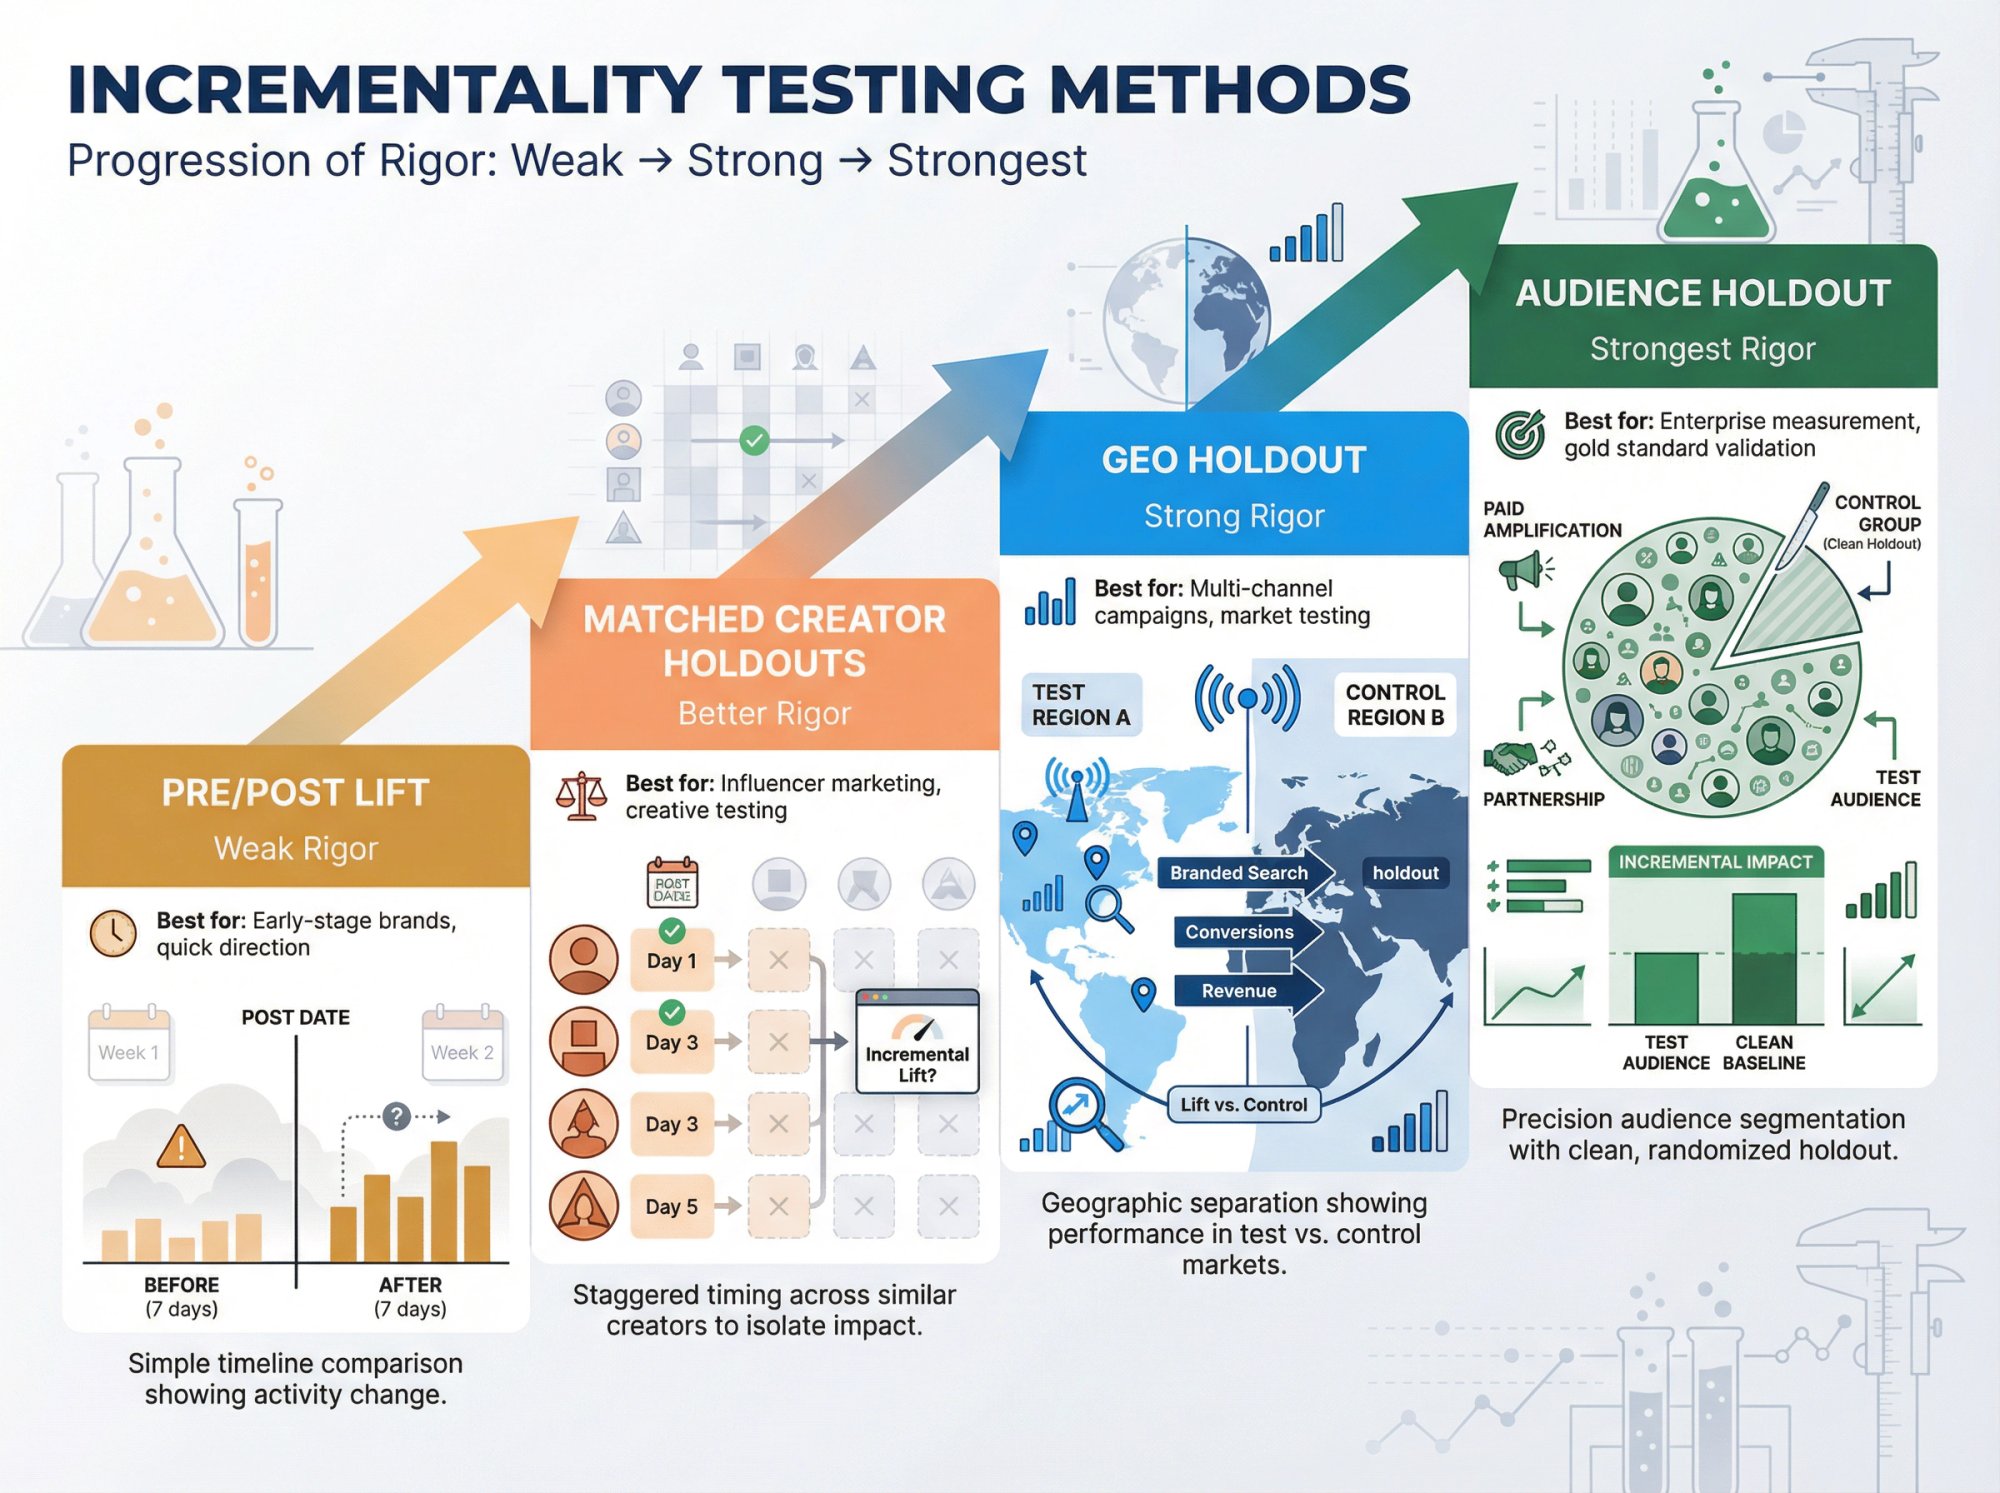
Here are incrementality methods in increasing order of rigor:
| Method | Rigor Level | Best For | Key Advantage | Key Limitation |
|---|---|---|---|---|
| Pre/Post Lift | Weak | Early-stage brands | Fast and simple | Seasonality confounds |
| Matched Creator Holdouts | Better | Mid-stage programs | Practical and scalable | Not perfectly controlled |
| Geo Holdout | Strong | Ecommerce and apps | True control group | Needs geographic volume |
| Audience Holdout | Strongest | Paid amplification | Cleanest measurement | Requires paid media spend |
Method 1: Pre/post lift (fast, weak)
Compare conversions in the 7 days before vs after the post.
Good for: Early-stage brands with no testing capability
Bad because: Seasonality, promos, and other marketing changes can dominate the signal
Method 2: Matched creator holdouts (better)
Book 20 similar creators but stagger posting dates. Compare day-level lift on posting days vs non-posting days.
Not perfect, but better than vibes.
Method 3: Geo holdout (strong, doable)
Run influencer campaigns in region A, hold out region B (matched market). Compare lift in:
Branded search
Conversions
Revenue
Best for: Ecommerce and apps with enough volume to split geographies
Method 4: Audience holdout (strongest, hardest)
Use paid amplification (Spark Ads, Partnership Ads) to target a defined audience and hold out a control slice.
Best when you can run partnership ads with tracking. You can measure view-through and conversions cleanly.
Why this matters: Research shows that attention metrics actually correlate with business impact. Attention isn't revenue, but it's often upstream of revenue.
Step 10: How to operationalize influencer tracking at scale
If you're managing more than 10 creators per month, spreadsheets break. You need:
• Automated collection of public performance data across platforms
• Cross-platform normalization so TikTok, Instagram, and YouTube metrics are comparable
• Alerts for outliers (viral spikes you need to act on today)
• Exports + API access to join with your first-party metrics
Shortimize's core strength: It tracks public data for TikTok, Instagram Reels, and YouTube Shorts in one place so you can monitor accounts and videos without manual scraping or begging creators for screenshots.
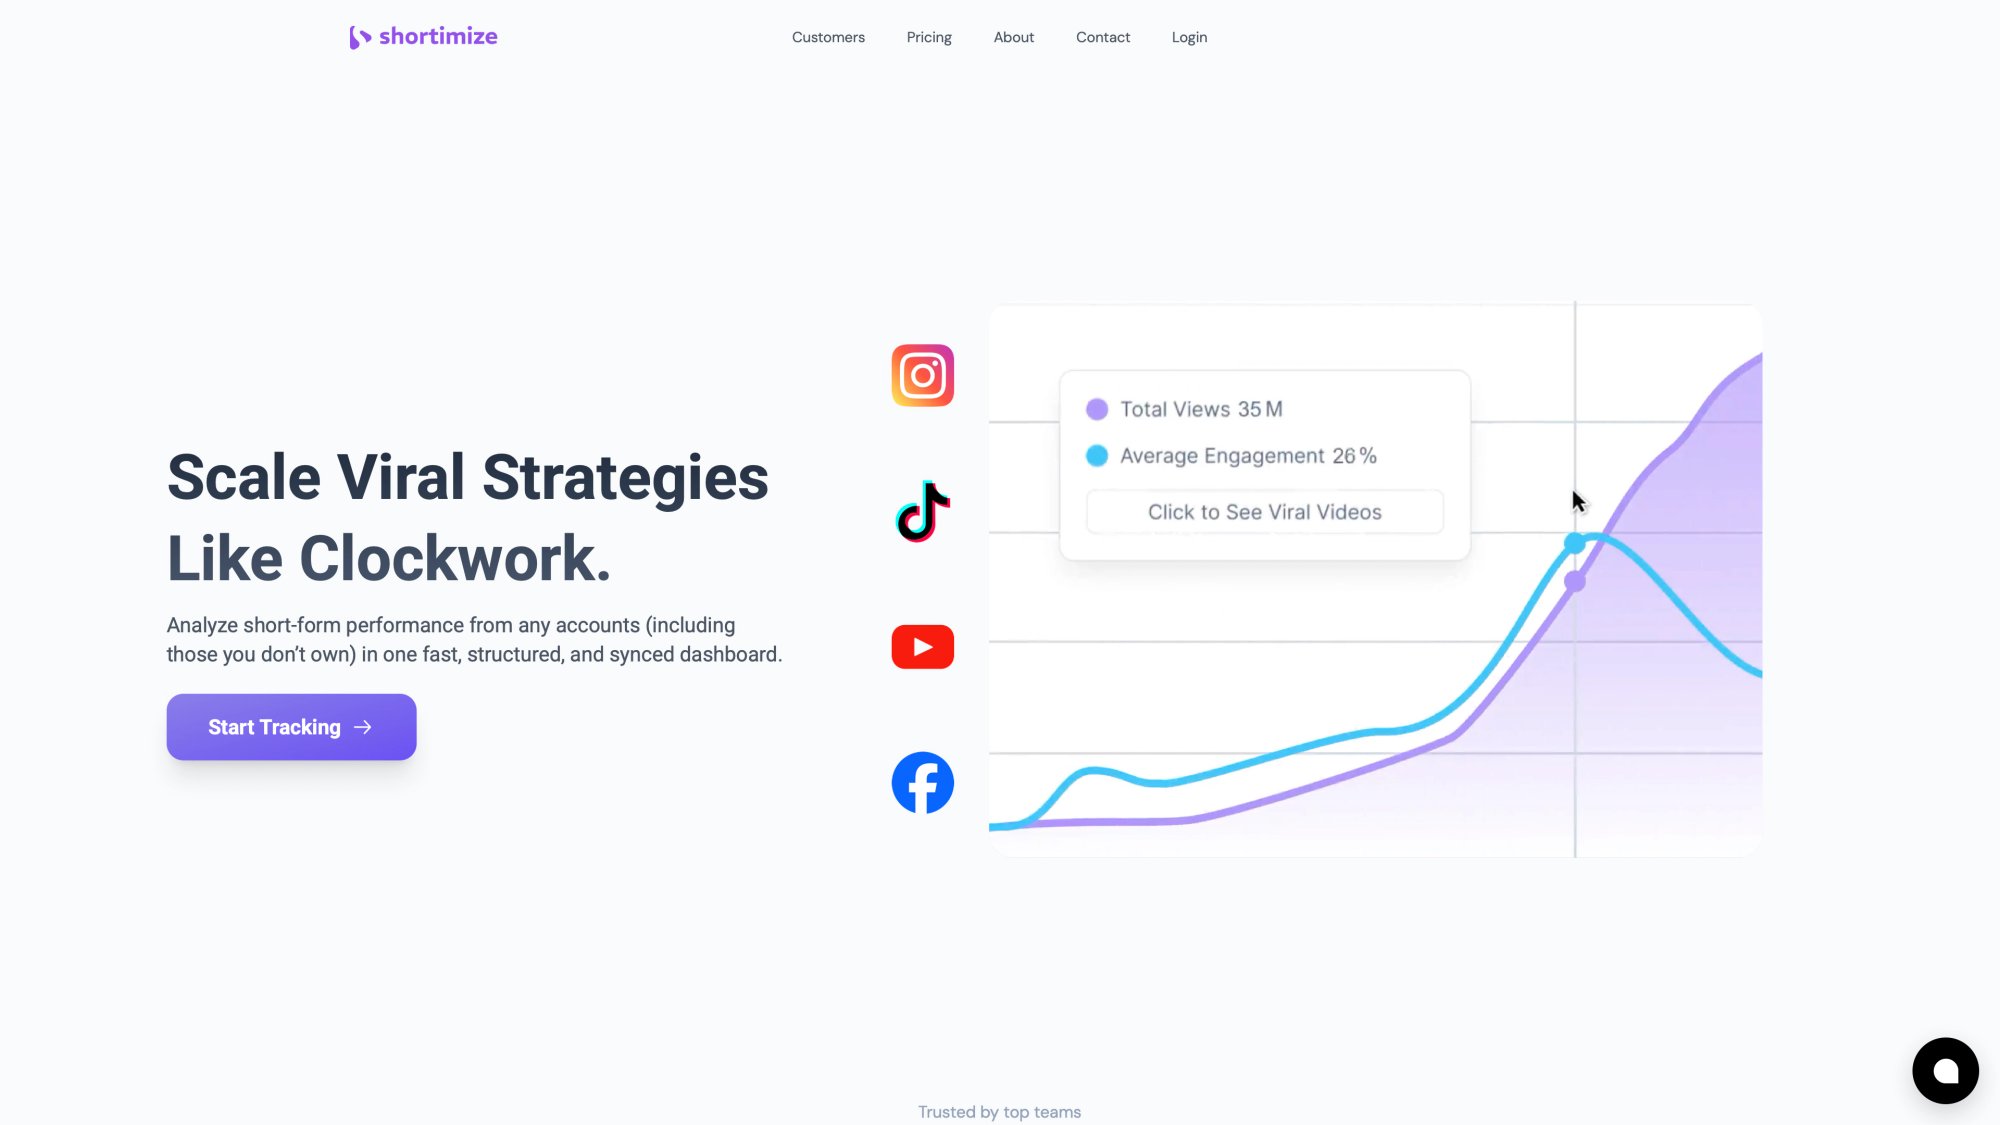
The platform brings together all your short-form performance data in one unified interface, eliminating the need to switch between multiple analytics dashboards.
A practical Shortimize + first-party workflow
1) Create a campaign collection
Create a Collection in Shortimize per campaign (e.g., "Feb 2026 Launch – Creators Wave 1"). Add each creator's account plus the specific deliverable videos.
2) Track the public layer automatically
Shortimize pulls video views, likes, comments, shares, watch time patterns, and account-level performance automatically. This gives you the content-performance layer (Layer 1) without manual data entry.
3) Join with your first-party layer
Export Shortimize data and join it with:
UTM sessions and conversions in GA4
Product events in Mixpanel, Amplitude, or Posthog (Shortimize supports syncing data directly into these platforms)
Ecommerce orders from Shopify or Stripe
4) Set up viral spike alerts
When something hits outlier performance, you want to know today, not next week. Shortimize supports Slack and Discord notifications so your team can react fast.
5) Export a clean weekly report
Shortimize lets you export tables quickly. Your report becomes a decision tool, not a data-entry nightmare.
Shortimize also published a tactical guide on building a cross-platform tracking system for influencer campaigns (January 5, 2026). Worth reading after this if you want a shorter, implementation-first version.
What tools should you use for tracking influencer performance?
Platform analytics (insider access)
Leverage the built-in analytics on each social platform:
Instagram Insights: Shows reach, engagement, Story metrics (replies, exits, navigation), and audience demographics.
TikTok Analytics: Provides views, average watch time, audience regions, follower growth, and video performance over time.
YouTube Studio Analytics: Gives granular data on views, watch time, click-through rates on video descriptions, and traffic sources.
Ask influencers to share key insight reports during and after campaigns. Screenshots work, but export CSVs are better.
Cross-platform analytics tools
Tools like Shortimize simplify tracking by aggregating public data:
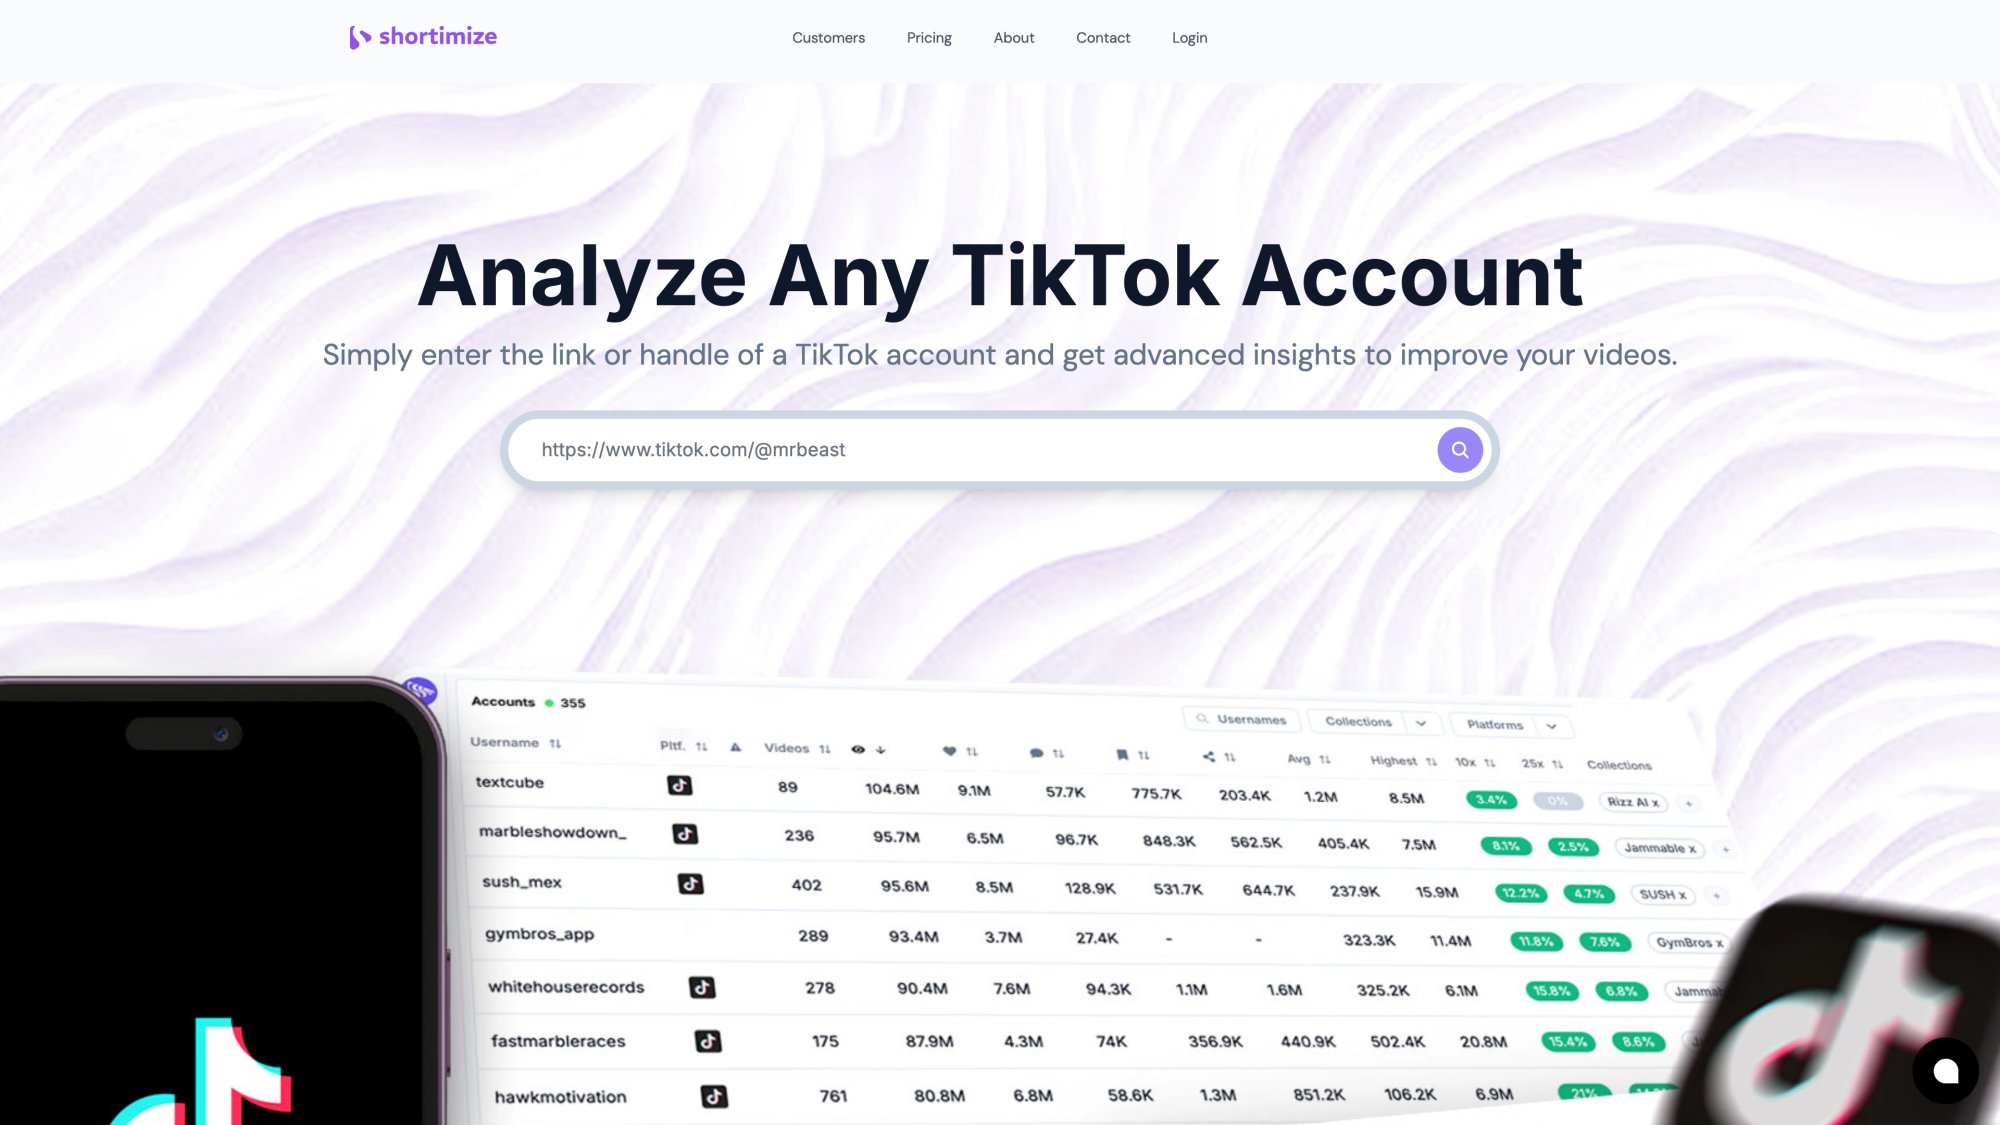
• Track any public TikTok, Instagram Reels, or YouTube Shorts account or video with just a link
• Pulls together metrics like views, likes, comments, engagement rates, and posting schedules
• Enables easy benchmarking and identification of viral content patterns
• Provides real-time data on public metrics across all three platforms
Data integration & automation
For large programs, automate data flows:
Use connectors to pipe data from social platforms, Google Analytics, and Shopify into a unified metrics dashboard that updates in near real-time.
This frees your team from weekly data drudgery and enables advanced metrics like real-time ROI calculation.
Social listening & sentiment tools
For qualitative tracking beyond the influencer's own posts:
Social media monitoring tools can monitor conversations happening elsewhere, alert you when your brand is mentioned, and analyze sentiment of those mentions.
What are the biggest mistakes that make influencer marketing fail?
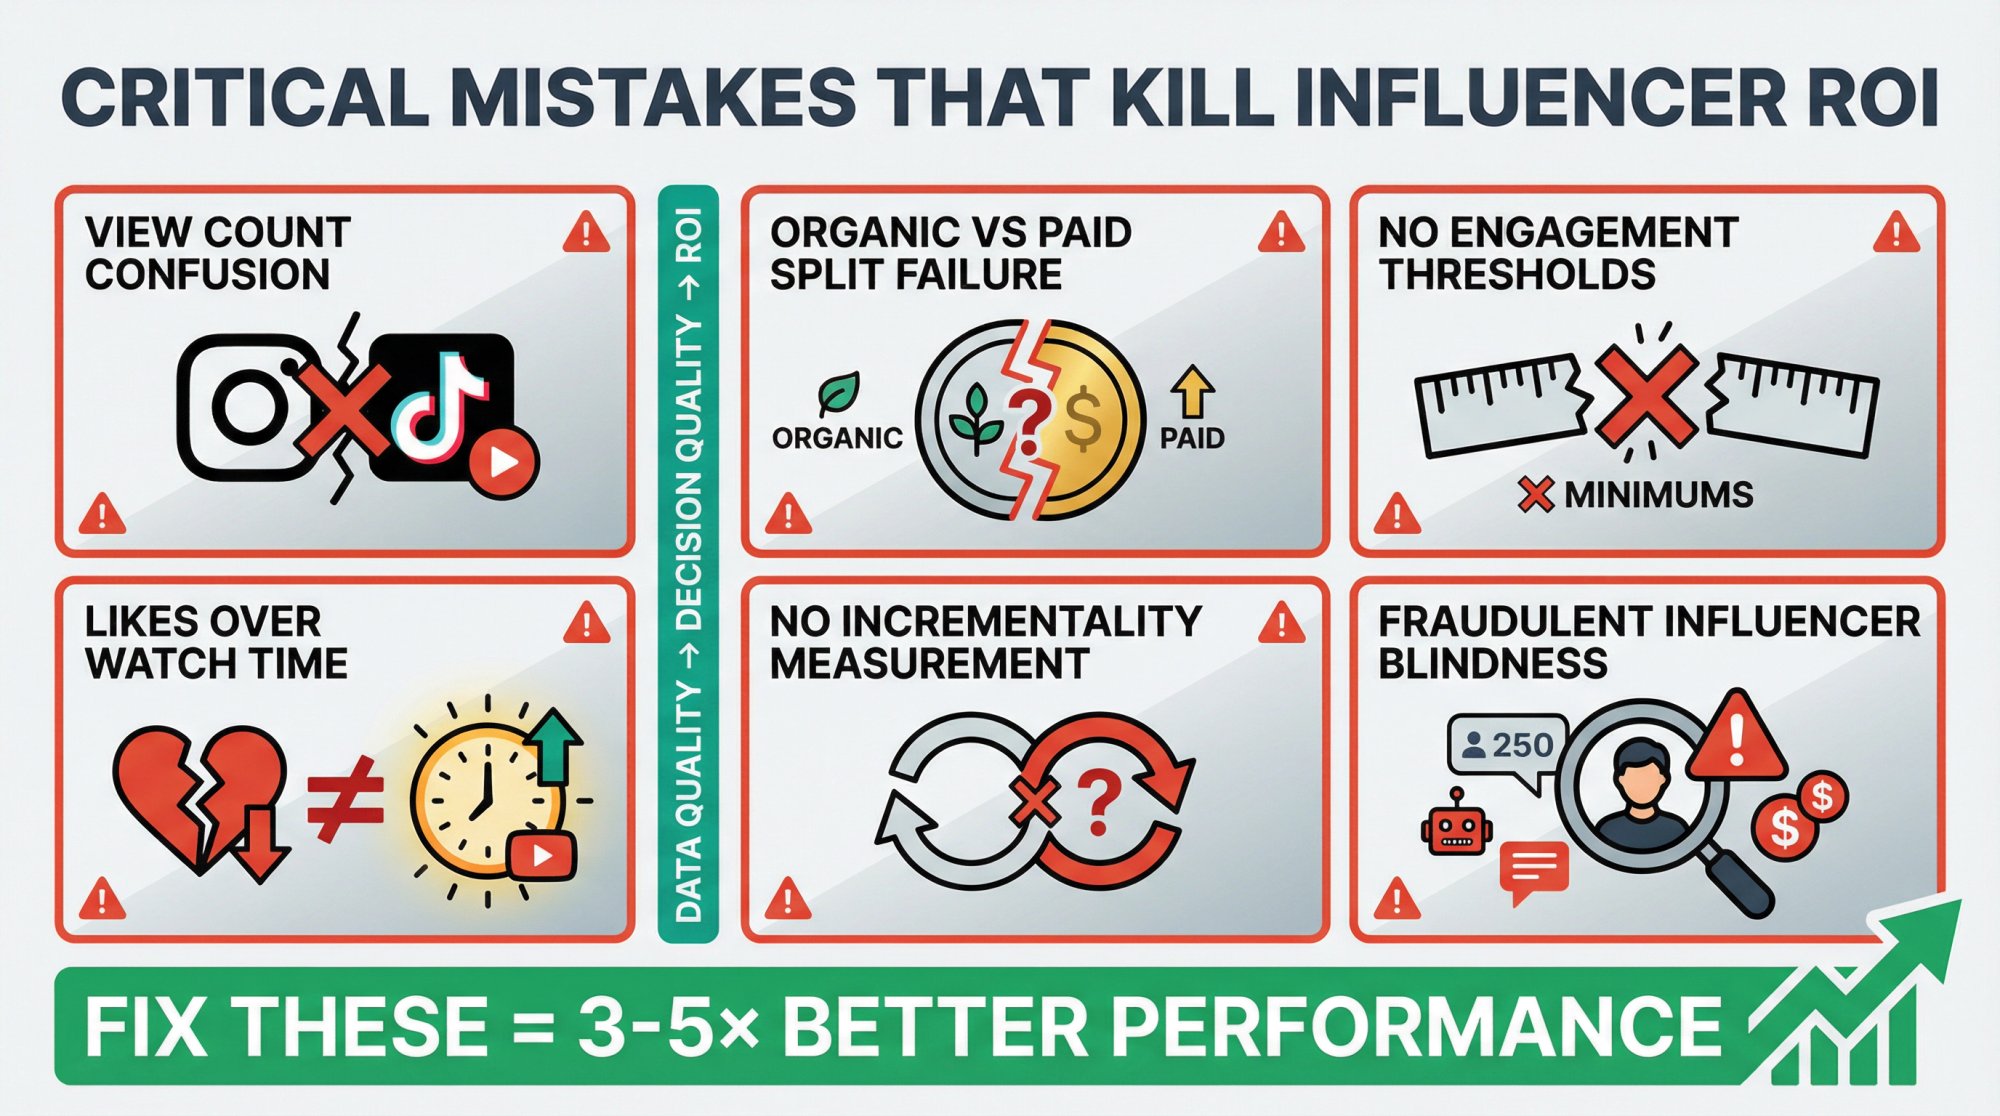
1) Comparing view counts across platforms without knowing definitions
YouTube Shorts changed view counting in March 2025. Instagram counts replays in views. TikTok views are different from Instagram views. You can't compare raw numbers.
Learn more about how different platforms count views and the implications for your measurement.
2) No separation of organic vs paid results
TikTok reporting separates organic vs paid views for Spark Ads. If you mix them, you can't evaluate creators or budget allocation correctly.
3) No decision thresholds
If you can't say "if CPA < $X, we scale," you're not running a program. You're running a hobby.
4) Optimizing for likes instead of watch time + conversions
Likes can be cheap and gamed. Watch time + saves are harder to fake and correlate better with actual business impact.
5) Never running incrementality tests
You end up funding creators who convert people you would've gotten anyway. You reward demand harvesting, not demand creation.
6) Ignoring fraud and anomalies
Analytics tools can help you spot fake engagement patterns. 1 in 4 influencers has at some point paid for fake followers. Always consider the quality of engagement, not just quantity.
FAQ: The questions people are really asking
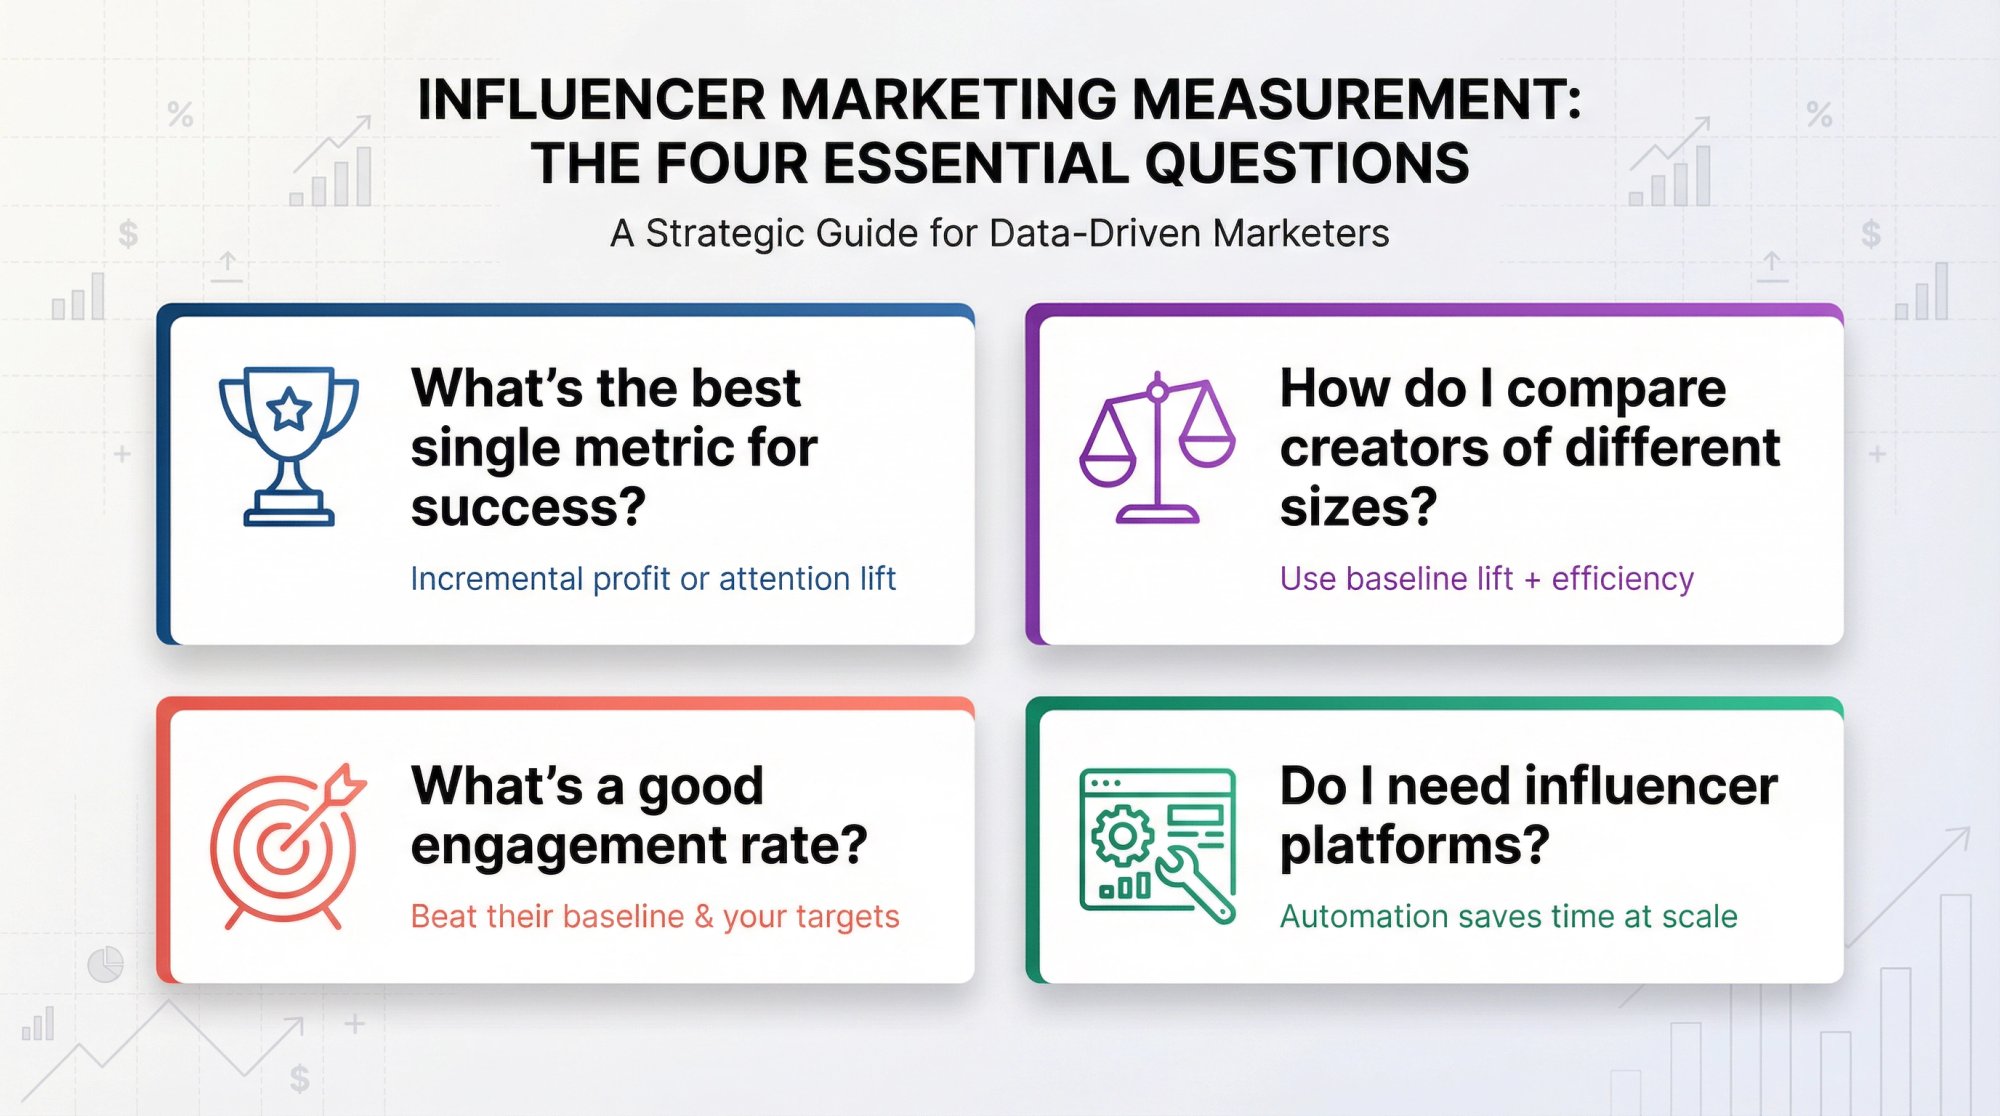
"What's the best single metric for influencer success?"
There isn't one. But if you force me to pick:
→ Incremental contribution margin (profit) for performance campaigns
→ Incremental attention + search lift for awareness campaigns
"How do I compare creators of different sizes?"
Use three lenses:
Baseline lift: Did they beat their own median performance?
Efficiency metrics: CPE and CPA normalize for audience size
Confidence: Don't trust conversion rates from 9 clicks. You need volume for statistical confidence.
"What's a 'good' engagement rate?"
Benchmarks vary wildly by dataset and definition. Use them as context only.
But your real benchmark is: Did this creator beat their baseline and beat your unit economics target?
Learn more about what makes a good engagement rate on TikTok and what view rates indicate quality.
"Do I need influencer platforms to measure success?"
You need some system. If you're doing cross-platform short-form at volume, you'll want automation. Tools like Shortimize exist specifically to reduce cross-platform tracking friction and give you back time to make decisions.
How to interpret your data and prove success
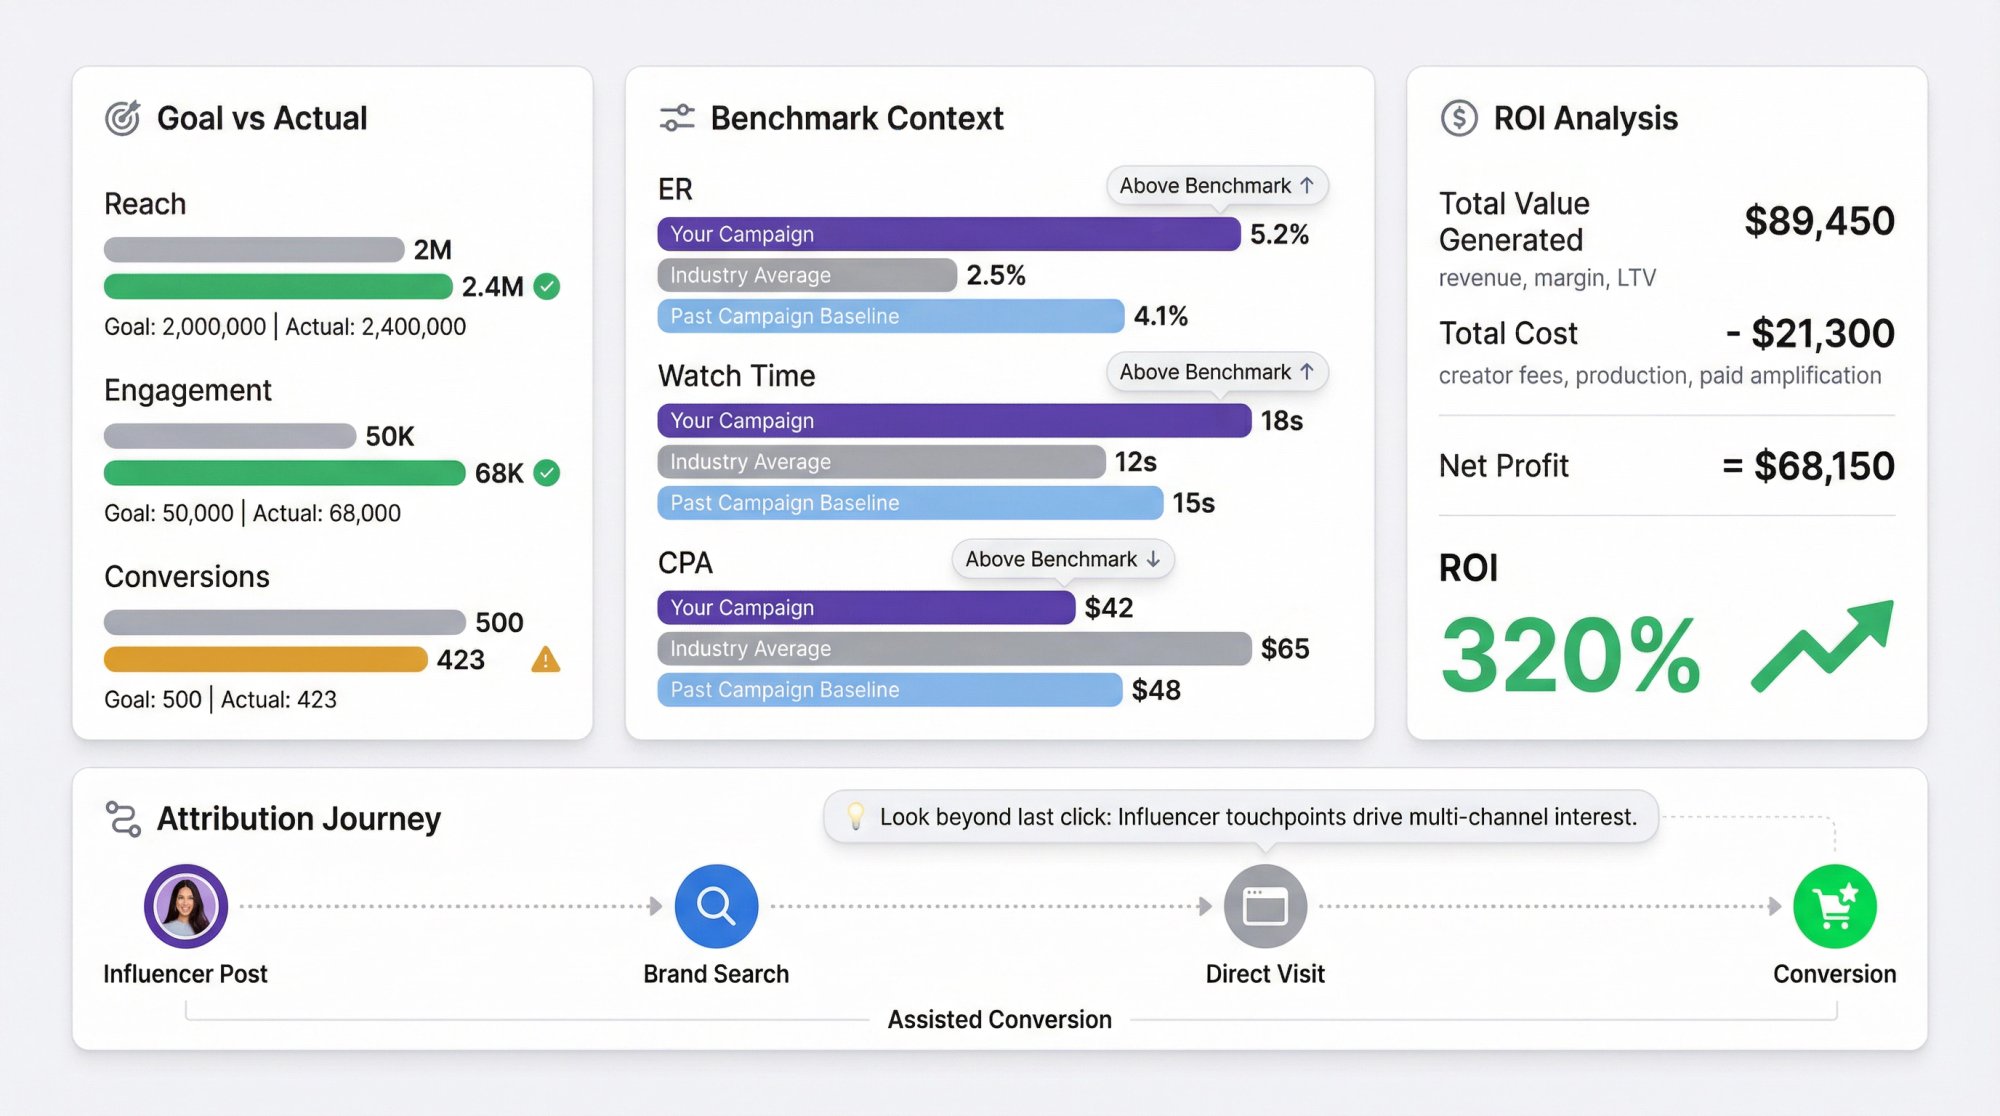
Compare outcomes to goals
Revisit the specific goals you set at the beginning. Did you meet or exceed your targets? Be honest. If a goal wasn't met, that's a learning opportunity for the next campaign.
Establish benchmarks and context
Numbers in isolation don't tell the full story. Always ask, "Is this good or bad compared to expectations or industry norms?" Establish baselines from your past campaigns and use industry benchmarks for context.
Attribution and ROI analysis
Do a thorough ROI analysis. Tally up total value generated (revenue, margin, LTV), then divide by total cost (creator fees + production + paid amplification). Document ROI for each influencer individually so you know who to scale.
Look beyond the last click
Check for assisted conversions in your analytics. Did the influencer touchpoint happen early in the customer journey, with other channels closing the deal? Check overall sales lift during the campaign period. Surveys can fill in attribution gaps. Influencer impact often works across multiple touches.
Quality of engagement
Dive into qualitative feedback. Sentiment analysis can quantify positive vs negative reactions. But reading through comments yourself provides color that metrics miss.
Influencer performance comparison
If you worked with multiple influencers, compare them on key metrics side by side. Often a handful of influencers drive the majority of results. Identify your top performers and consider deepening those relationships.
Use influencer tracking tools to compare performance across multiple creators efficiently.
Micro vs macro insights
Data often shows multiple micro-influencers outperform a single macro-influencer because of diversified audiences, higher engagement rates, and better total engagement for the cost.
Learn and iterate
The most important step is using findings to optimize future campaigns. Document concrete lessons:
"Nano-influencers with 5-10k followers drove highest engagement rates at 30% lower CPA; next campaign we'll allocate 60% of budget to that tier."
"Videos under 15 seconds with product demos in the first 3 seconds converted 2× better than testimonial-style content."
Build a knowledge base your team can reference.
The bottom line
If you want influencer marketing to be a real growth lever (not a monthly reporting argument), do three things:
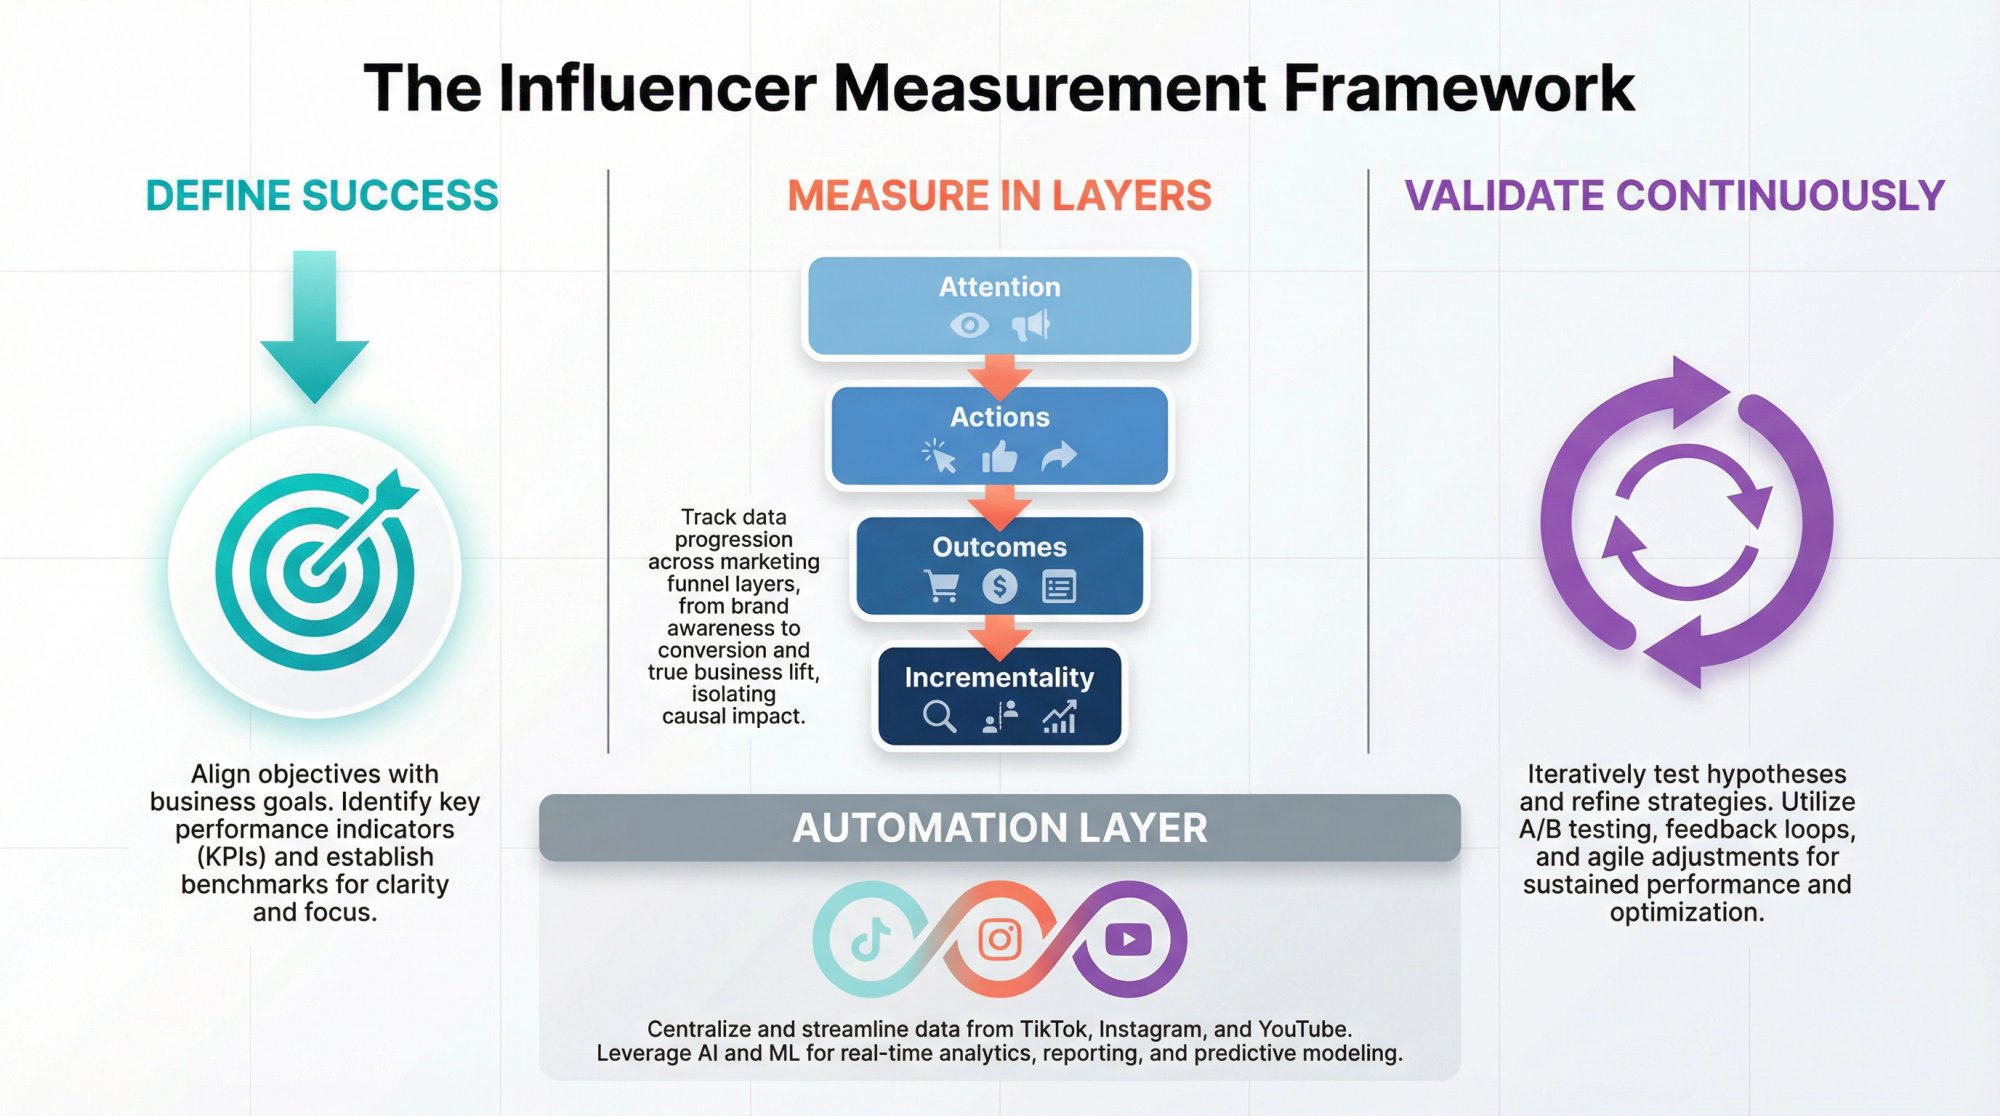
1) Define success by campaign job
Pick one primary metric per campaign. Stop trying to measure awareness and conversions and community and UGC all at once.
2) Measure in layers
Attention (platform metrics) + actions (first-party tracking) + outcomes (conversions) + incrementality (controlled tests). If you skip a layer, you're guessing.
3) Validate with incrementality
Run geo holdouts, audience holdouts, or matched-market tests often enough to stay honest about what's actually working vs what's just harvesting existing demand.
And if you're tracking short-form across multiple creators and platforms, automate the public performance layer. That's where Shortimize fits. It handles the cross-platform data collection so your team spends time deciding instead of copy-pasting screenshots into spreadsheets.
The measurement problem isn't going away. Platforms will keep changing definitions. New formats will emerge. But if you build a system based on layers (content, then behavior, then incrementality) instead of chasing individual metrics, you'll adapt faster than competitors still arguing about vanity metrics.
Ready to streamline your influencer tracking? Start your free 7-day trial or see how leading brands use Shortimize to measure influencer success at scale.