If you're running an agency, consulting practice, or growth team in 2026, you've probably hit this wall already: clients expect polished, branded analytics reports, but building them from scratch every month eats hours you don't have. The problem isn't that data is hard to find. It's that turning raw social metrics into something that looks like your work and reads like your thinking takes real infrastructure.
That need has only gotten sharper this year. Research on 2026 marketing trends shows that short-form video is both the most-used media format among marketers and the highest-ROI content format, while 92% of marketers now use automation for data analysis and reporting. Business pressure has only compounded those numbers: leaders increasingly want direct links between social campaigns and business goals, quantifiable cost savings, and better visualizations.
So the demand for white label social media analytics reports isn't slowing down. It's accelerating. And most teams are still solving it with the wrong question.
The wrong question? "Can I upload my logo?"
That's too shallow. White-labeling isn't really about decorating charts. It's about controlling who gets credit for the insight layer. When a report arrives from your domain, lives on your URL, and sounds like your strategic thinking, the client associates that value with you. When it screams the vendor's brand, some of that value quietly leaks away.
This guide breaks down what white label social media analytics reports actually mean in 2026, which tools handle it (and at what cost), and how to pick the right stack for your specific situation.
What Are White Label Social Media Analytics Reports?
A social media report is a document that compiles and analyzes social performance over a defined period, turning raw metrics into insights that guide strategy and prove ROI. White-label reports extend that concept by applying your brand, or your client's brand, instead of the software vendor's. At the dashboard level, a white-label experience means an analytics interface you can rebrand as your own so the end user never perceives a third-party tool.
Put those three together, and you get a working definition:
A white-label social media analytics report is a reporting layer that combines data, explanation, and branding into something your client experiences as entirely yours.
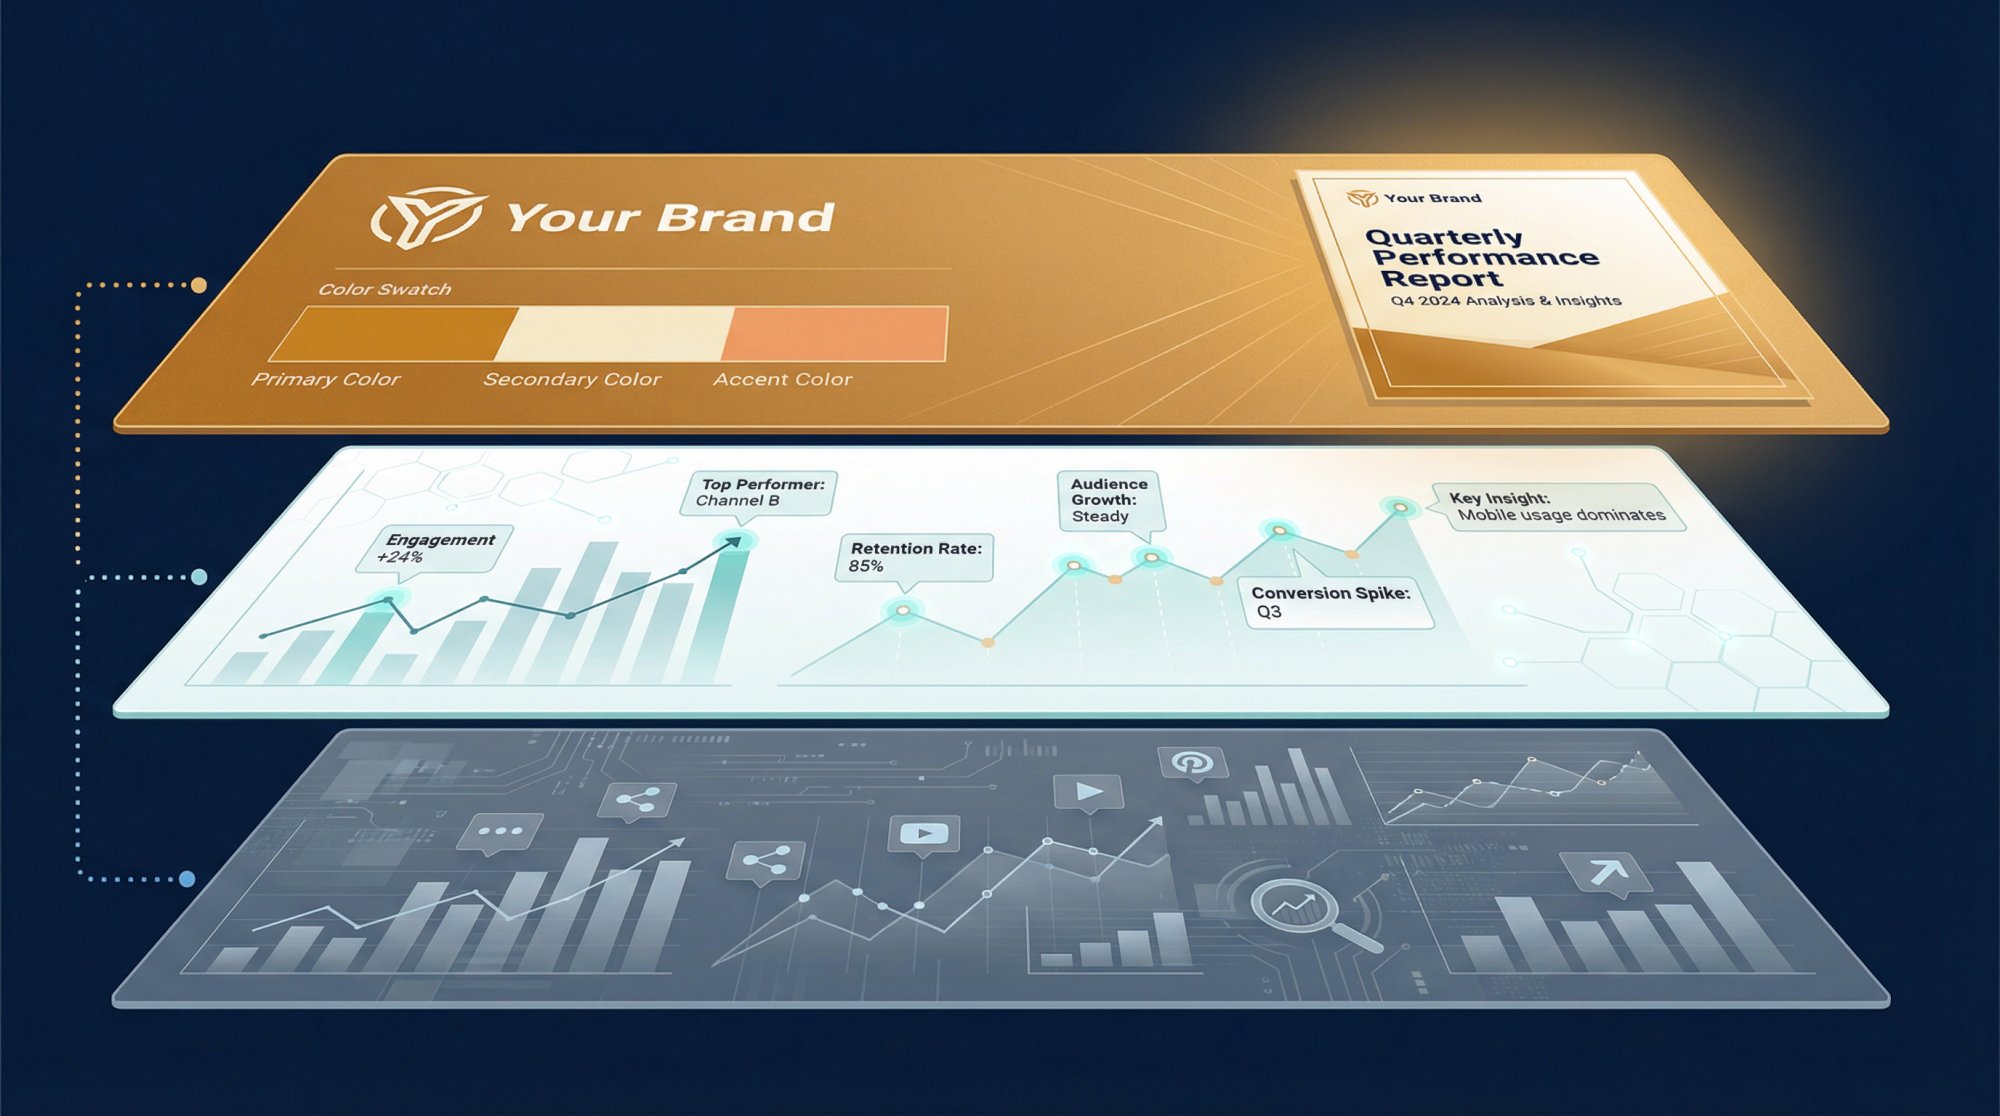
At the most basic level, this matters because clients don't buy charts. They buy confidence. A white-label layer changes who gets credit for that confidence, and that credit is what keeps clients renewing.
The 5 Levels of White-Label Social Media Reporting
Not all white-labeling is the same. The market has settled into roughly five levels, and understanding where each tool sits on this spectrum saves you from buying the wrong thing.
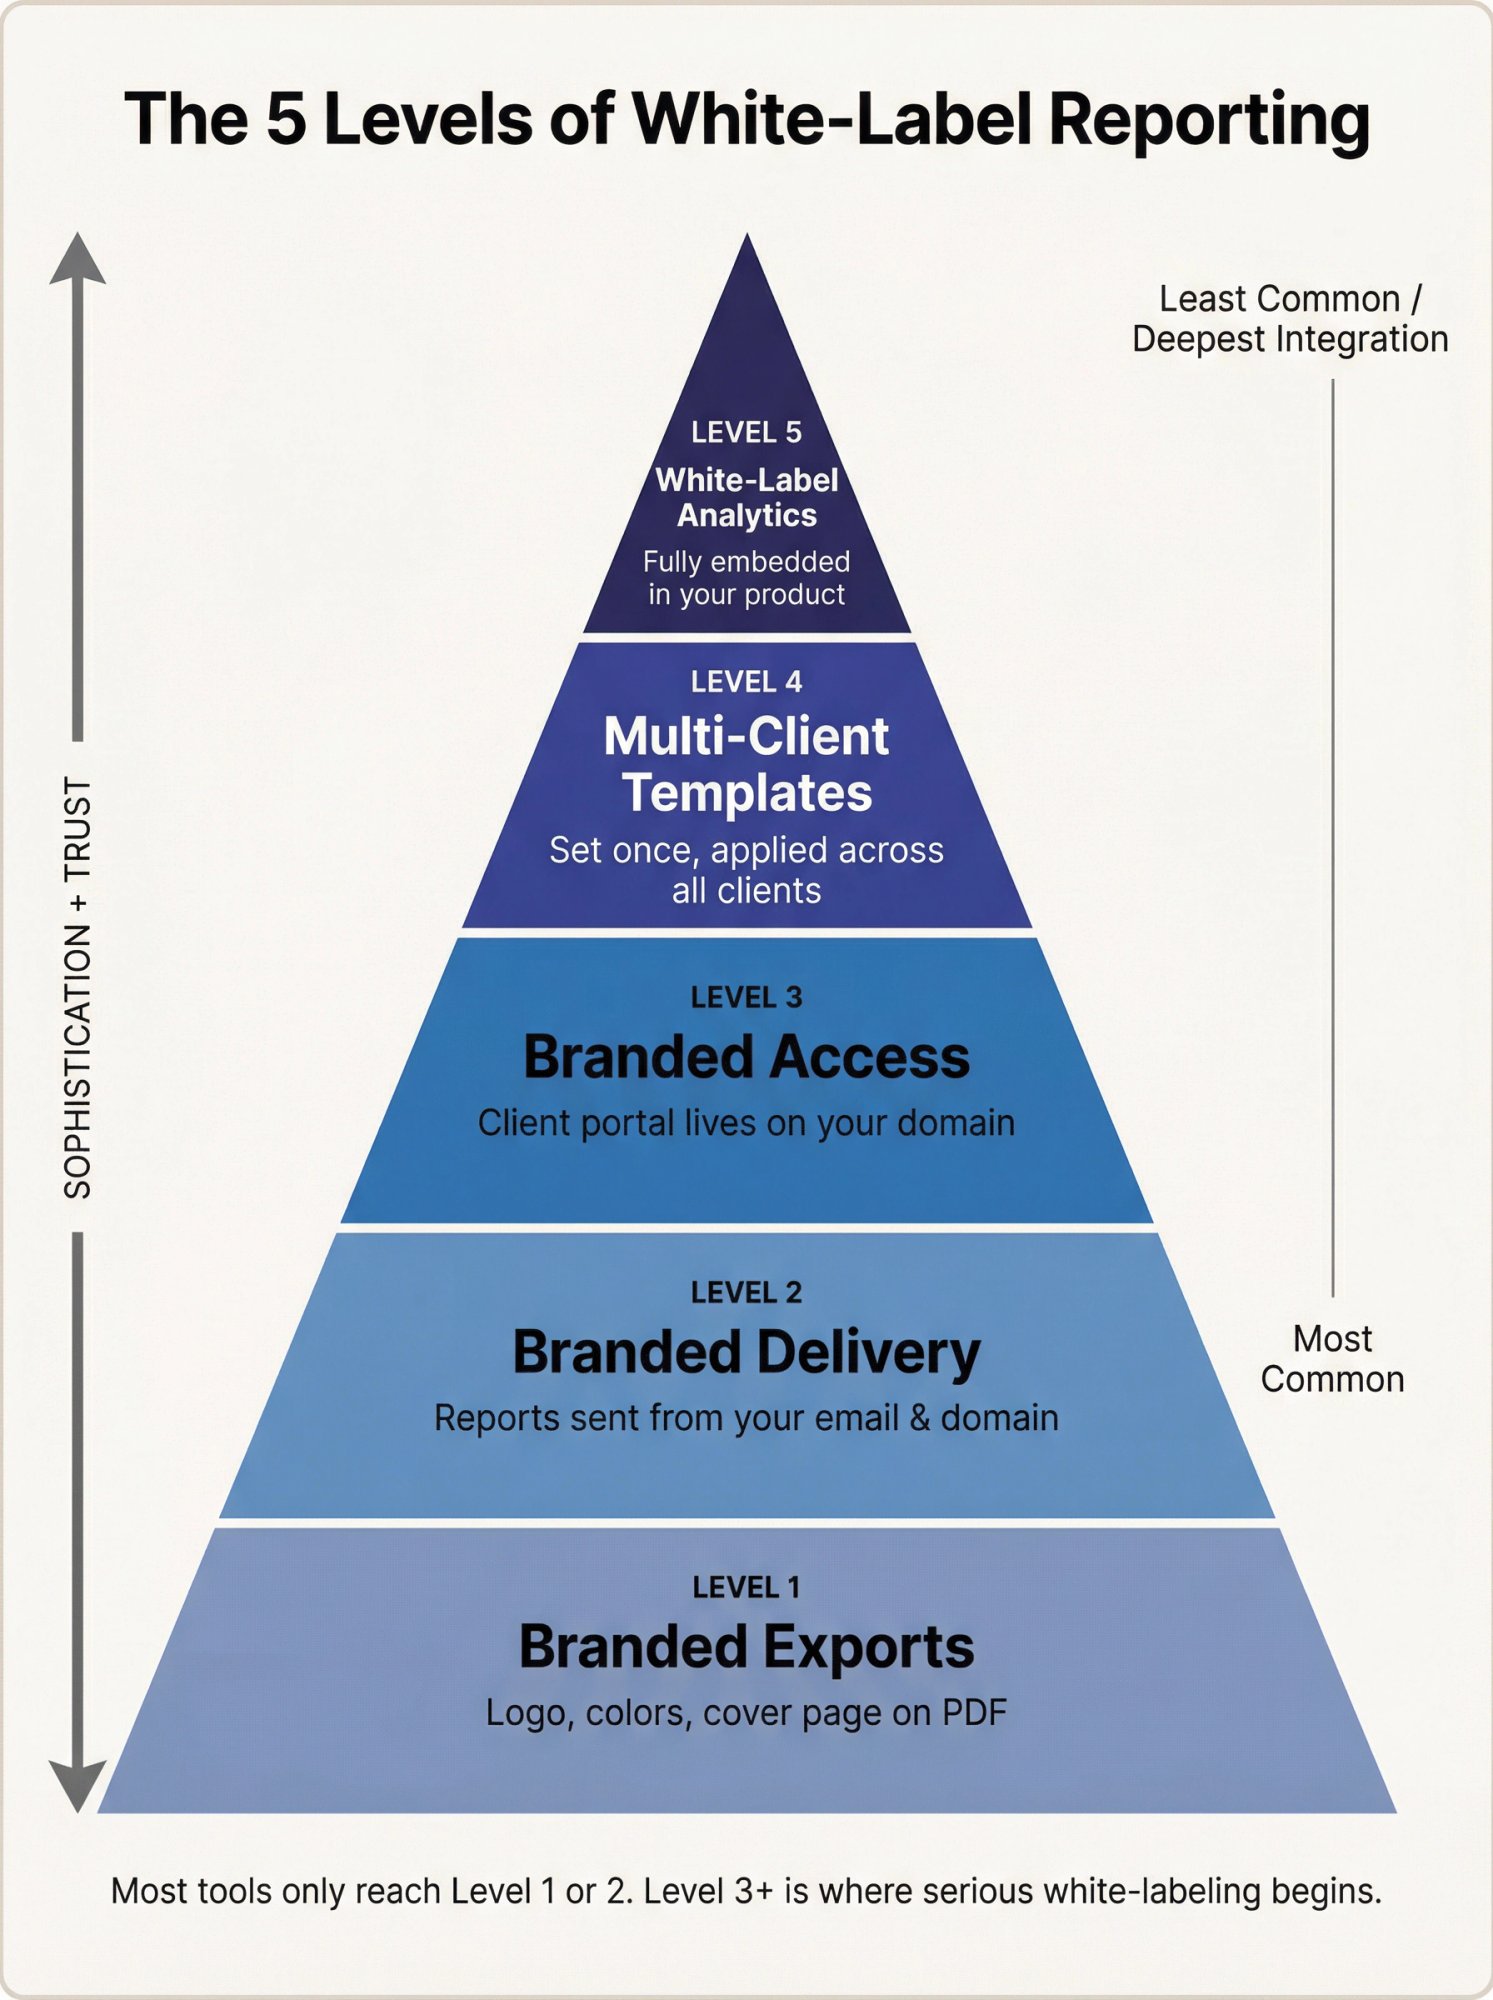
Level 1: Branded Exports
You add a logo, a color theme, and maybe a cover page to a PDF or dashboard.
Level 2: Branded Delivery
Reports arrive from your sender identity (your email, your domain), not the vendor's.
Level 3: Branded Access
Clients log into a portal on your domain or subdomain. They never see the vendor at all.
Level 4: Reusable Multi-Client Templates
You set the brand system once and roll it across every client account automatically.
Level 5: White-Label Analytics
The analytics experience itself can be embedded or presented as part of your own product or service.
Here's how current tools actually map to these levels: DashThis offers custom domains and logos. Swydo offers your own domain, your own email sender, and brand templates. Databox offers a fully branded web app, custom-domain URLs, and automated alerts from your own email. Metricool offers a custom URL, branded reports, branded emails, and client/team access. And Whatagraph offers logos, colors, branded subdomains, and a broader white-label analytics experience.
If a tool only gives you Level 1, call it branded reporting. Don't call it serious white-labeling.
The key takeaway: white-label is not a design feature. It's a trust feature.
Why Agencies Need White Label Social Media Reporting in 2026
Social media monitoring got harder this year, not easier. Short-form video now absorbs more attention and more budget than ever before, which means reports can no longer stop at top-line platform metrics.
The numbers tell the story clearly. Short-form video is the most popular content format among marketers and the top ROI-driving format. That same data shows 44% of marketers now analyze campaign performance weekly, not monthly.
On the client side, the pressure is just as real. Industry research found that 65% of leaders want direct links between campaigns and business goals, 52% want quantifiable cost savings, and 45% want better visualizations.
Buyers aren't just asking for prettier reports. They're asking for:
Clearer business interpretation of social data
Faster reporting cadence (weekly, not monthly)
Less manual work to produce each report
That changes the software decision entirely. The right platform is no longer the one with the nicest PDF export. It's the one that helps you standardize interpretation, automate delivery, and make performance legible across platforms. Tools built for social media engagement tracking have a real edge here.
What Should a White Label Social Media Report Include?
Reporting best practices cut through the noise: reporting should start with audience and goals, include KPI-aligned metrics, run on the right cadence, and add competitor context plus recommendations. The benchmark guidance makes another critical point. Performance without context is easy to misread.
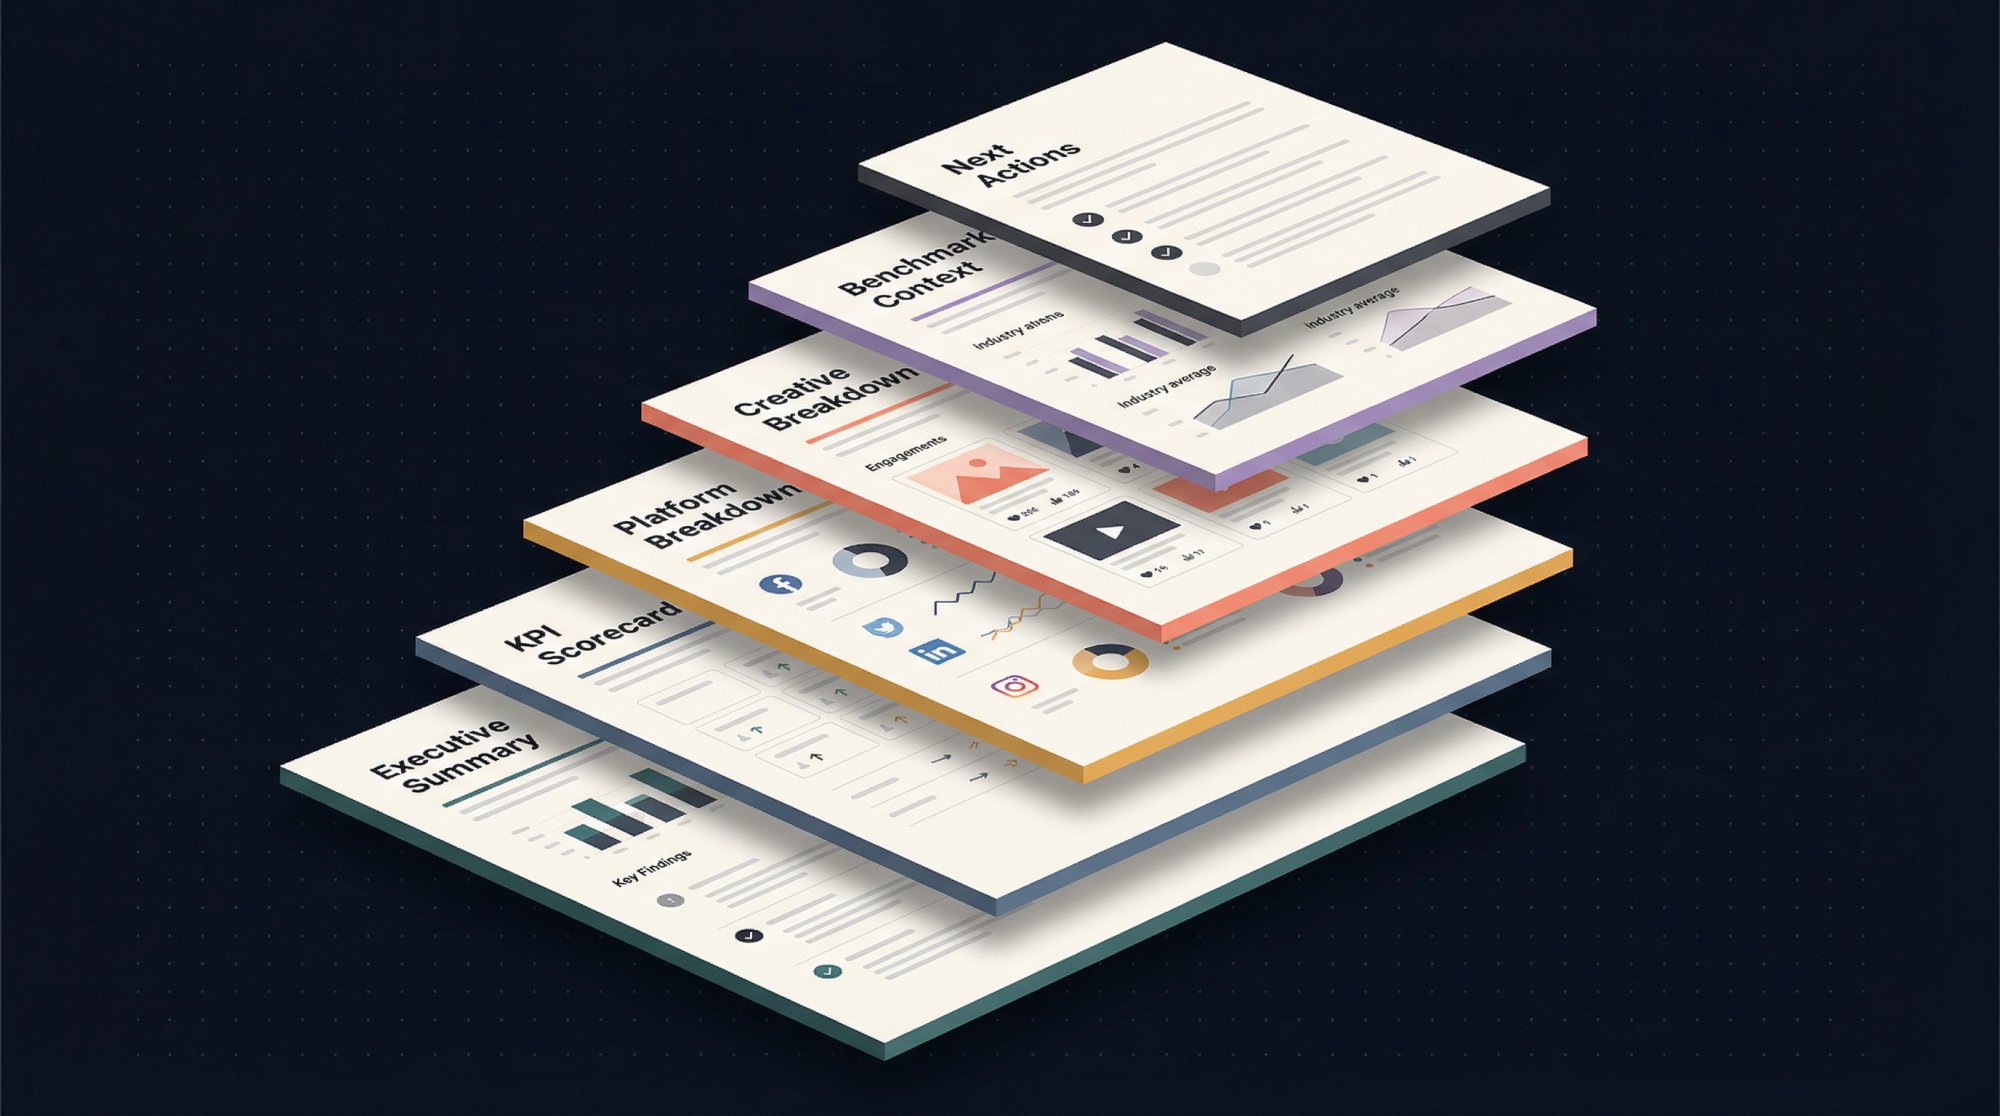
For most agencies, consultants, and in-house teams, the best white-label report structure looks like this:
A one-page executive summary that answers one business question, not ten
A KPI scorecard tied to the client's goal (reach, engagement, traffic, conversions, lead quality, revenue influence, or retention)
A platform breakdown showing what changed and why
A creative breakdown explaining which posts or videos actually drove the result
Competitive or benchmark context so the numbers have meaning
A short decision section covering what to keep, stop, test, and escalate next
This is where many teams still fail. They send branded charts, but they don't send a point of view. White-labeling doesn't rescue shallow analysis. It only makes shallow analysis look cleaner.
How to Structure Short-Form Video Analytics Reports
If short-form video is central to the client's strategy, your report should go well beyond follower growth and raw views. You want to show performance at the creative-pattern level: outliers, median performance, posting cadence, video-length patterns, and the hooks or formats that break away from the baseline.
Shortimize's short-form analysis approach is a strong model for this kind of reporting because it emphasizes median and virality metrics, outlier detection, growth over time, posting schedules, and optimal video-length patterns instead of just account-level vanity metrics.
That's the right mental model regardless of which tools you use. Ask four questions:
→ What is normal performance for this account?
→ What beat the baseline?
→ What patterns repeated across winners?
→ What should we test next?
That's how a short-form report becomes operational instead of decorative. Our guide on how to find viral video patterns in your niche walks through exactly this process.
Why Metric Definitions Are Critical in Cross-Platform Social Reports
Cross-platform reporting breaks when people assume the same word means the same thing everywhere. It doesn't.
A clean 2026 example: YouTube Shorts. YouTube Help confirms that starting March 31, 2025, Shorts views count every time a Short starts or replays, with no minimum watch time requirement. The previous view definition remains available in YouTube Analytics as Engaged views.
Think about what that means for a client report. If you're comparing watch time across TikTok vs Reels vs Shorts without explaining the different counting methods, you're not comparing like with like. You're mixing counting systems, and your client will draw the wrong conclusions.
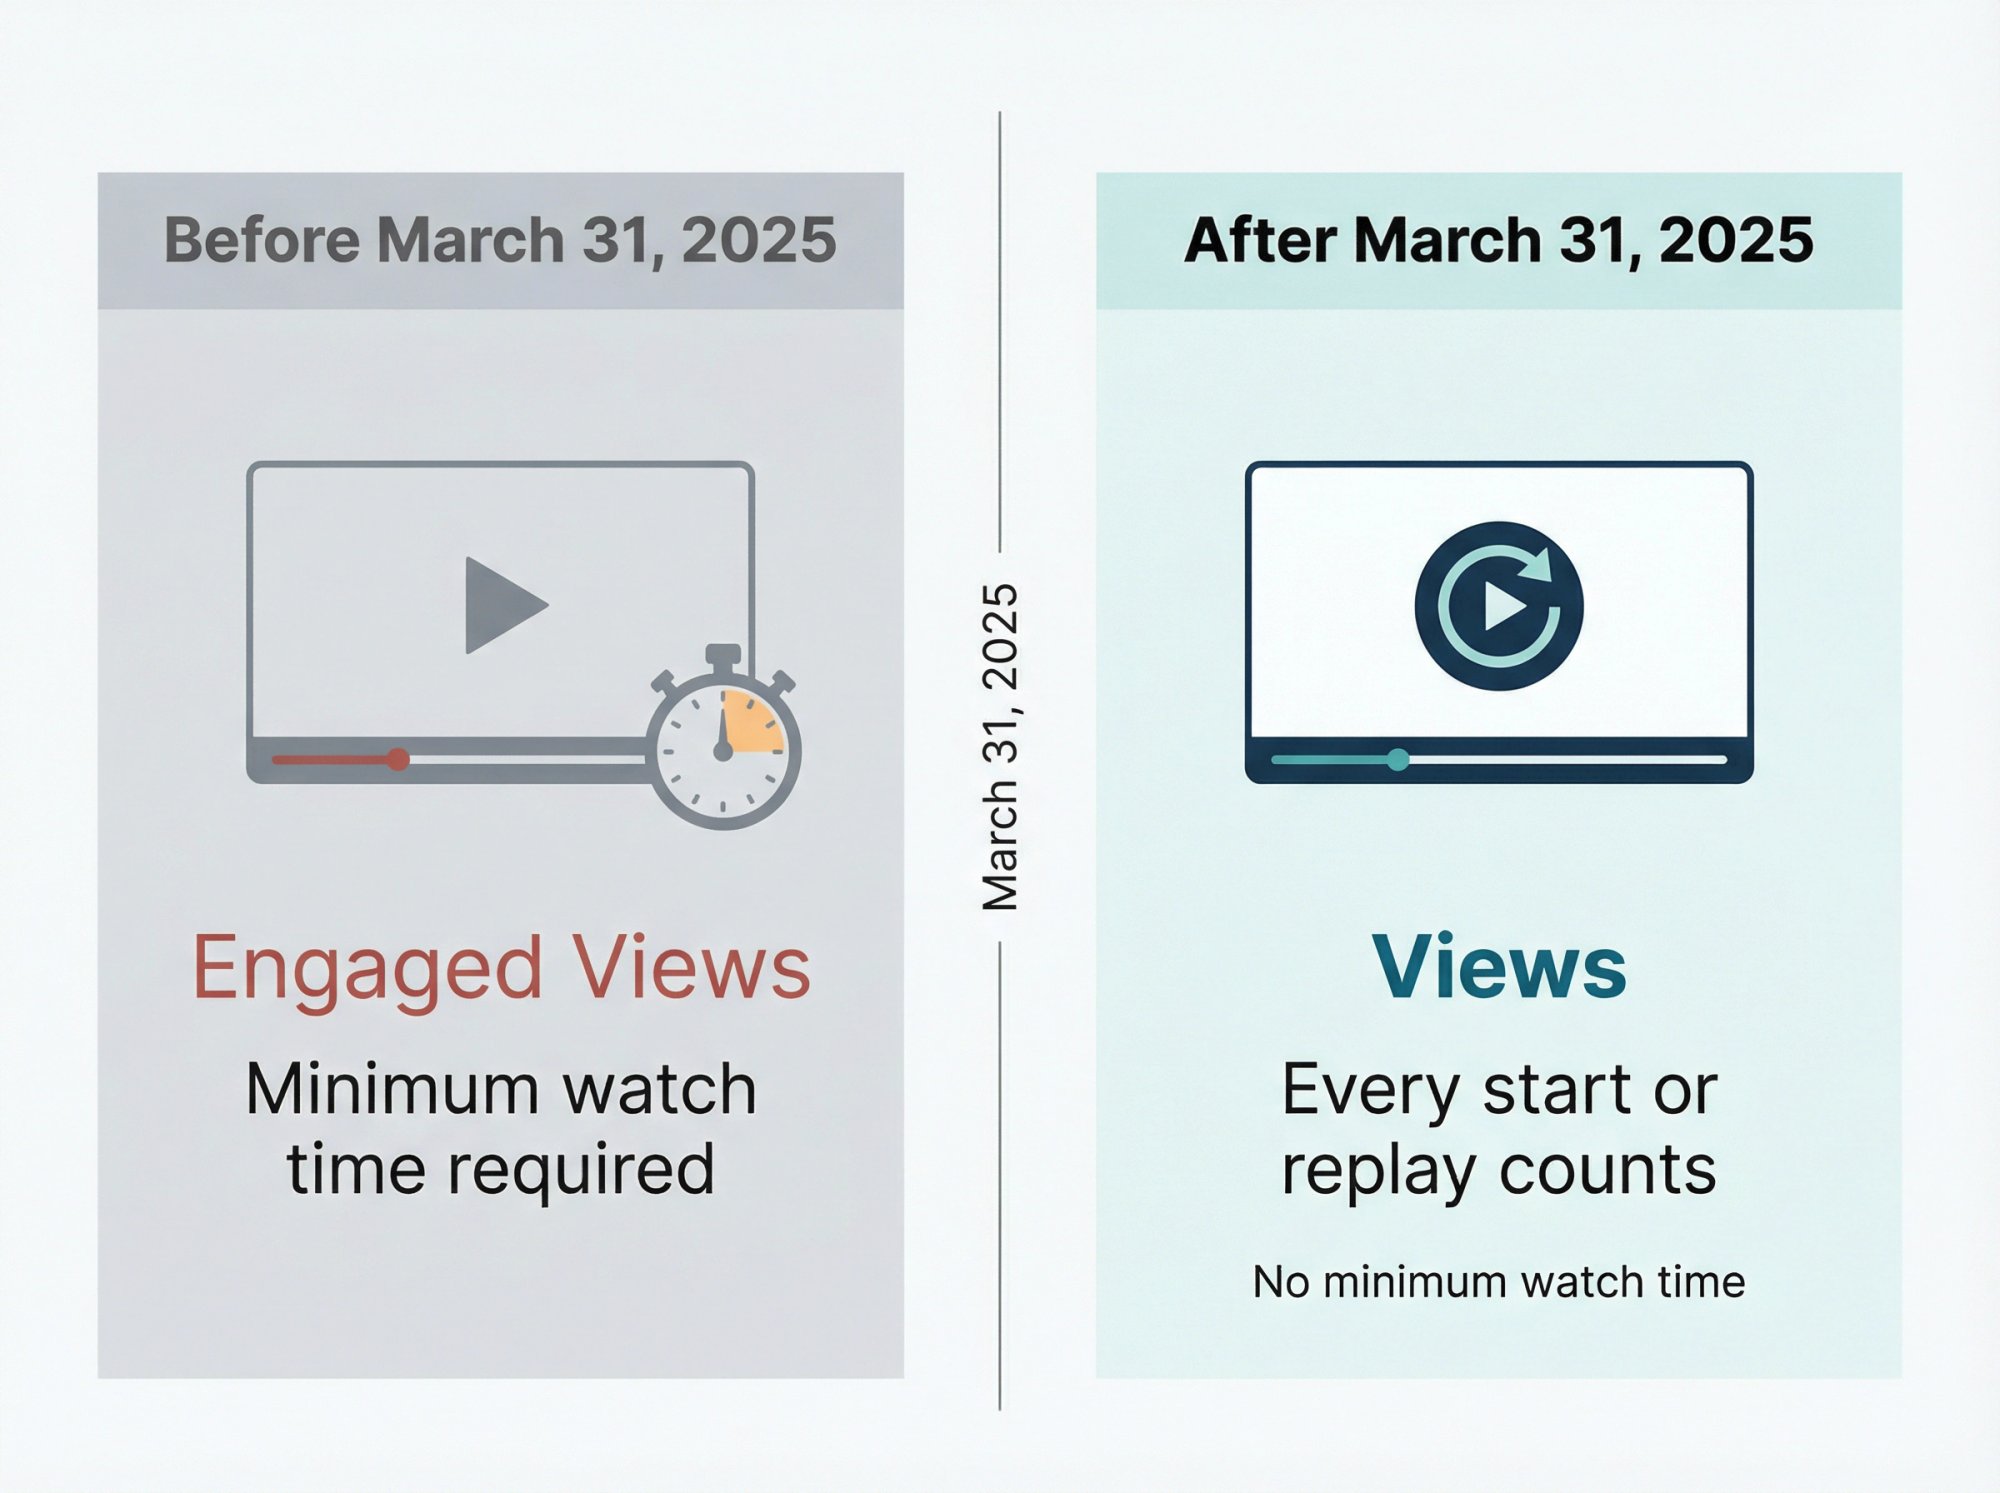
This is exactly why serious social reports need a small metric glossary or methodology note. The more cross-platform your reporting becomes, the more critical those definitions get.
Best White Label Social Media Reporting Tools in 2026
There's no single best tool here because buyers are usually solving one of four different problems: turnkey client reporting, flexible DIY reporting, resellable branded portals, or specialized short-form intelligence. The right answer depends on which problem you're actually trying to solve.
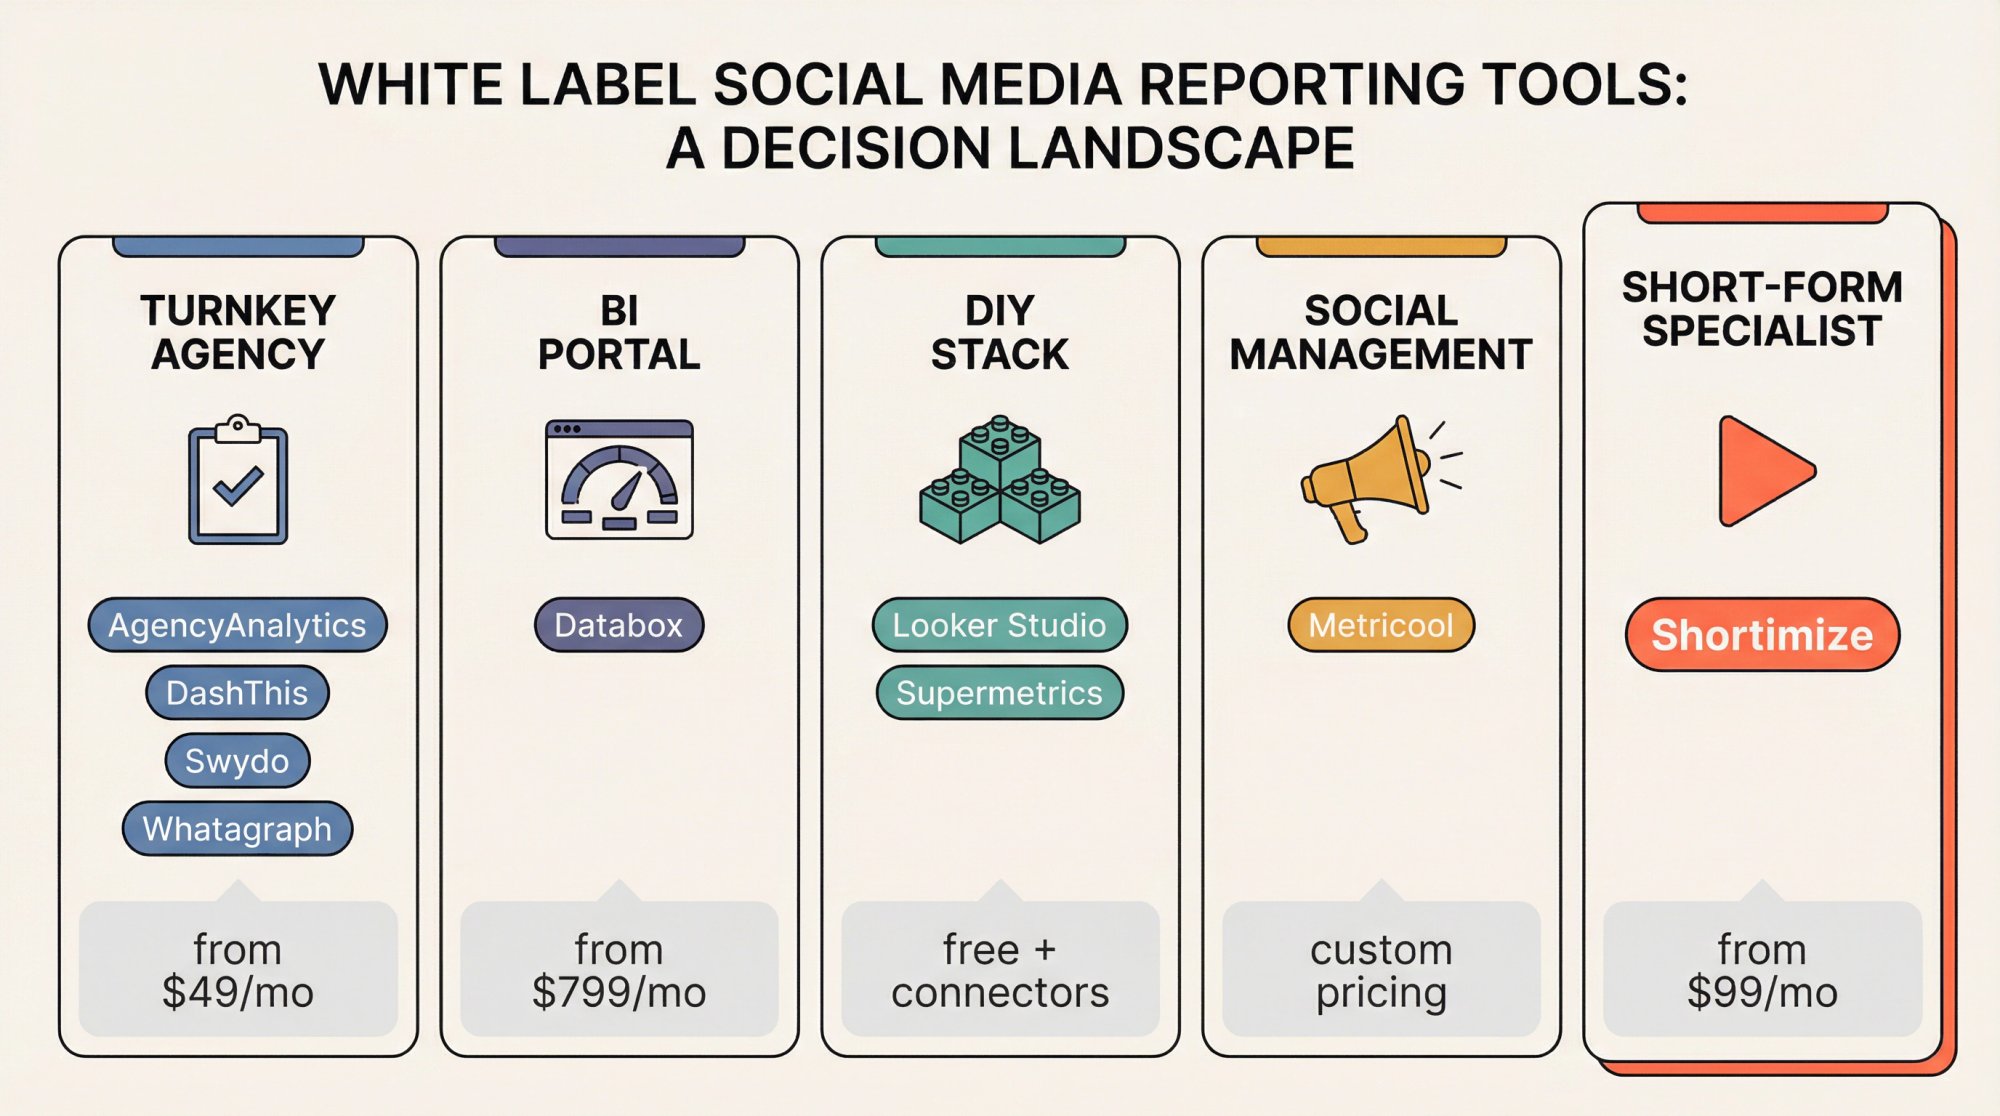
Best Turnkey Reporting Platforms for Agencies
AgencyAnalytics is built squarely for agencies that need broad marketing reporting across many clients. White-label reporting and client-facing dashboards are core capabilities, with branding controls that include client logos, color schemes, cover pages, and email domains. Pricing starts at $59 per month, and clients can connect as many of its 85+ integrations per client as needed. If you run SEO, paid media, email, and social together, AgencyAnalytics is one of the first platforms worth shortlisting.
DashThis is simpler and lighter. The white-label features focus on custom domains, logos, and themes. One helpful nuance: DashThis defines one dashboard as one marketing report that can contain multiple platforms and metrics, so the commercial model is per report/dashboard, not per connected client. Current public pricing shows $49/month for 3 dashboards, $159 for 10, $309 for 25, and $479 for 50+. But there's a catch: a source-based pricing model is coming March 30, 2026. Verify the live billing model before committing.
Swydo is especially strong on the mechanics of branded delivery. Reports can be hosted on your own domain, sent from your own email, and styled with brand templates that apply across clients automatically. Public pricing starts at $69 per month including 10 data sources, with additional source-based pricing after that. The nuance that matters: a "data source" is each connected account inside an integration, so cost scales with account count, not just report count.
Whatagraph leans toward presentation-grade reporting. Features include live links, password protection, media widgets for creatives, spreadsheet exports, templates, branded subdomains, and brand controls like logos, colors, and comment boxes. White-label is available as a paid add-on on any plan, but the price is quote-based rather than publicly posted. If your reports need to look polished in meetings and you value live dashboards over static exports, Whatagraph is a strong fit.
Branded Analytics Portals: BI-Style Solutions
Databox fits when you want something closer to a branded client portal than a simple reporting layer. Features include fully branded dashboards, custom-domain URLs, alerts and scorecards sent from your own email, and a fully branded web-app experience.
The pricing needs caution. Databox's main pricing page lists Premium at $799 per month billed annually with 50 data sources included, while its dedicated white-label page says the custom-domain and white-label package is available for an additional $250 per month. The product clearly supports white-labeling, but the exact commercial terms should be confirmed directly because the current public pages don't present one clean number.
How to Build a DIY White Label Reporting Stack
Looker Studio is still the cheapest flexible entry point. Google positions it as easy and free, with access to 1,000+ data sets. Pair it with Supermetrics (currently listing Starter from $37/month, Growth from $199/month, and Pro from $499/month) and you get a flexible reporting stack that can send data to Looker Studio, Google Sheets, Excel, or Power BI.
The tradeoff? This is a reporting canvas plus connector layer, not a turnkey white-label client portal with built-in sender domains, client logins, and branded web apps. It's great when you have analyst or ops talent in-house and want control more than convenience.
White Label Social Media Management Platforms
Metricool is worth mentioning because its white-label offer goes broader than reports alone. The package includes a custom URL, your logo and brand colors, branded automatic reports, emails without external signatures, and client/team access that looks like your own platform. This sits inside Metricool's Custom plan rather than a publicly priced tier. If your priority is a branded social media management experience with reporting included, this category can make more sense than a pure analytics tool.
Short-Form Video and Public Account Reporting Tools
This is the category that most generic white-label reporting guides skip entirely. If your clients care about TikTok, Instagram Reels, YouTube Shorts, influencer audits, creator monitoring, or competitor tracking on accounts you don't own, you need to test that requirement explicitly. Don't assume every reporting tool handles it.
Shortimize stands out here because we've built the platform specifically around tracking public short-form accounts by handle or URL across TikTok, Instagram, YouTube, Facebook, Snapchat, and X/Twitter. We organize tracked accounts and videos into collections, surface median and virality metrics, and spot outliers over time. Our TikTok analysis page specifically emphasizes complete video lists, outlier detection, posting schedules, optimal video lengths, and performance patterns. And our influencer tracking content explicitly shows how to analyze accounts you don't own.
The TikTok analysis experience starts with a single search — paste any public account handle or video URL and Shortimize surfaces the full performance picture without requiring OAuth access to the account.
As of March 2026, Shortimize's pricing lists Launch at $99/month, Scale at $249/month, and Enterprise custom. White-label is available as an Enterprise option, and API, webhooks, and MCP access are available on higher tiers.
That makes Shortimize a different kind of buy. We're not trying to be a generic all-channel reporting canvas first. We're strongest when the reporting problem is specifically short-form video intelligence.
How Much Does White Label Social Media Reporting Cost in 2026?
As of March 2026, public entry pricing spans a wide range. But the bigger issue is that vendors meter very different things. Here's how the landscape breaks down:
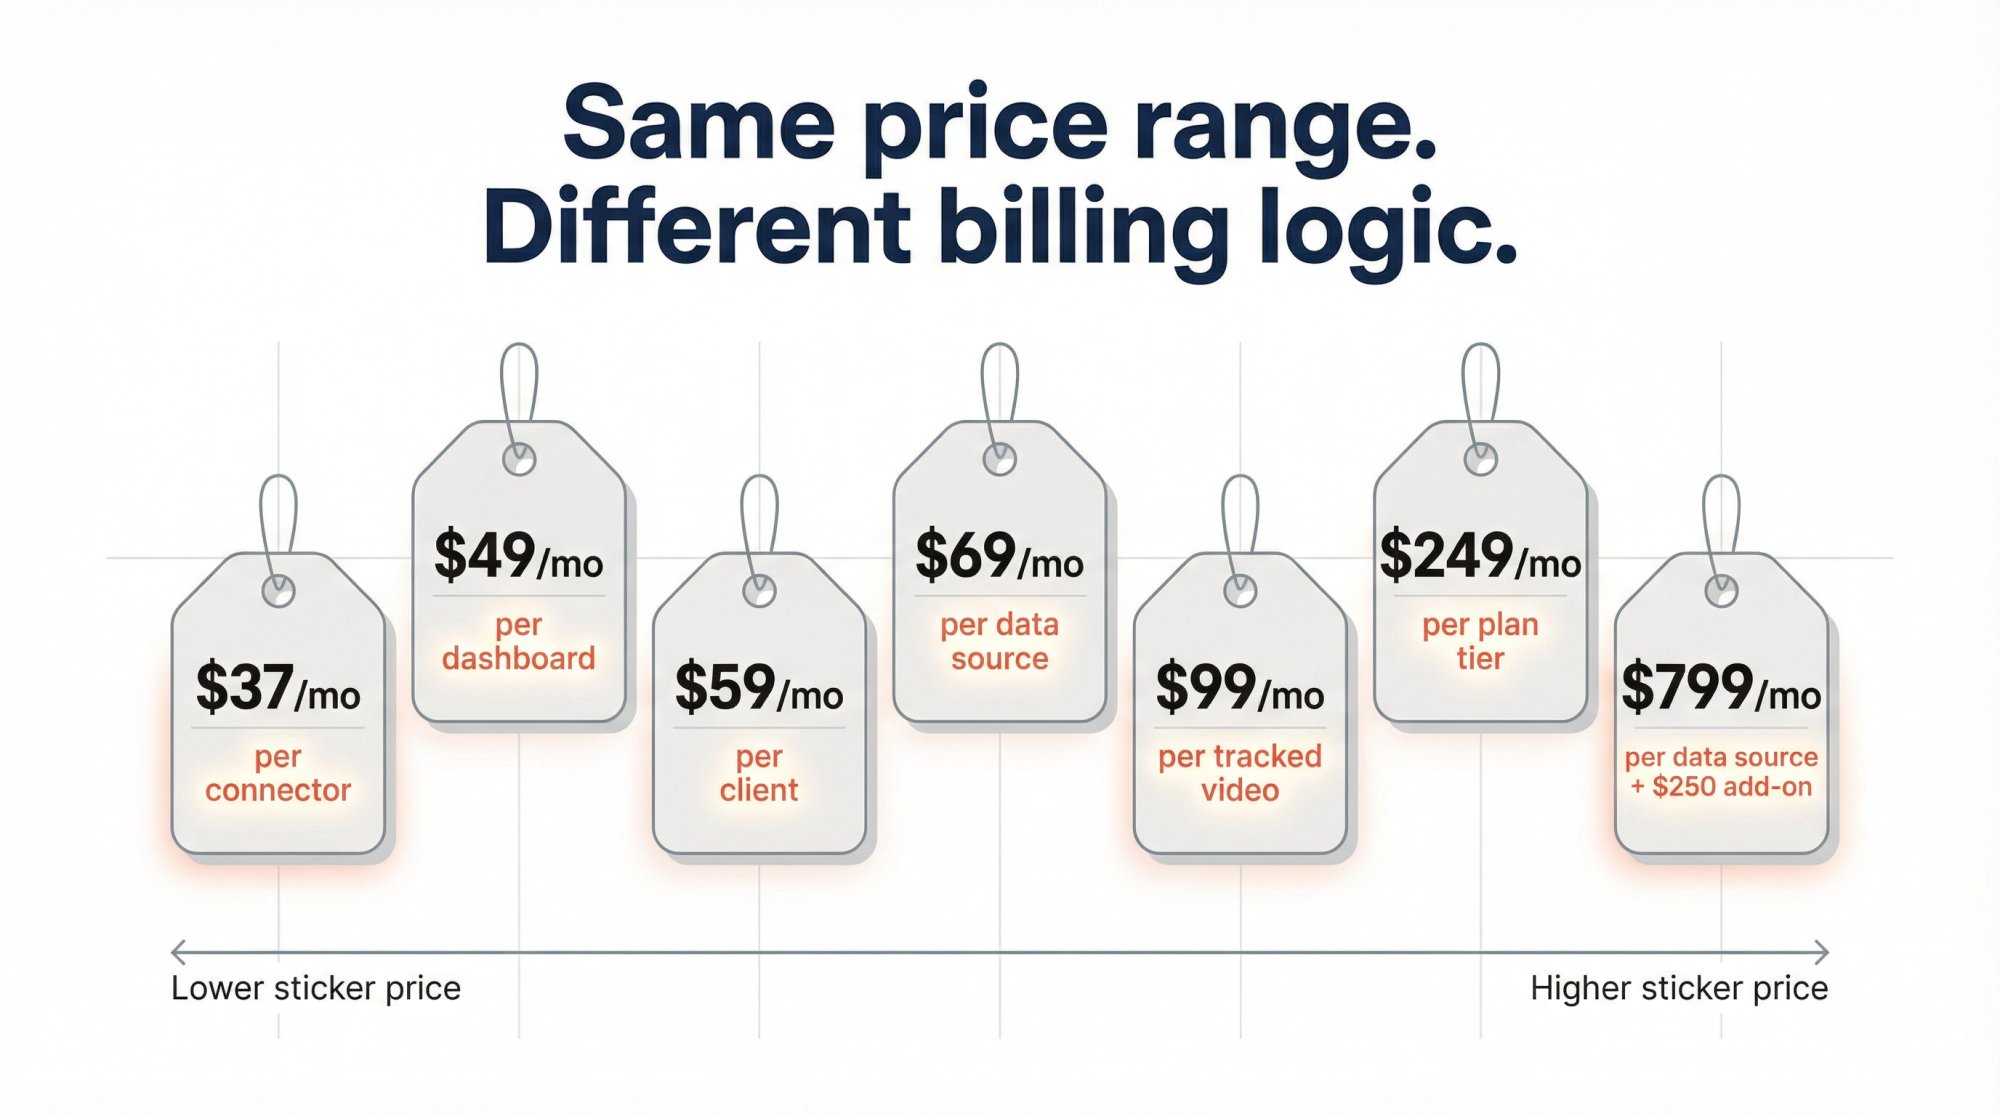
| Platform | Starting Price | Billing Model | White-Label Approach |
|---|---|---|---|
| AgencyAnalytics | $59/month | Per client/integration | Included in plans |
| DashThis | $49/month | Per dashboard (transitioning to source-based) | Included |
| Swydo | $69/month | Per data source | Included |
| Whatagraph | Quote-based | Per plan tier | Paid add-on |
| Databox | $799/month (Premium) | Per data source | Add-on ($250/month) |
| Supermetrics | $37/month | Per connector | N/A (connector only) |
| Metricool | Custom plan | Per tier | Inside Custom plan |
| Shortimize | $99/month (Launch) | Per tracked videos | Enterprise option |
The practical lesson is simple: don't compare sticker prices until you know the billing unit. Ask whether you're paying per dashboard, per client, per data source, per workspace, or per white-label add-on. That one question will save you from most pricing surprises.
6 Questions to Ask When Evaluating White Label Reporting Tools
Before you buy anything, run through these. They'll separate the tools that actually fit your workflow from the ones that just look good on a features page.
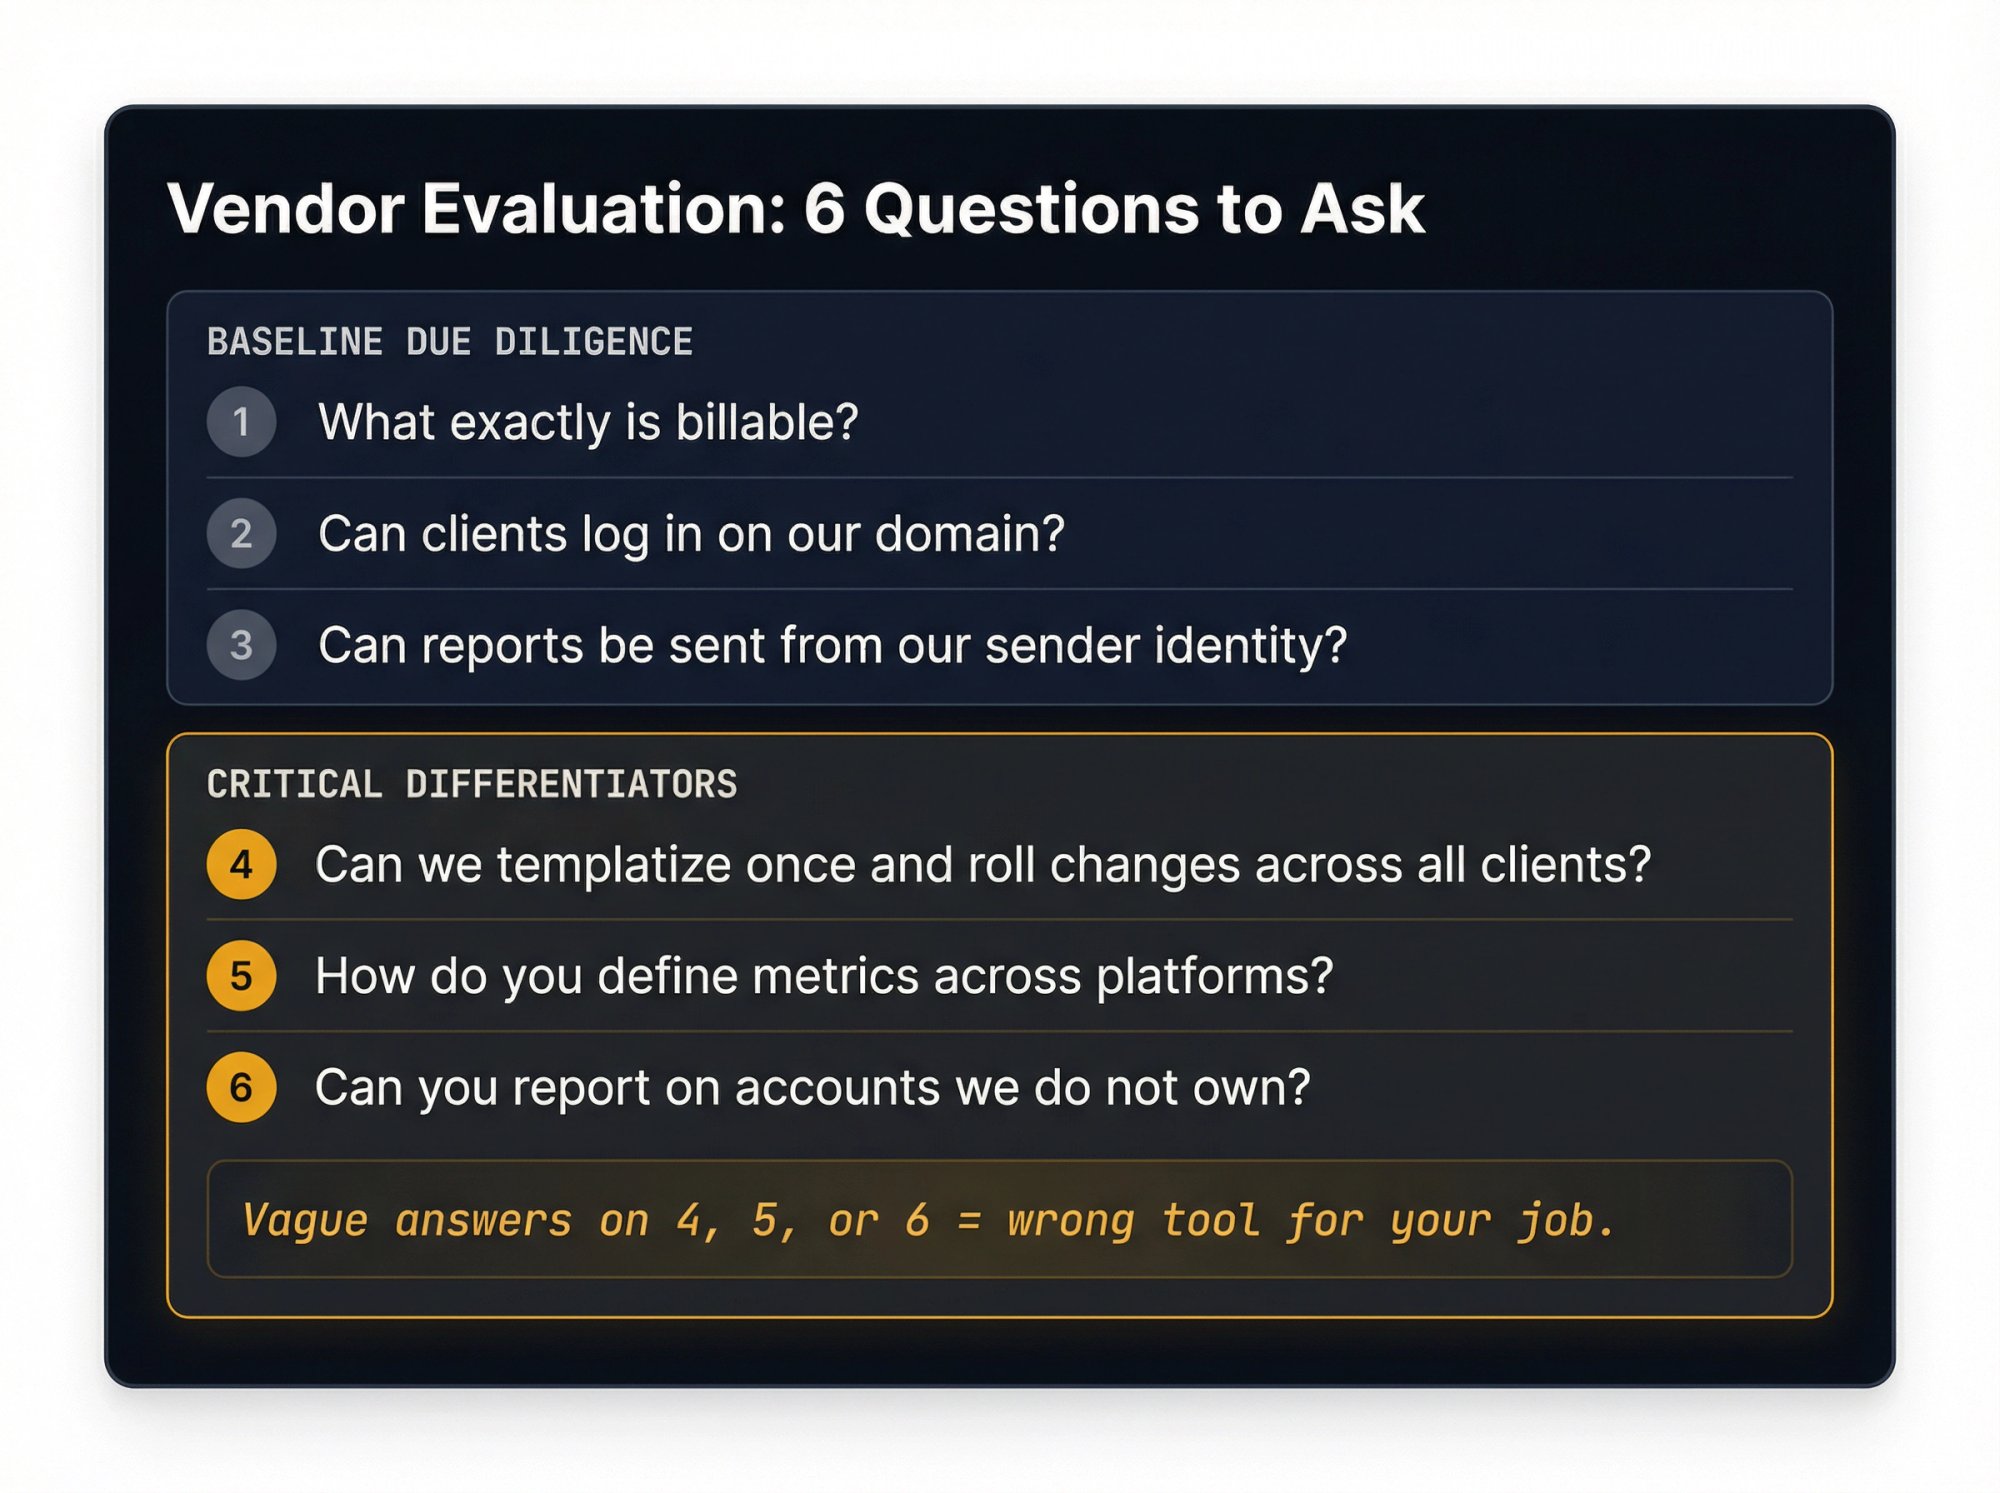
1. What exactly is billable?
Dashboards, clients, data sources, seats, portals, and white-label add-ons are not the same thing. A tool that prices per dashboard might be cheap at 5 clients and expensive at 50.
2. Can clients log in on our domain?
If the answer is no, you're buying branding, not a real white-label experience. Your client will still see the vendor's URL, and that undercuts the whole point.
3. Can reports be sent from our sender identity?
Branded dashboards with vendor-branded emails still leak value. The email is often the first thing clients see, and it sets their expectation for whose work they're reviewing.
4. Can we templatize once and roll changes across all clients?
Without this, scale disappears fast. If you're manually customizing reports for 30 clients, you've just created a reporting operations job.
5. How do you define metrics across platforms?
If the vendor can't explain their methodology clearly, the report will confuse clients later. This is especially critical for short-form video, where platforms count views differently (as we covered with YouTube Shorts above). Our post on qualified views vs total views explores this exact problem in depth.
6. Can you report on accounts we don't own?
This is the make-or-break question for influencer, competitor, and public-account reporting. Many tools only work with accounts you connect via OAuth. If your value proposition includes tracking competitors or auditing creators, you need explicit support for public-account data.
If a vendor is vague on questions 4, 5, or 6, that's usually a sign you either need a specialist layer or the tool was built for a different job than the one you actually have.
How to Choose the Right White Label Reporting Stack
Different use cases lead to different answers. Rather than ranking tools in some artificial order, here's a decision framework based on what you're actually trying to accomplish:
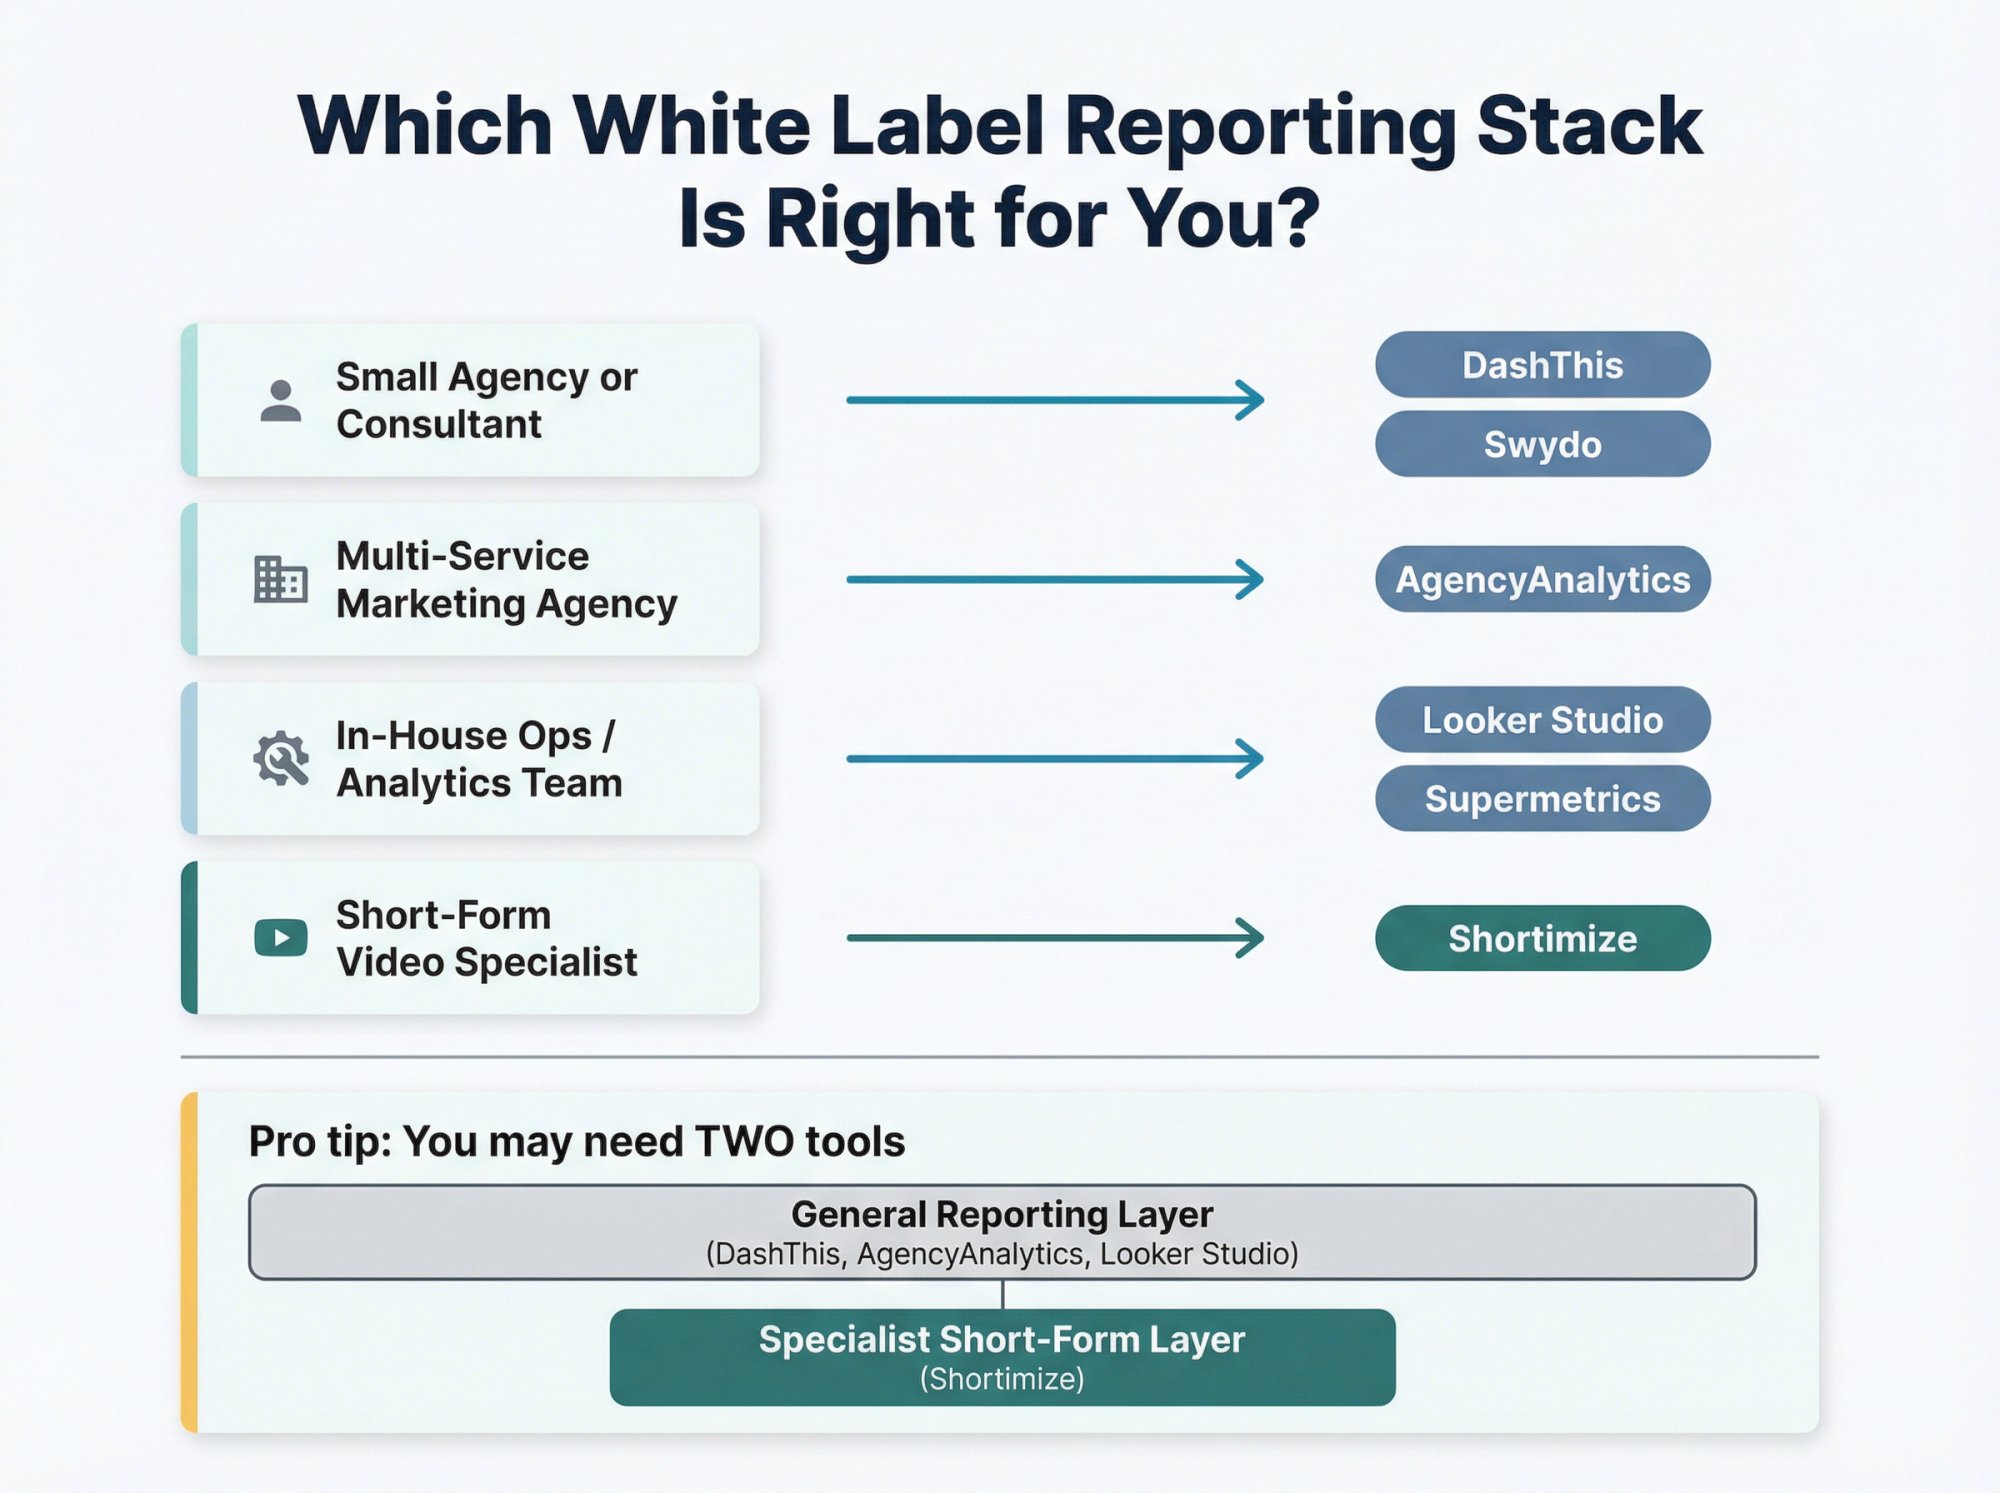
If you're a small agency or consultant who wants polished recurring reports on connected accounts fast, DashThis or Swydo are usually the shortest path.
If you run a broader marketing agency and need lots of integrations, client workspaces, and multi-service reporting, AgencyAnalytics is a stronger starting point.
If you have internal ops or analytics talent and want maximum flexibility for the lowest starting cost, Looker Studio + Supermetrics is often the best value.
If your reporting advantage is short-form video intelligence, competitor tracking, or creator analytics on public accounts, you should seriously consider a specialist layer like Shortimize instead of forcing a generic reporting platform to solve a fundamentally different problem.
And here's one more hard truth worth sitting with: you may need two tools, not one. A general reporting platform can be great for paid media, web analytics, and connected social sources. A specialist platform can be better for short-form public-account tracking, influencer monitoring, and creative-pattern analysis. Trying to force one platform to do everything is often how reporting stacks get bloated and mediocre.
When to Choose a Specialist Short-Form Analytics Platform
Shortimize is most compelling when the core value of your service isn't "we send nice reports," but "we understand short-form better than everyone else."
Here's what we've built the platform around:
Cross-platform tracking of public accounts across TikTok, Instagram Reels, YouTube Shorts, Facebook, Snapchat, and X/Twitter (learn more on our social media monitoring page)
Collections for managing hundreds of accounts and thousands of videos in organized sets
Short-form performance analysis with median metrics, virality scores, and outlier detection
Posting cadence and video-length pattern analysis to surface what's actually working
API, webhooks, and MCP access on higher tiers for pushing data into your own warehouse or BI workflow. See our social media analytics API documentation
Enterprise white-label option so your clients see your brand, not ours
Our social media monitoring capabilities also frame a more advanced use case: take normalized short-form analytics and calculate your own KPIs consistently across platforms inside your data warehouse or BI workflow. For agencies doing creator reporting, influencer discovery, competitive short-form monitoring, or client-facing short-form intelligence, that's a very different value proposition from a generic monthly PDF tool.
If that sounds like your use case, the most useful next steps are our Social Media Monitoring page, our platform-specific account analysis pages (TikTok, Instagram Reels, and YouTube Shorts), and our pricing page where Enterprise includes the white-label option.
White Label Social Media Reporting: FAQs
Are White Label Social Media Reports Just Branded PDFs?
No. In 2026, the stronger platforms go well beyond PDF exports. They offer branded domains, branded sender emails, live dashboards, reusable templates, and in some cases fully branded portal or web-app experiences. If all you get is a logo swap on an export, you've got branded reporting, not a full white-label experience. DashThis's white-label page is one example of what the higher end looks like.
Can I Use Looker Studio for White Label Reporting?
Yes, but think of Looker Studio as a flexible reporting canvas, not a complete white-label client-reporting system out of the box. Google positions it as an easy, free dashboard tool with access to 1,000+ data sets. Teams that want a more turnkey setup usually add a connector layer like Supermetrics and then handle branding, sharing, permissions, and client experience themselves. It works, but it takes more setup than a purpose-built platform.
Can I Report on Social Accounts I Don't Own?
Sometimes, but you need to verify this use case explicitly. Native partnership tools can give brands direct analytics access when set up correctly, but not every reporting platform supports public-account data. Shortimize is built specifically for this: we can analyze short-form performance from accounts you don't own across platforms just by pasting a handle or video URL. If public-account reporting matters to your offer, test that requirement first with any tool you're evaluating. Our guide on how to cross-analyze influencers on TikTok, Reels, and Shorts walks through exactly how this works in practice.
What's the Difference Between White-Label Reporting and White-Label Analytics?
White-label reporting usually refers to branded reports and dashboards. White-label analytics is broader: the analytics experience itself can be rebranded or embedded so it feels like part of your own application or service. The distinction matters because some tools only white-label the output (the report), while others white-label the entire experience (the dashboard, portal, or embedded analytics). This is where Shortimize's Enterprise option lives. It's not just a report wrapper, it's an intelligence layer.
What Should I Look for in a White Label Reporting Tool?
Five things: custom domain support, branded sender identity, reusable templates, clean metric definitions, and support for the exact reporting objects you need. That last point is especially important if your reporting includes public creators, competitors, or short-form video accounts you don't own, because those are the use cases where generic tools most frequently fall short. See how Shortimize's customers have solved exactly this problem.
Key Takeaways: Choosing a White Label Social Media Analytics Stack
The biggest mistake in this market is confusing white-labeling with cosmetics. A logo is cosmetics. A branded analytics experience is infrastructure.
In 2026, the best white-label social media analytics reports do five things at once: they carry your brand, automate your workflow, preserve metric clarity, add business context, and turn raw social data into decisions.

If your reporting job is broad marketing performance across connected data sources, start with AgencyAnalytics, Swydo, Whatagraph, DashThis, Databox, or a DIY Looker Studio + Supermetrics stack. If your reporting job is short-form video intelligence, creator monitoring, or public-account analytics across TikTok, Reels, and Shorts, Shortimize is the more interesting solution because that's the layer we've built to own.
Ready to see how it works? Start your free trial or explore our social media monitoring capabilities to understand the full scope of what's possible.
Data note: all pricing and platform details in this article were checked against public vendor pages in March 2026. Packaging, add-ons, and quote-based white-label terms change frequently, so verify the live commercial model before you sign.