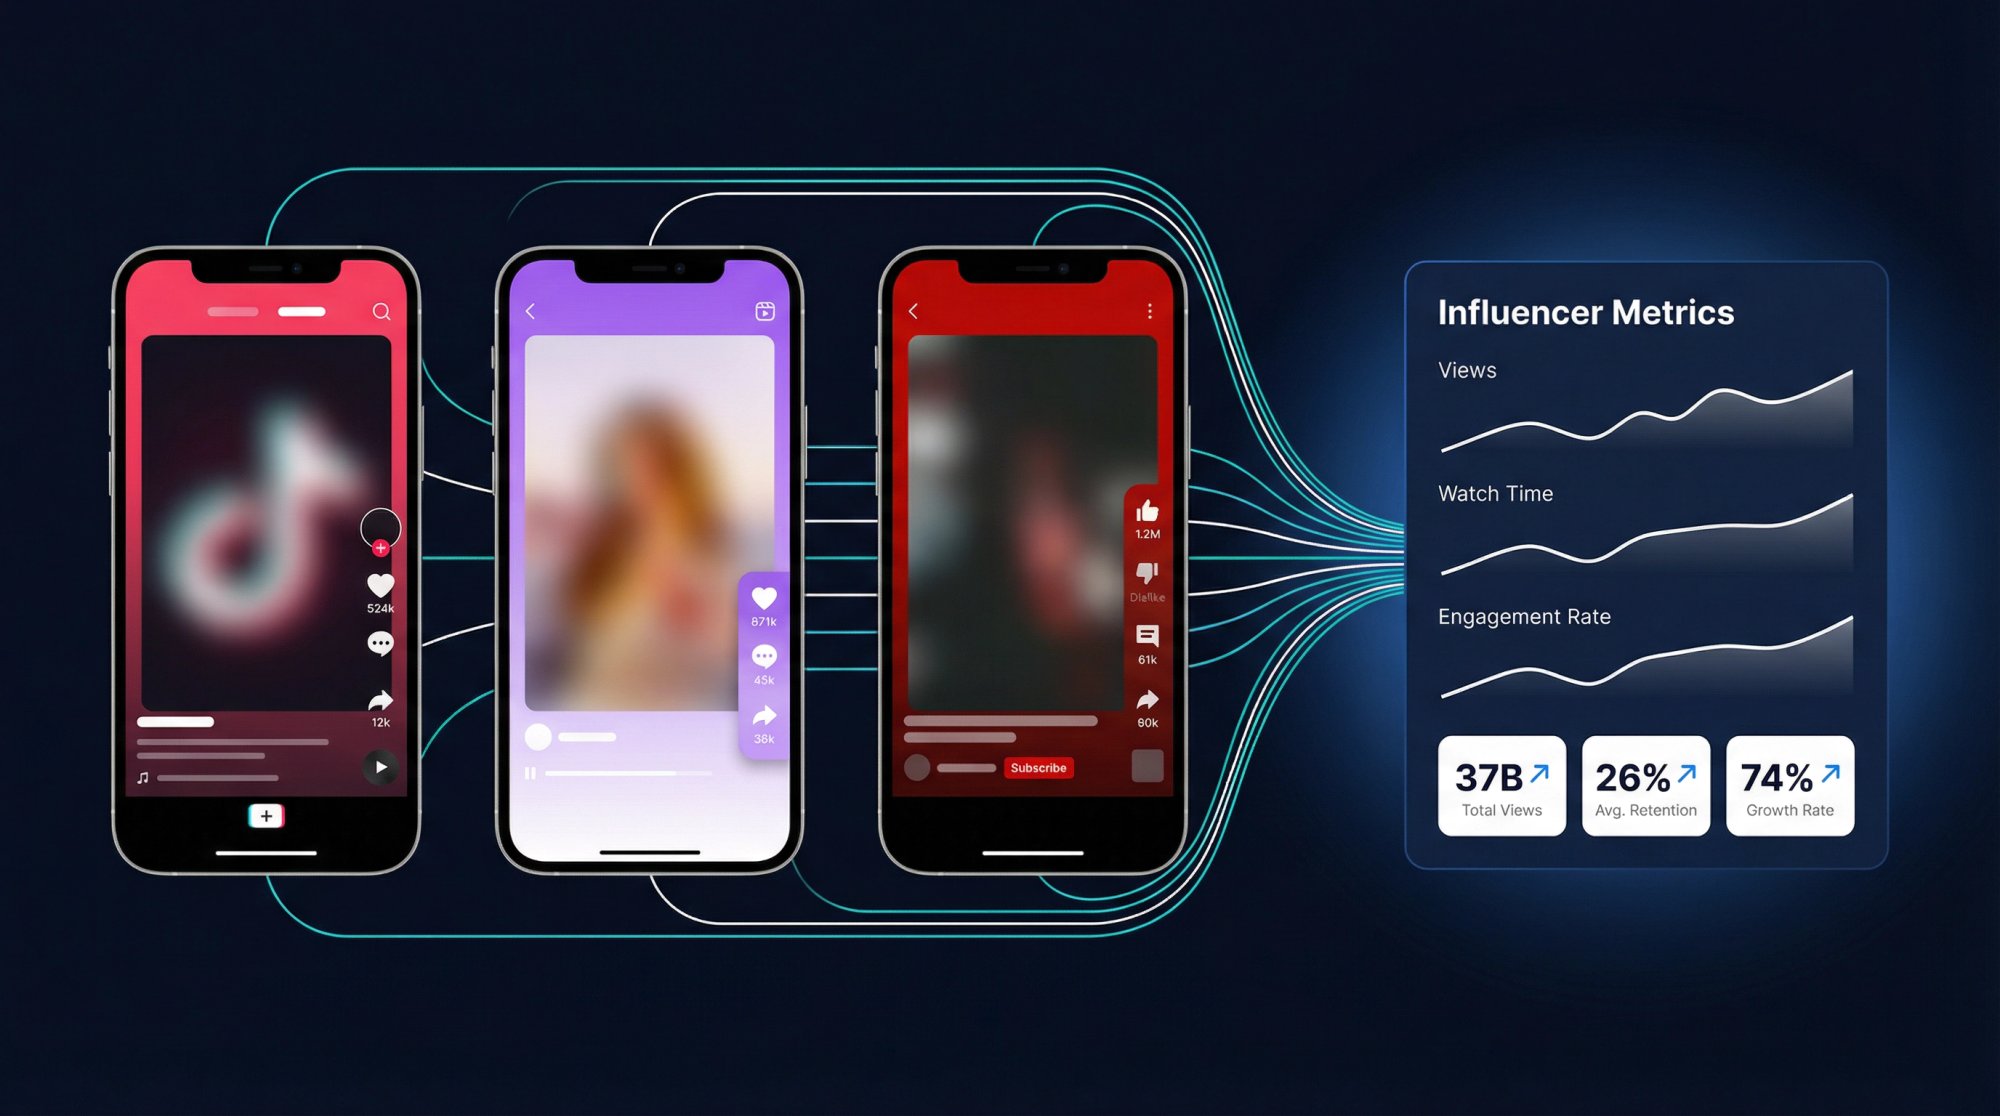
Influencer marketing isn't a side experiment anymore. According to IAB's 2025 creator economy report, U.S. creator ad spend was projected to hit $37 billion in 2025, up 26% year over year. Industry research found that nearly two-thirds of increased influencer budget was reallocated from digital and paid channels. And Aspire's March 2026 benchmark adds that 74% of marketers plan to increase influencer budgets this year.
When that much money is in play, "pretty good engagement" stops cutting it.
Most influencer analysis isn't hard once you strip it to first principles. The tricky part is that most teams still measure the wrong things. Research shows 90% of marketers said sponsored influencer content outperformed brand-posted organic content on engagement, and 83% said it outperformed on conversion. The question isn't whether creator marketing works. It's whether you can tell what actually worked.
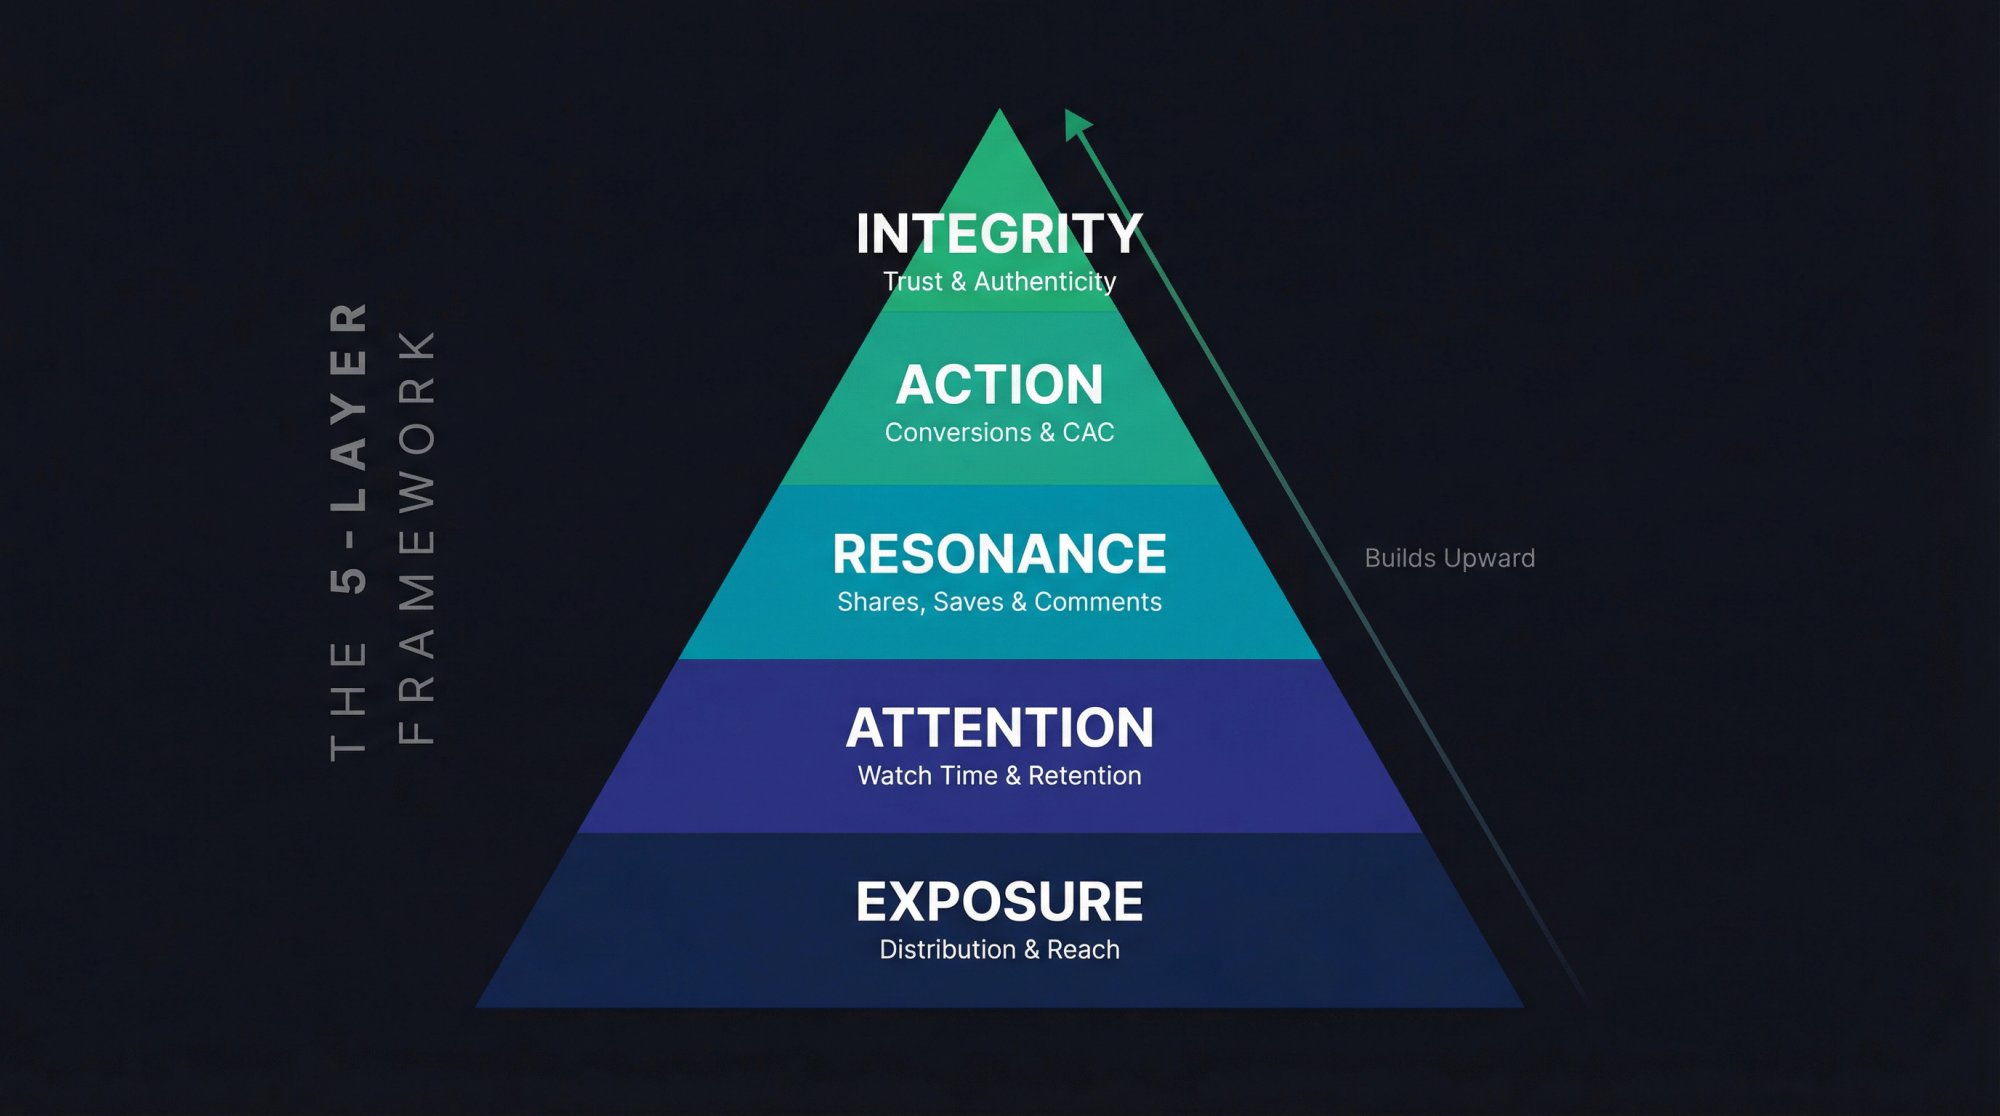
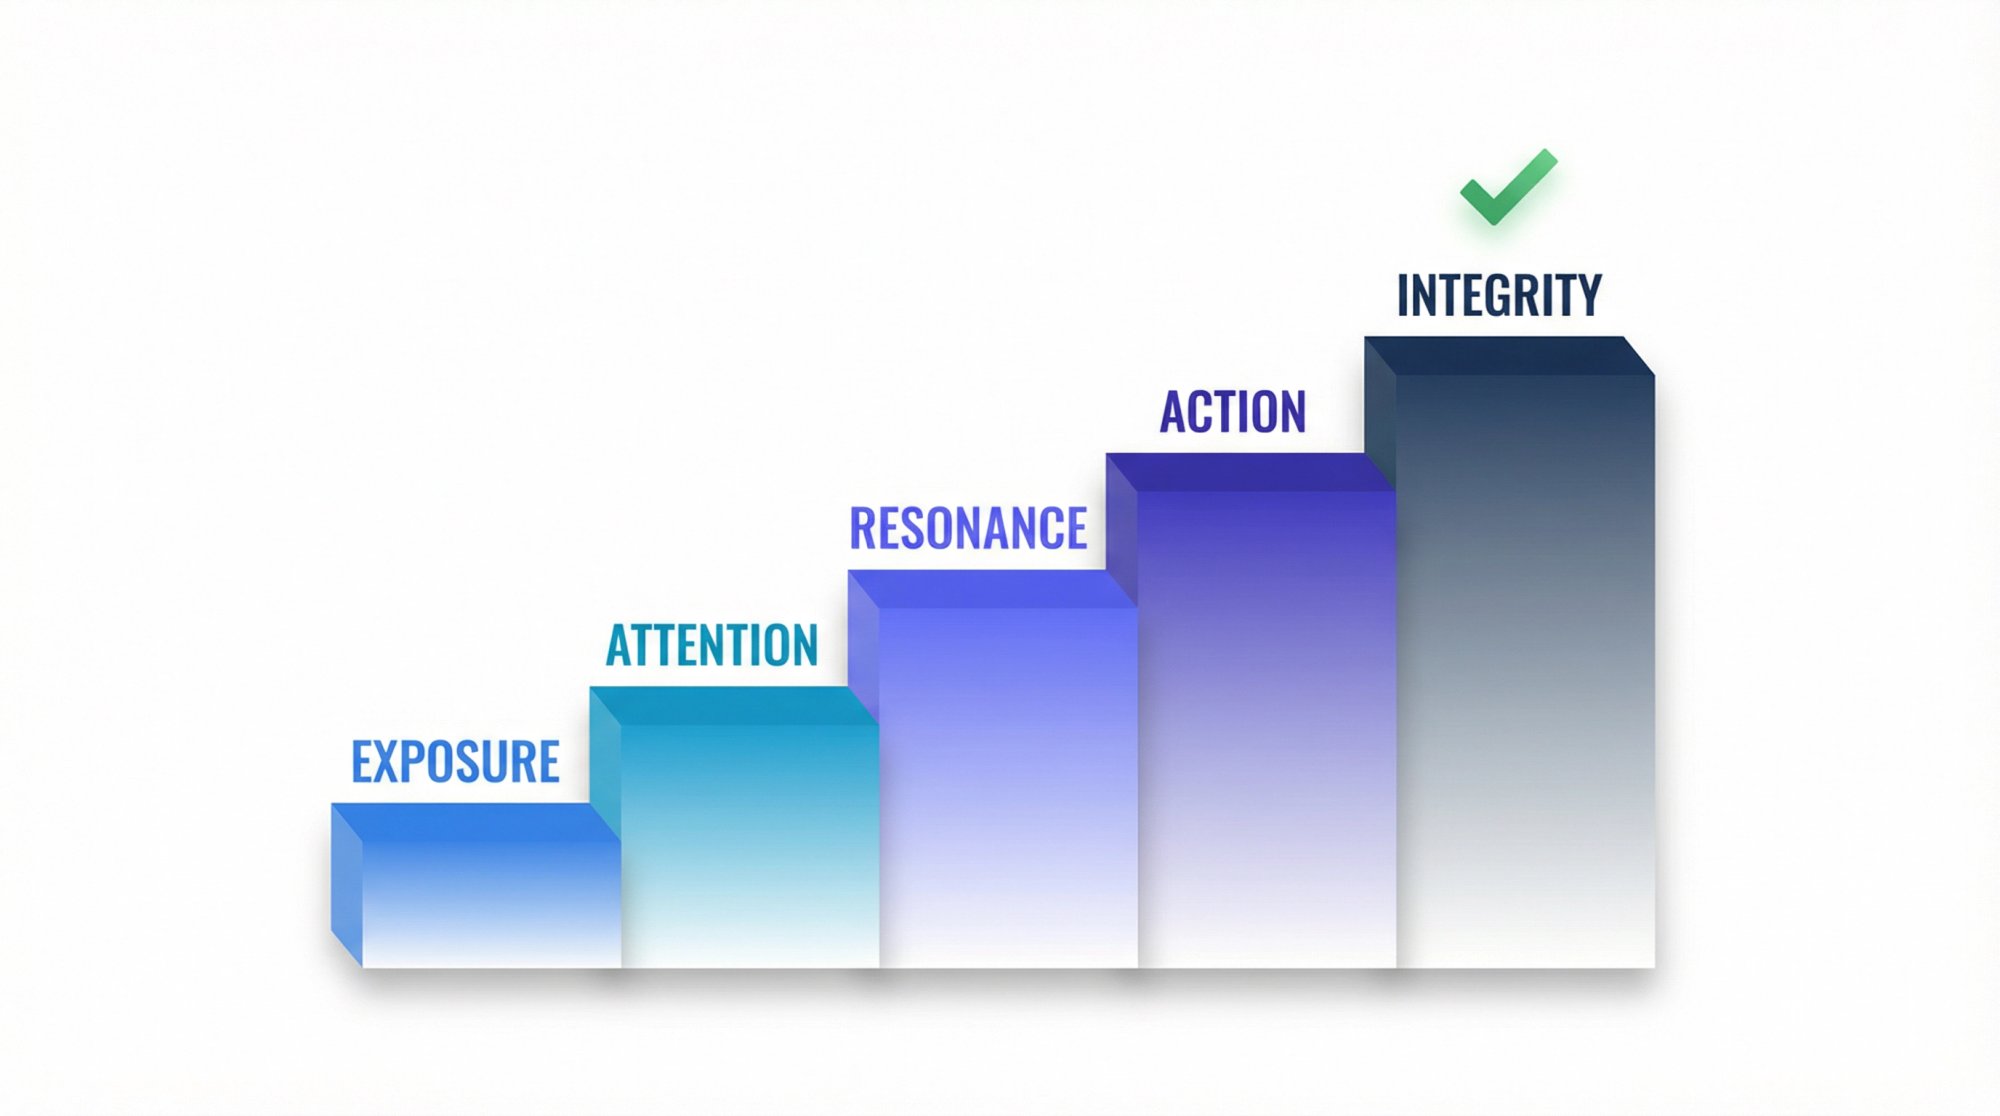
We've spent years building Shortimize to help teams answer exactly that question across TikTok, Instagram Reels, and YouTube Shorts. And what we've learned is this: the cleanest way to think about influencer metrics comes down to five layers.
| Layer | The Question It Answers |
|---|---|
| Exposure | Did the post get distribution? |
| Attention | Did people stay? |
| Resonance | Did it trigger a meaningful reaction? |
| Action | Did behavior change? |
| Integrity | Can you trust the result? |
That's the whole game. Everything else is a sub-metric. Each layer builds on the one before it, and skipping any of them leaves a real blind spot.
Why Your Campaign Goal Determines Which Metrics Matter
Most measurement fails before the campaign even starts. The team wants awareness, engagement, UGC, conversions, retention, and community growth from the same creator brief. Then the report arrives and nobody knows what "success" means.
A better approach is to assign one dominant job to each campaign. Our guide to managing influencer campaigns makes this point clearly: once you map metrics to funnel stage, analysis gets much cleaner.
A practical mapping you can start using today:
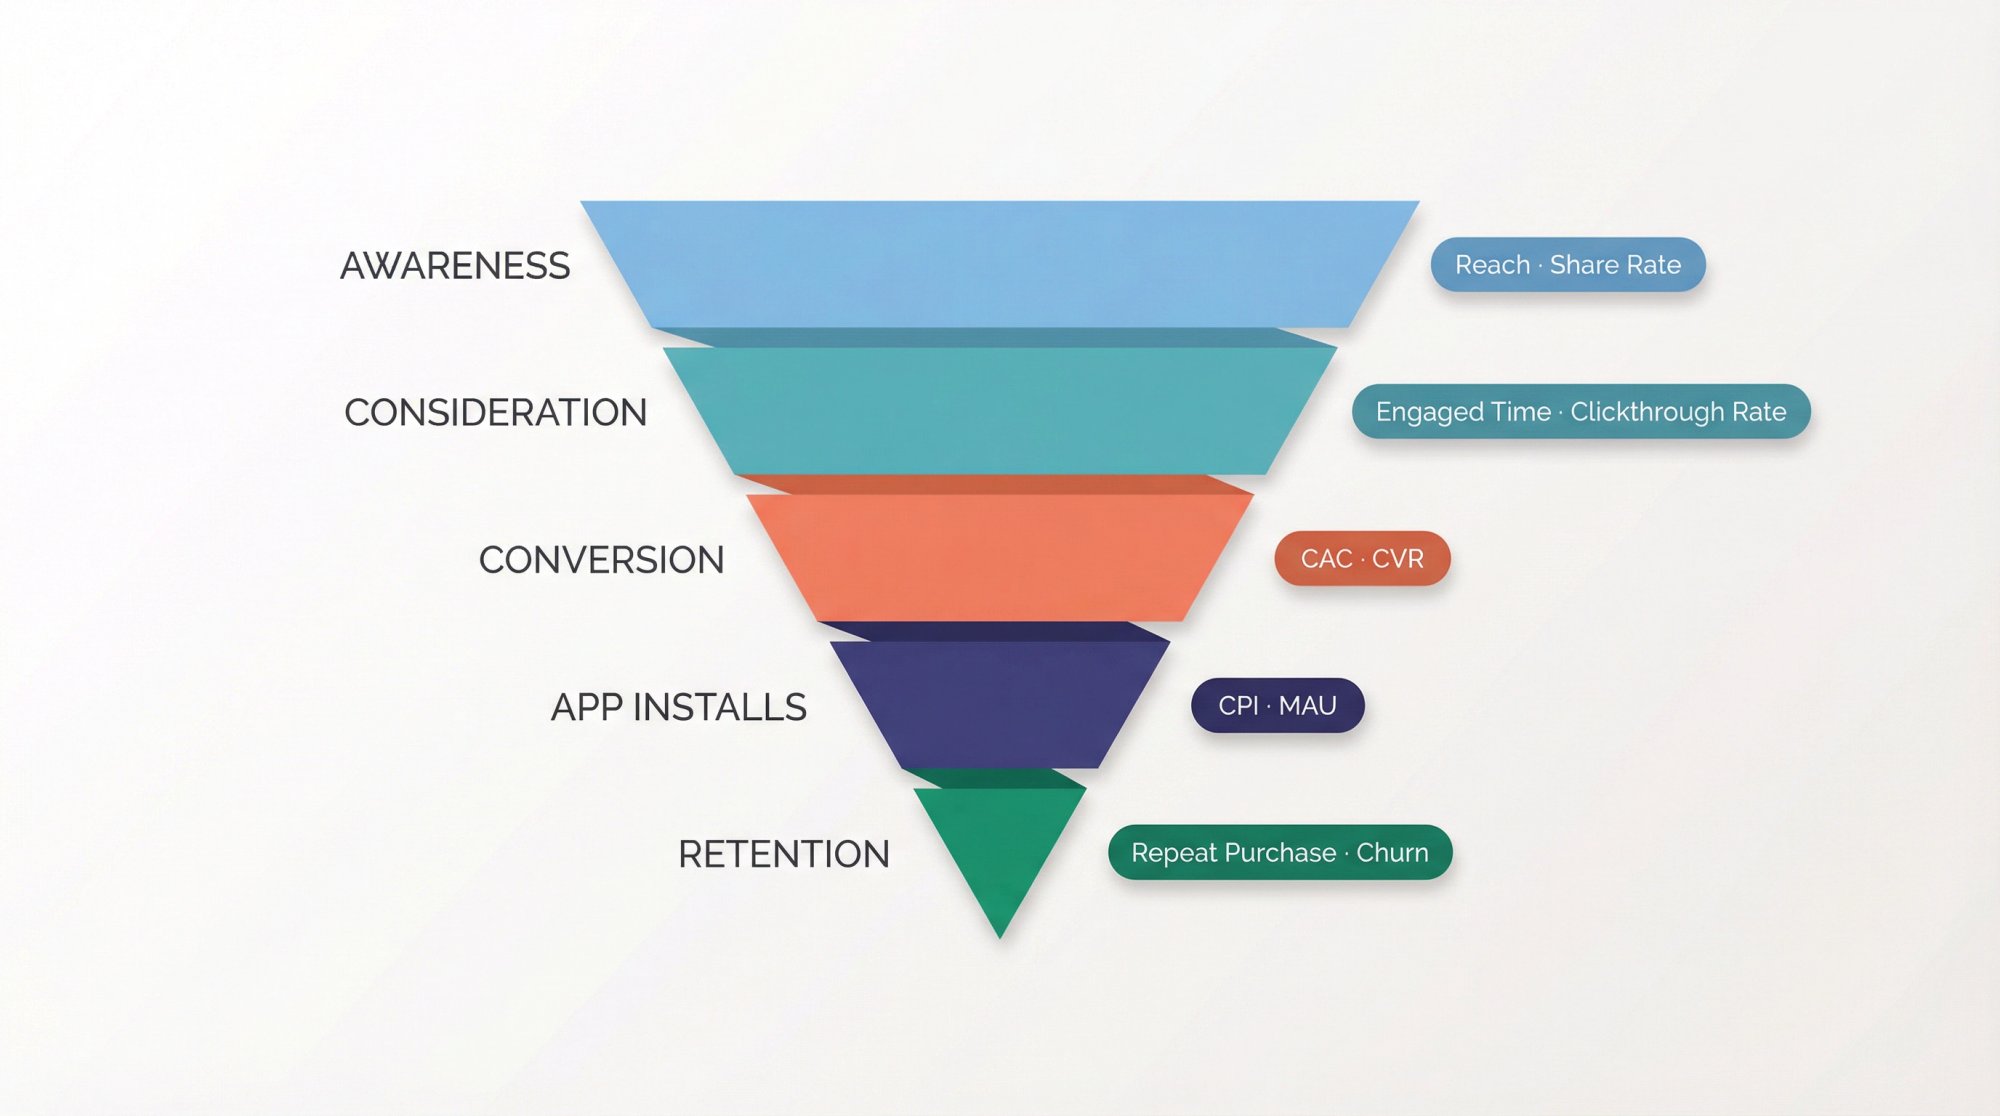
| Campaign Goal | Primary Metrics |
|---|---|
| Awareness | Qualified reach, attention rate, share rate, brand search lift |
| Consideration | Profile visits, qualified sessions, saves, signup starts |
| Conversion | Incremental conversions, CAC, AOV, new-customer rate |
| App Installs | Cost per activated user, D1/D7 retention, CPI as secondary only |
| Retention / Upsell | Repeat purchase rate, reactivations, churn reduction, revenue per user |
One blind spot that trips up a lot of teams: not every useful metric is public. Not every social channel exposes both reach and impressions for every post, and Instagram's branded content tools can provide tagged partners with organic insights on branded posts and stories. So before launch, decide which numbers will come from public tracking, which will come from creator exports or screenshots, and which will come from your own analytics stack.
Pro tip: If you're tracking dozens of creators across platforms, this is exactly where Shortimize saves hours. We pull public performance data for TikTok, Instagram, and YouTube into one dashboard, so you aren't bouncing between three native analytics tools for the data that is publicly available.
Why View Counts Don't Mean the Same Thing Across Platforms
Views are cheap. Attention is scarce.
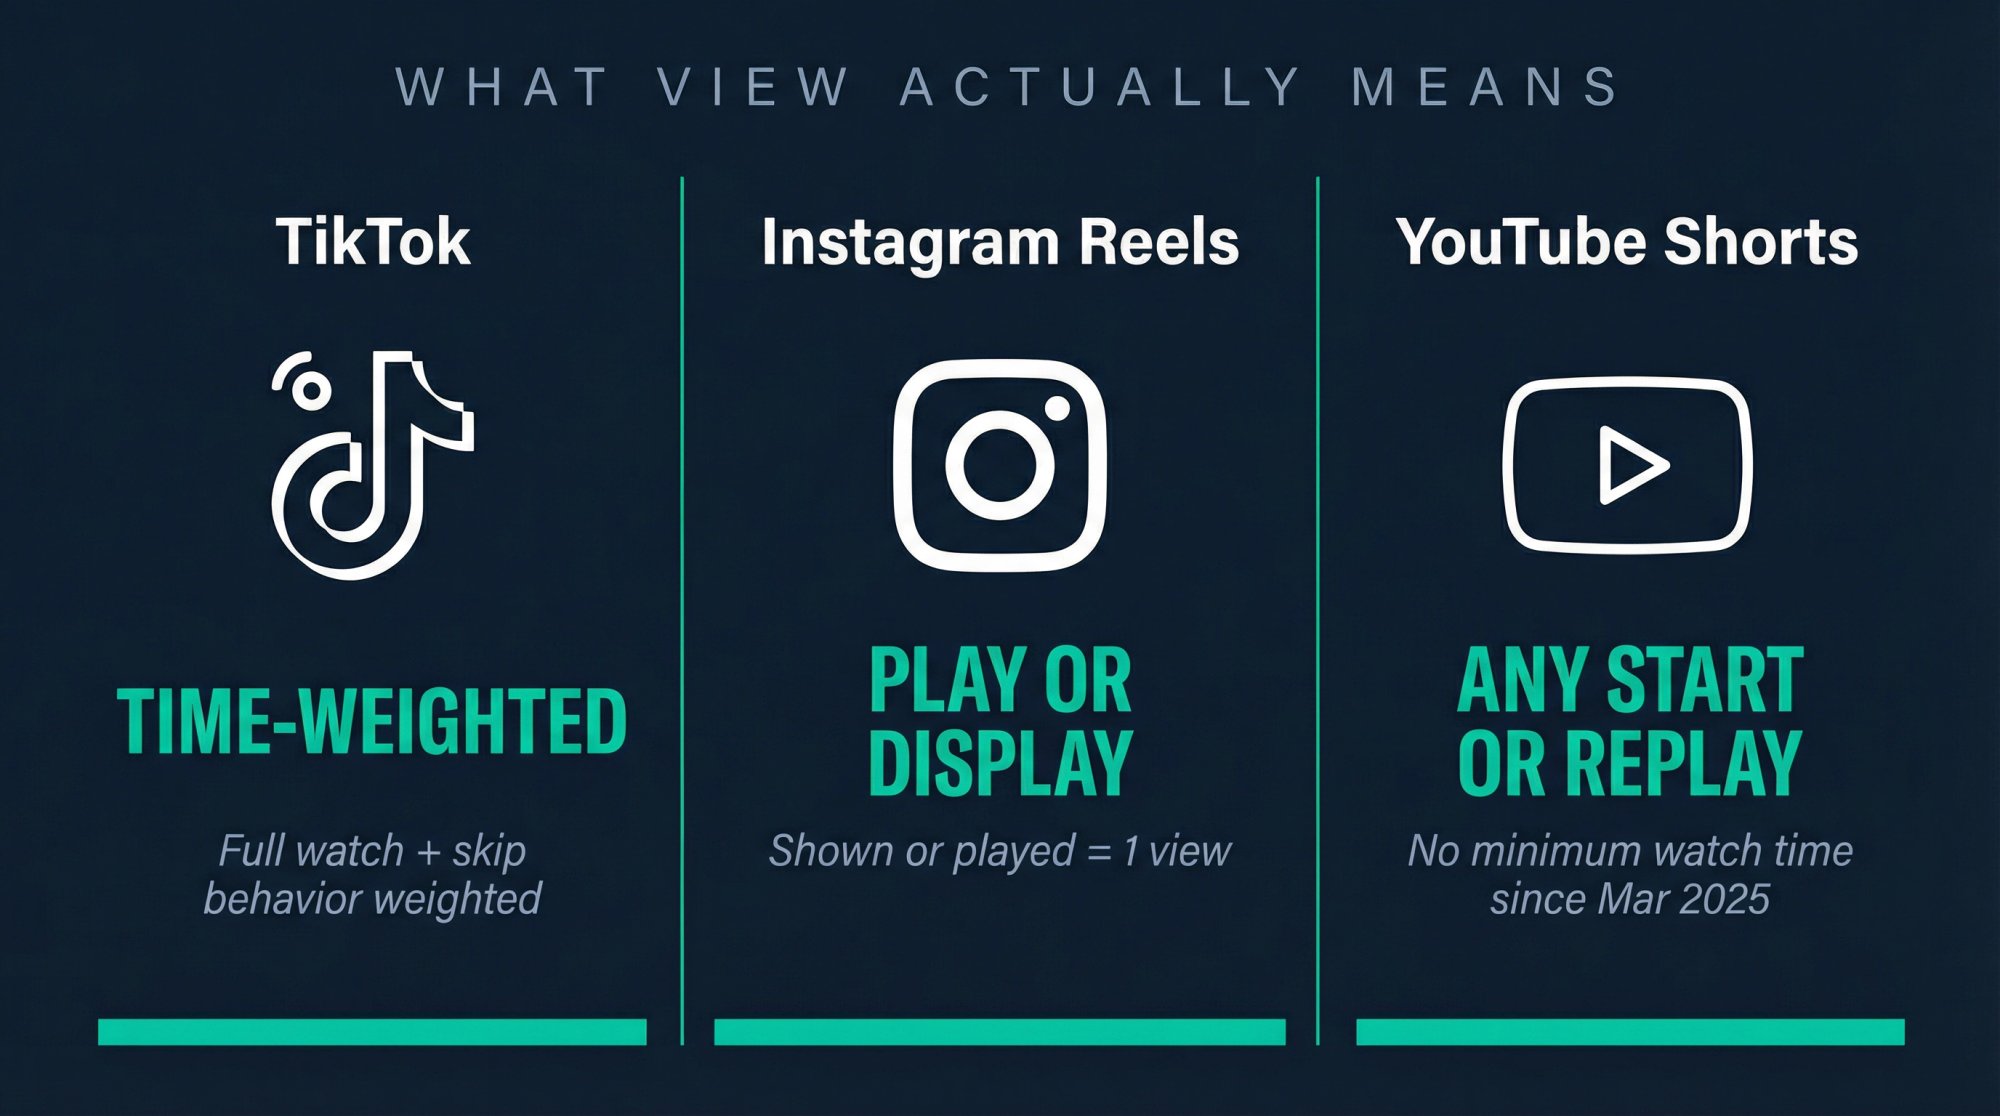
That distinction matters more in 2026 than it did a year ago because platform definitions keep shifting. Instagram's official help documentation currently defines Views as the number of times content was played or displayed across reels, posts, stories, live videos, and ads. YouTube changed Shorts view counting on March 31, 2025, so a Shorts view now counts every time a Short starts to play or replay, with no minimum watch time requirement. YouTube kept Engaged views in Analytics so creators can still compare how many people actually chose to keep watching. And TikTok's own recommendation documentation says user interactions (including time spent watching and whether viewers watch in full or skip) are generally weighted more heavily than many other factors.
If you want to understand how these view definitions affect your analysis across platforms, our breakdown of qualified views vs total views is a useful reference. And our watch time comparison across TikTok, Reels, and Shorts shows how the same number can mean very different things depending on the platform.
So when a cross-platform report says:
TikTok: 400,000 views
Instagram: 250,000 views
YouTube Shorts: 300,000 views
…that's not analysis. It's just counting. The next question has to be: what did those views actually mean on each platform?
Treat raw views as distribution context, not as your main quality metric. Pair them with reach or unique viewers where available, then move immediately to attention metrics.
The 5 Influencer Metrics That Actually Predict Performance
This is the core framework. Each layer builds on the one before it, and skipping any of them leaves a blind spot in your analysis.
Exposure: Did Your Post Actually Get Distributed?
Exposure matters because nobody can buy from content they never saw. But exposure alone only tells you the platform gave the creator a shot. It does not tell you whether the content earned sustained attention.
The metrics to track:
Views
Reach
Impressions
Unique viewers
Frequency (if you have it)
Think of it this way: exposure is the price of admission, not the performance.
Attention: Did People Watch Long Enough for the Message to Land?
This is the category most teams undervalue, and it's a costly mistake. YouTube explicitly calls watch time and audience retention key metrics for Shorts. TikTok's own Creator Rewards system makes this even clearer: qualified views exclude fraudulent views, paid views, disliked views, artificial views, and views under five seconds, while RPM is influenced by average watch time and finish rates.
Even TikTok's monetization logic is telling you that raw starts are not the same thing as quality attention.
What to track:
Watch time and average view duration
Average percentage viewed and completion rate
2-second or 6-second view rate (where available)
Stayed-to-watch or engaged views for Shorts
When you're using Shortimize to compare creators across platforms, attention metrics are what separate a creator who gets distribution from one who actually holds an audience. Our dashboard surfaces virality and median performance patterns that make this comparison fast, even across hundreds of tracked videos. The YouTube Shorts retention rate guide goes deeper on what strong retention benchmarks look like on that platform specifically.
Resonance: Did the Content Actually Move People to React?
Not all engagement signals are equal. A like often means "I noticed it." A save often means "I want this later." A share often means "this is strong enough to spend social capital on." Those aren't equivalent signals, and your analysis shouldn't treat them that way.
Instagram's current reels insights surface follows, likes, comments, shares, saves, views, and total play time. Instagram's own creator guidance highlights shares alongside watch time and retention. YouTube likewise includes likes/dislikes and post-watch survey results in Shorts ranking.
Signals to track:
Shares and saves (the most meaningful)
Meaningful comments
Profile visits and follows after exposure
Replies or DMs (if you can access them)
If you're only counting likes and comments, you're measuring the shallowest possible version of resonance. Shares and saves tell you far more about whether the content actually mattered to the viewer. Our social media engagement tracking guide has more detail on how to structure this analysis properly.
Action: Did the Creator Drive Real Business Outcomes?
This is where platform metrics stop being enough. Our influencer campaign tracking guide is direct about this: every serious goal needs first-party tracking.
The full action metric set:
Link clicks, signup starts, purchases, app installs
Cost per acquisition (CPA) and cost per activated user
Average order value (AOV) and new-customer rate
Retention or repeat purchase after acquisition
We also recommend tracking customer-quality metrics (new-customer percentage, AOV, retention, and refund or chargeback rate), not just topline sales. Because a creator can make ROAS look good while delivering low-quality buyers.
Research from industry surveys found 32% of consumers said they bought through an influencer's sponsored post in the last 12 months, and 64% said they're more willing to buy from a brand that partners with an influencer they like. The opportunity is real. But you need action metrics to prove it, not just engagement metrics. For a full walkthrough of tying performance back to campaign outcomes, our guide to how to optimize influencer campaigns covers the operational side in detail.
Integrity: Can You Trust the Results and Replicate Them?
This layer is what separates serious influencer programs from vanity campaigns. Most guides skip it entirely.
The FTC's endorsement guidance, updated in June 2023 and still the current U.S. baseline, says material connections must be clearly disclosed. A post that "performed" but violated disclosure rules isn't a clean win.
And if creator content was boosted, your organic analysis can get contaminated fast. TikTok's Spark Ads documentation says all views, comments, shares, likes, and follows gained from boosting are attributed to the original organic post. Google's BrandConnect documentation says partnership ads let brands use creator videos in ads while also accessing organic view metrics and standard Google Ads reporting.
Key integrity signals to check:
Audience fit and comment quality
Consistency over time (not outlier-dependent)
Disclosure compliance and content rights
Whether results were organic, paid-amplified, or mixed
Authenticity red flags (engagement pods, suspicious spikes)
If you don't separate organic from organic-plus-paid-amplification, you can easily overrate a creator who was helped by media spend. This is one of the most common analytical errors we see, and it's entirely preventable with proper tagging and tracking. Our guide to how to tell if an influencer has fake engagement covers the integrity layer in depth. For sponsored content specifically, our breakdown of how to analyze TikTok sponsored content walks through how to separate authentic performance from paid amplification.
Why Engagement Rate Is Meaningless Without the Right Formula
When someone asks, "What's a good engagement rate?" the right response is: good according to which formula?
Recent benchmark reports make the chaos obvious. Different January 2026 benchmarks put overall Instagram engagement at 0.48% while TikTok data from the same period showed rates around 3.70%. Other research reported average TikTok engagement by views at 4.90% on business accounts for the first half of 2025.
Those numbers don't line up because the methodologies don't line up. Some studies divide by followers, some by views, some use brand accounts rather than creators, and some datasets include boosted content.
That's why "5% engagement" by itself is almost meaningless. Your next question should always be: 5% of what?
For short-form influencer analysis, keep these formulas in one scorecard:
ER_view   = (likes + comments + shares + saves) / views x 100
ER_reach  = total engagements / reach x 100
Share rate = shares / reach x 100  (or / views if reach is unavailable)
Save rate  = saves / reach x 100   (or / views if reach is unavailable)
CTR        = link clicks / reach x 100  (or / impressions, but label the denominator)
CVR        = conversions / clicks x 100
CPA        = total spend / conversions
CAC        = total spend / new customers
Use ER_view when you want to understand how strong the content was relative to total exposures. Use ER_reach when you want to understand how intensely unique people reacted. Use follower-based engagement only when you're comparing against follower-based benchmark studies. Our guide on what is a good view rate for TikTok also explains why the denominator you choose fundamentally changes how you interpret your results.
For TikTok specifically, our guide on what is a good engagement rate on TikTok breaks down what benchmarks actually mean by account type and niche, so you can calibrate your expectations with more precision.
On YouTube Shorts specifically, there's an extra nuance: because raw Views became a starts-to-play metric in 2025, Engaged views is often the cleaner denominator for quality analysis. If you care about whether people stayed (not just whether the Short started), use the metric that matches the question.
How to Calculate Influencer Metrics: A Worked Example
A hypothetical post with real math:
| Metric | Value |
|---|---|
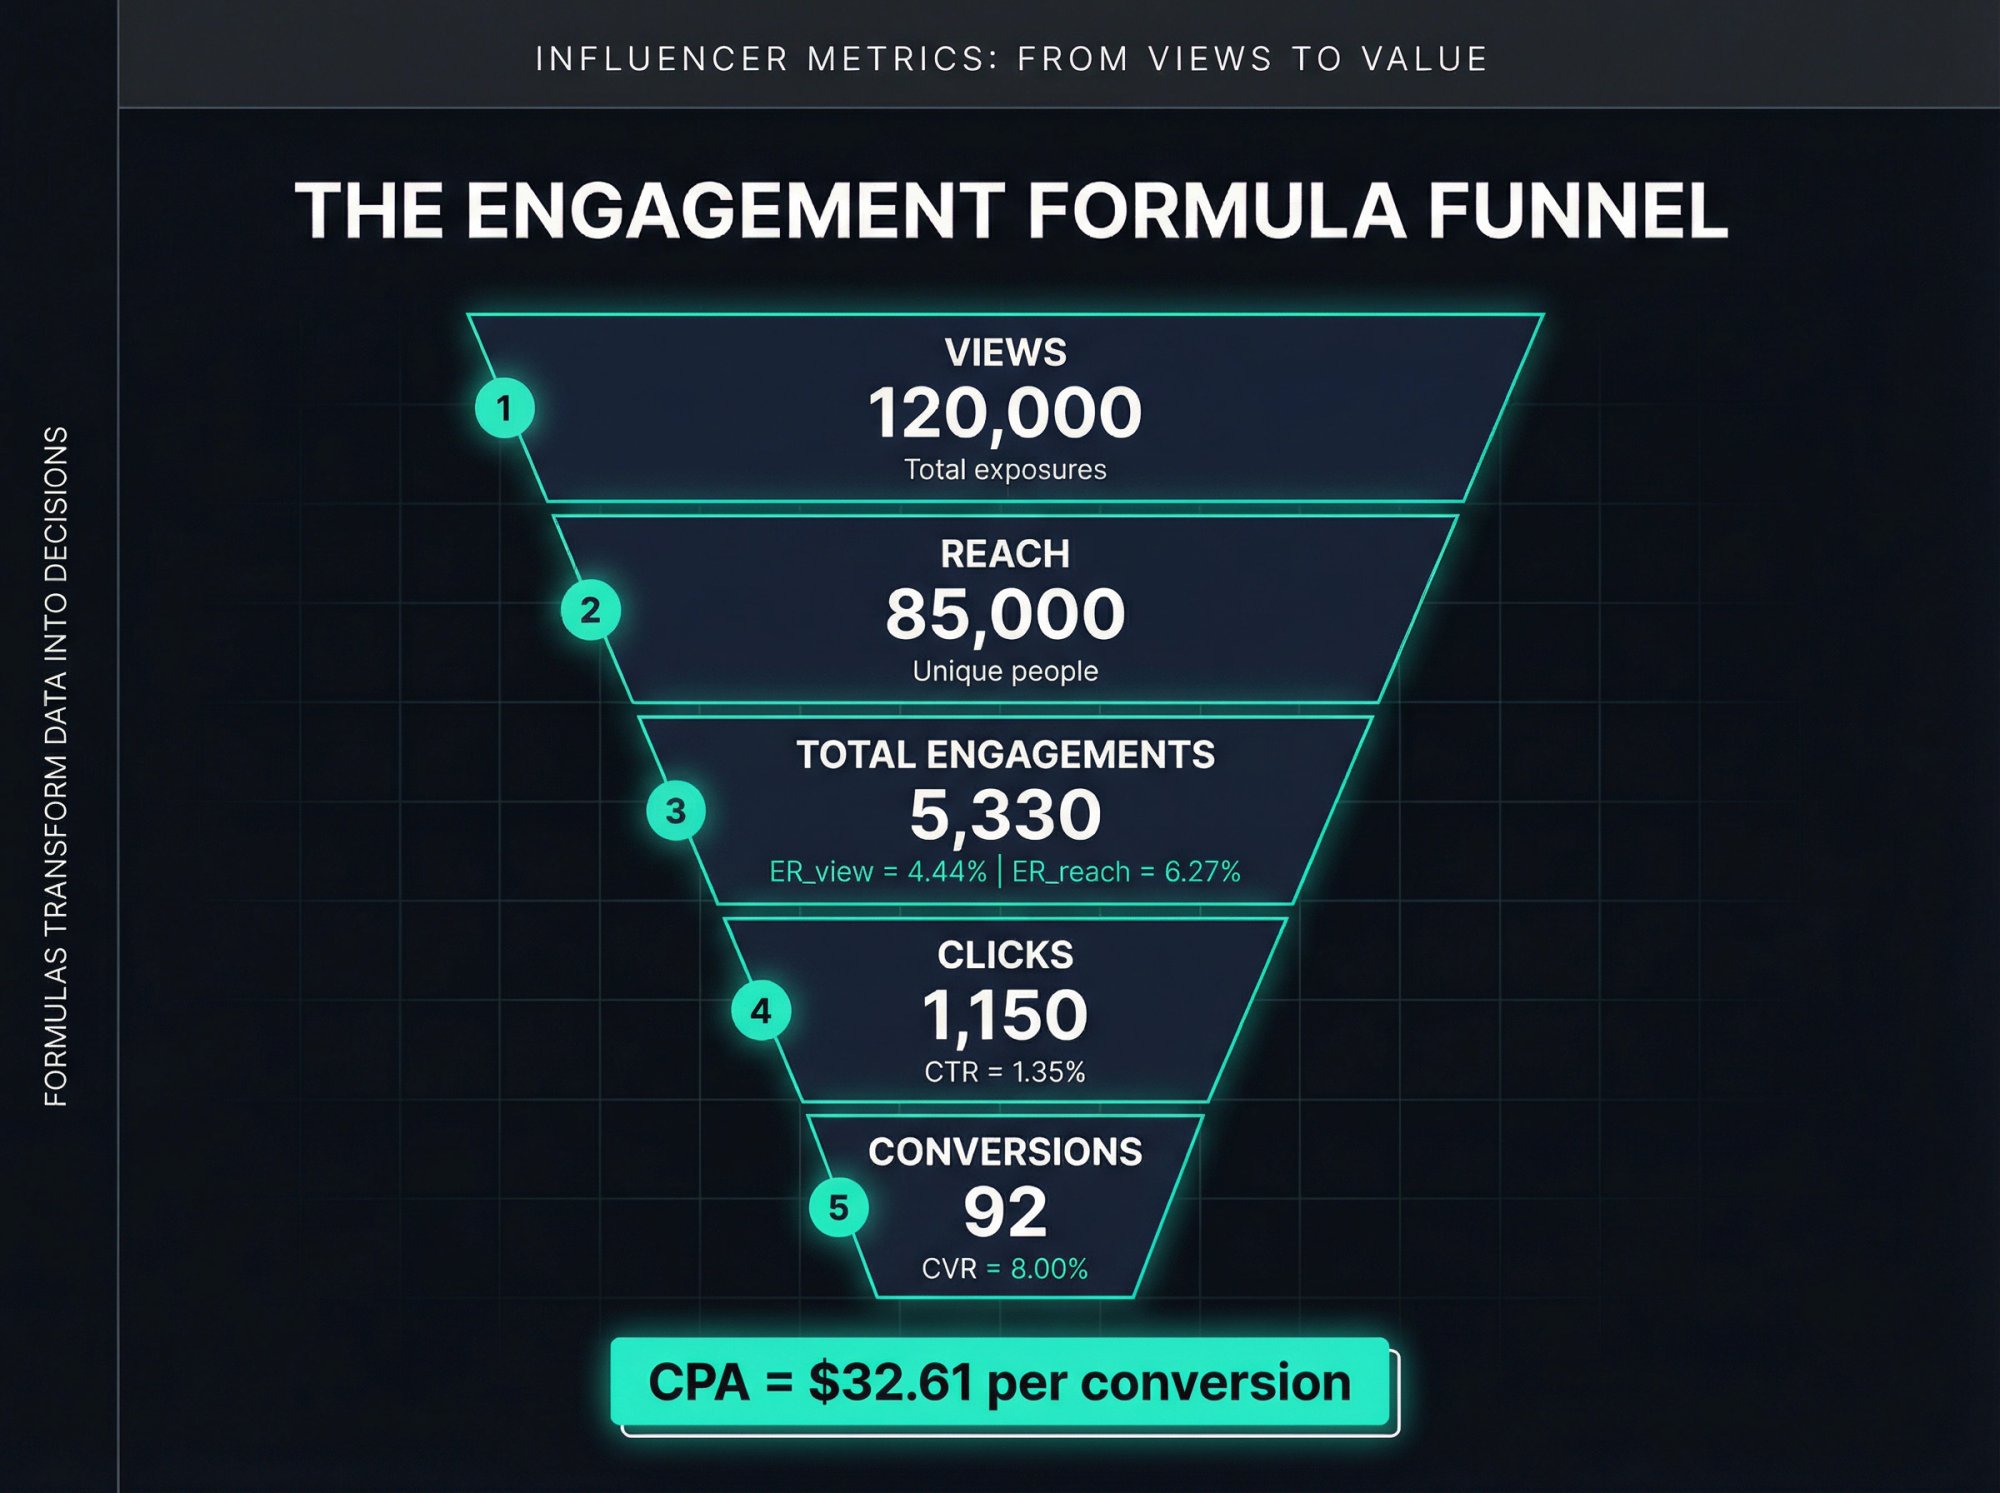
| Views | 120,000 |
| Reach | 85,000 |
| Likes | 4,200 |
| Comments | 280 |
| Shares | 540 |
| Saves | 310 |
| Clicks | 1,150 |
| Purchases | 92 |
| Spend | $3,000 |
That gives you:
ER_view    = (4200 + 280 + 540 + 310) / 120000 = 4.44%
ER_reach   = 5330 / 85000 = 6.27%
CTR_reach  = 1150 / 85000 = 1.35%
CVR        = 92 / 1150 = 8.00%
CPA        = 3000 / 92 = $32.61
Now you're not just looking at "good engagement." You're seeing a funnel. That's what useful influencer analysis looks like.
How to Evaluate Creator Pricing Using Median Performance
This is the easiest way to stop overpaying creators.
Don't price or judge a creator from their highlight reel. Pull the last 20 to 30 relevant posts and compute:
Median views
Median watch time or completion
Median ER_view
Median click-through (if you have it)
Spread between lower and upper quartiles
Our influencer audit guide at Shortimize is explicit about this: price based on expected median performance rather than the top 1% of posts. The same guide warns against outlier dependence, where one or two viral hits carry the average. And it highlights a crucial cross-platform truth: a creator can crush TikTok and fall flat on Reels or Shorts, so platform strength doesn't automatically transfer.
Here's why median matters so much in practice:
Post views: 8k, 9k, 10k, 10k, 200k

Average: 47.4k
Median:  10k
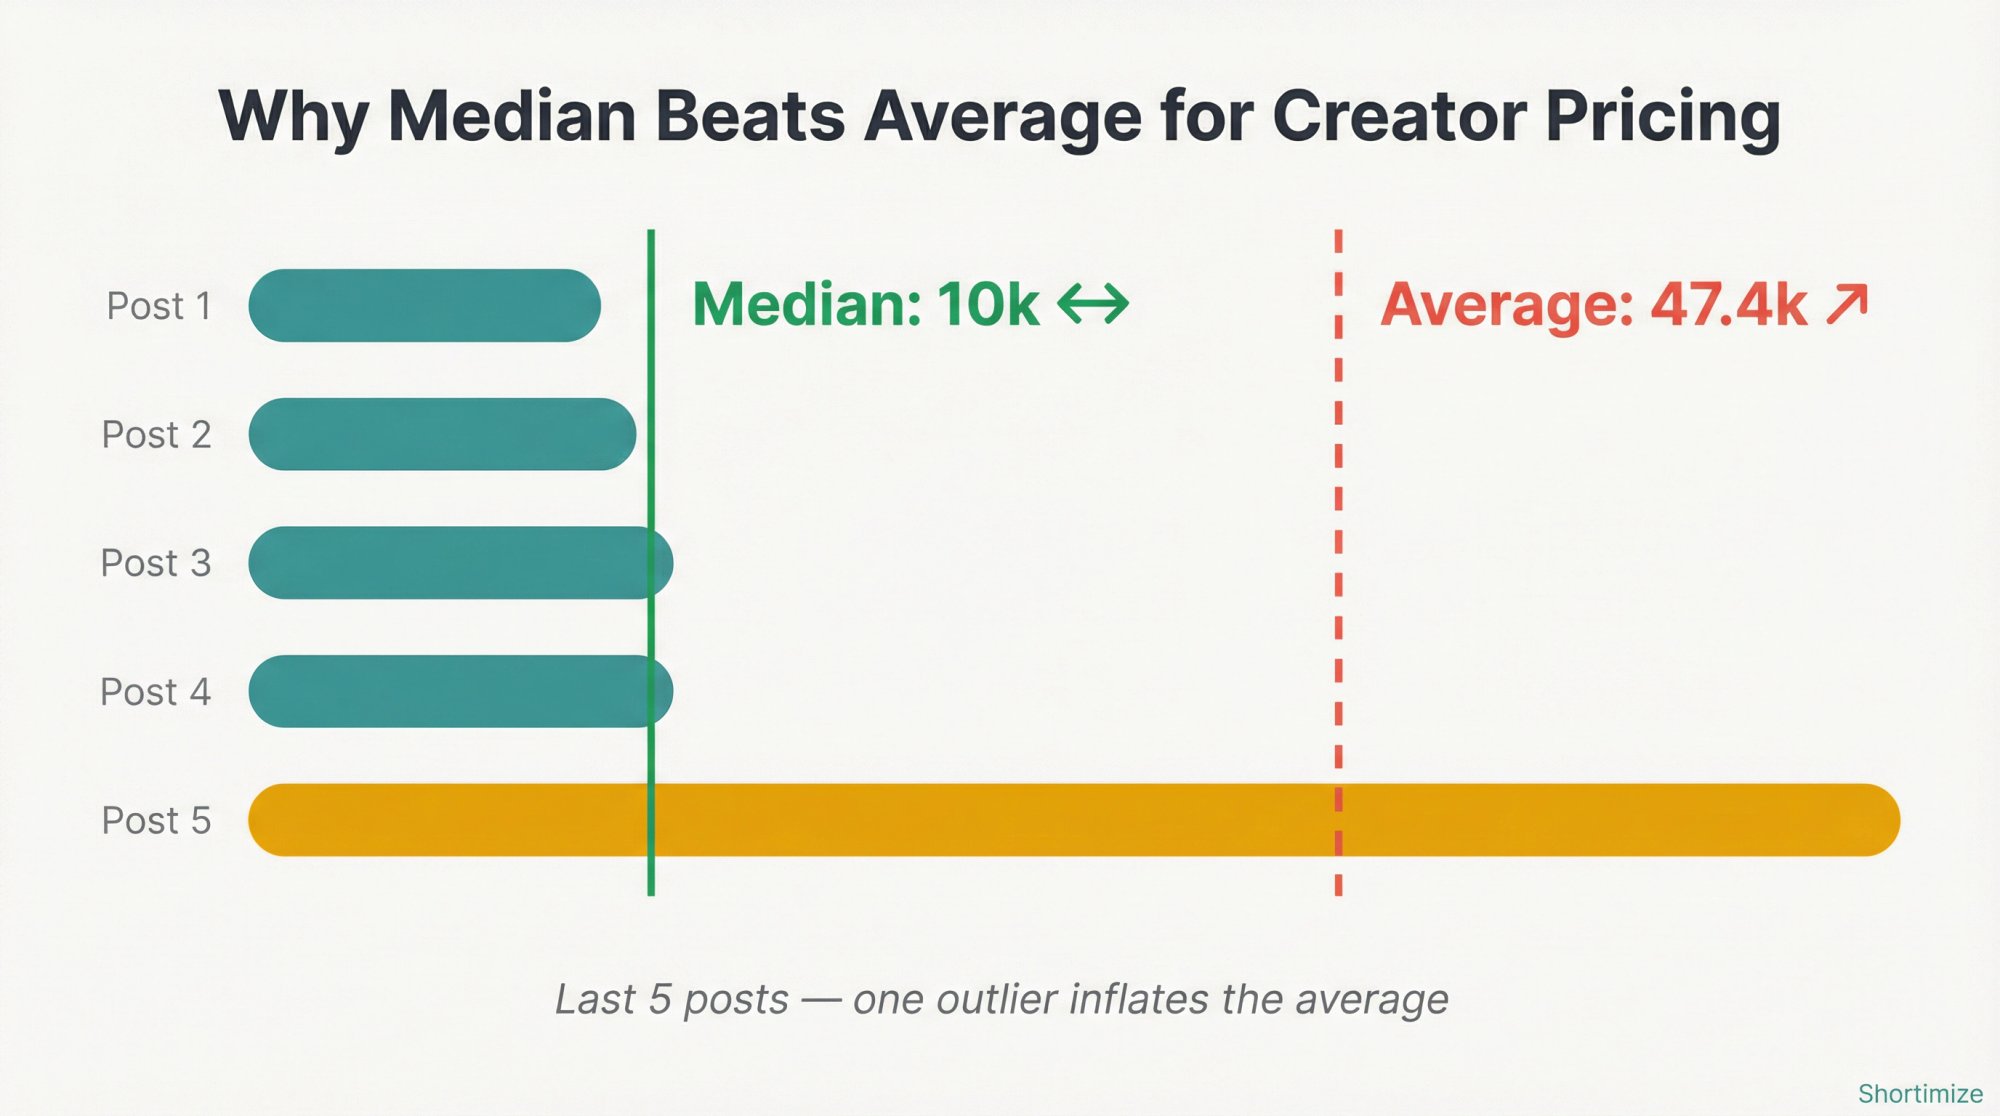
If you negotiate on the average, you're paying for an event that almost never happens. Negotiate on the median, and you're paying for what the creator actually delivers most of the time.
That one change alone can save a significant chunk of bad spend.
With Shortimize, you can pull median and virality patterns for any public creator account across TikTok, Instagram, and YouTube, all in one view. No spreadsheet gymnastics. No screenshotting native analytics. Just paste the handle or URL, and the numbers are there.
Before committing budget, it also helps to understand platform-specific performance baselines. Our guide to finding top-performing videos in any TikTok niche shows how to benchmark creators against real niche performance, not just generic averages.
How to Measure Attribution and Incrementality Together
Attribution tells you who got credit. Incrementality tells you what actually changed because of the campaign.
Both matter.
For day-to-day measurement, use:
① UTM links
② Creator-specific landing pages
③ Promo codes
④ Pixels or events APIs
⑤ Post-purchase surveys
⑥ Mobile attribution (if the goal is installs)
But don't stop there when budgets get meaningful. Attribution can over-credit creators because some people would have purchased anyway. For larger campaigns, add experiments. Google's BrandConnect guidance explicitly recommends head-to-head experiments with a control campaign and a test campaign to validate whether adding creator video lifted performance. Our post-campaign optimization guide also leans toward incremental reach, incremental conversions, and activated-user metrics over surface-level totals.
Attribution is your operational scoreboard.
Incrementality is your causal truth.
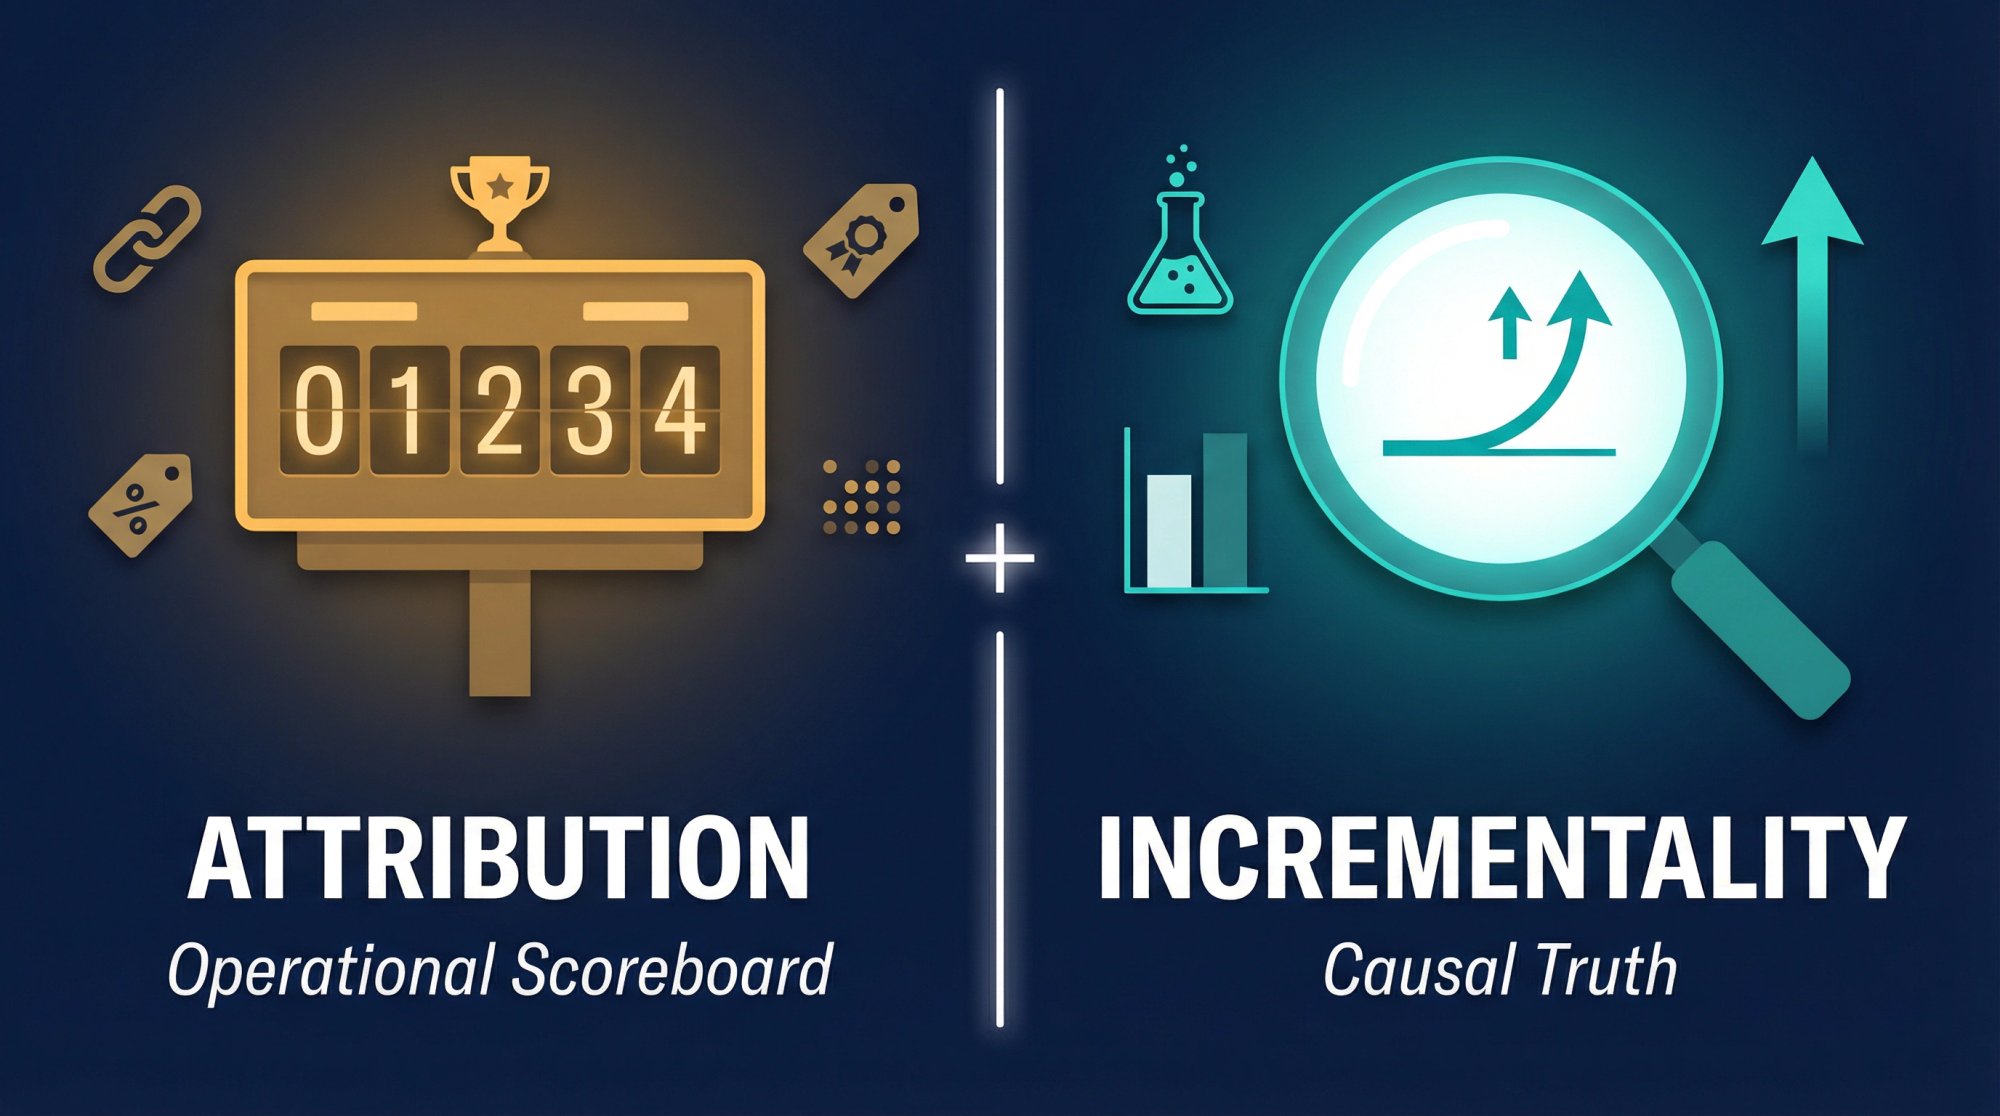
You need both. And once you've run a campaign through both lenses, our guide on how to manage influencer campaigns shows how to turn those findings into concrete budget and strategy decisions for the next round.
The 3-Stage Influencer Review Cadence That Actually Works
Most teams either overreact too early or wait too long. A simple cadence fixes this.
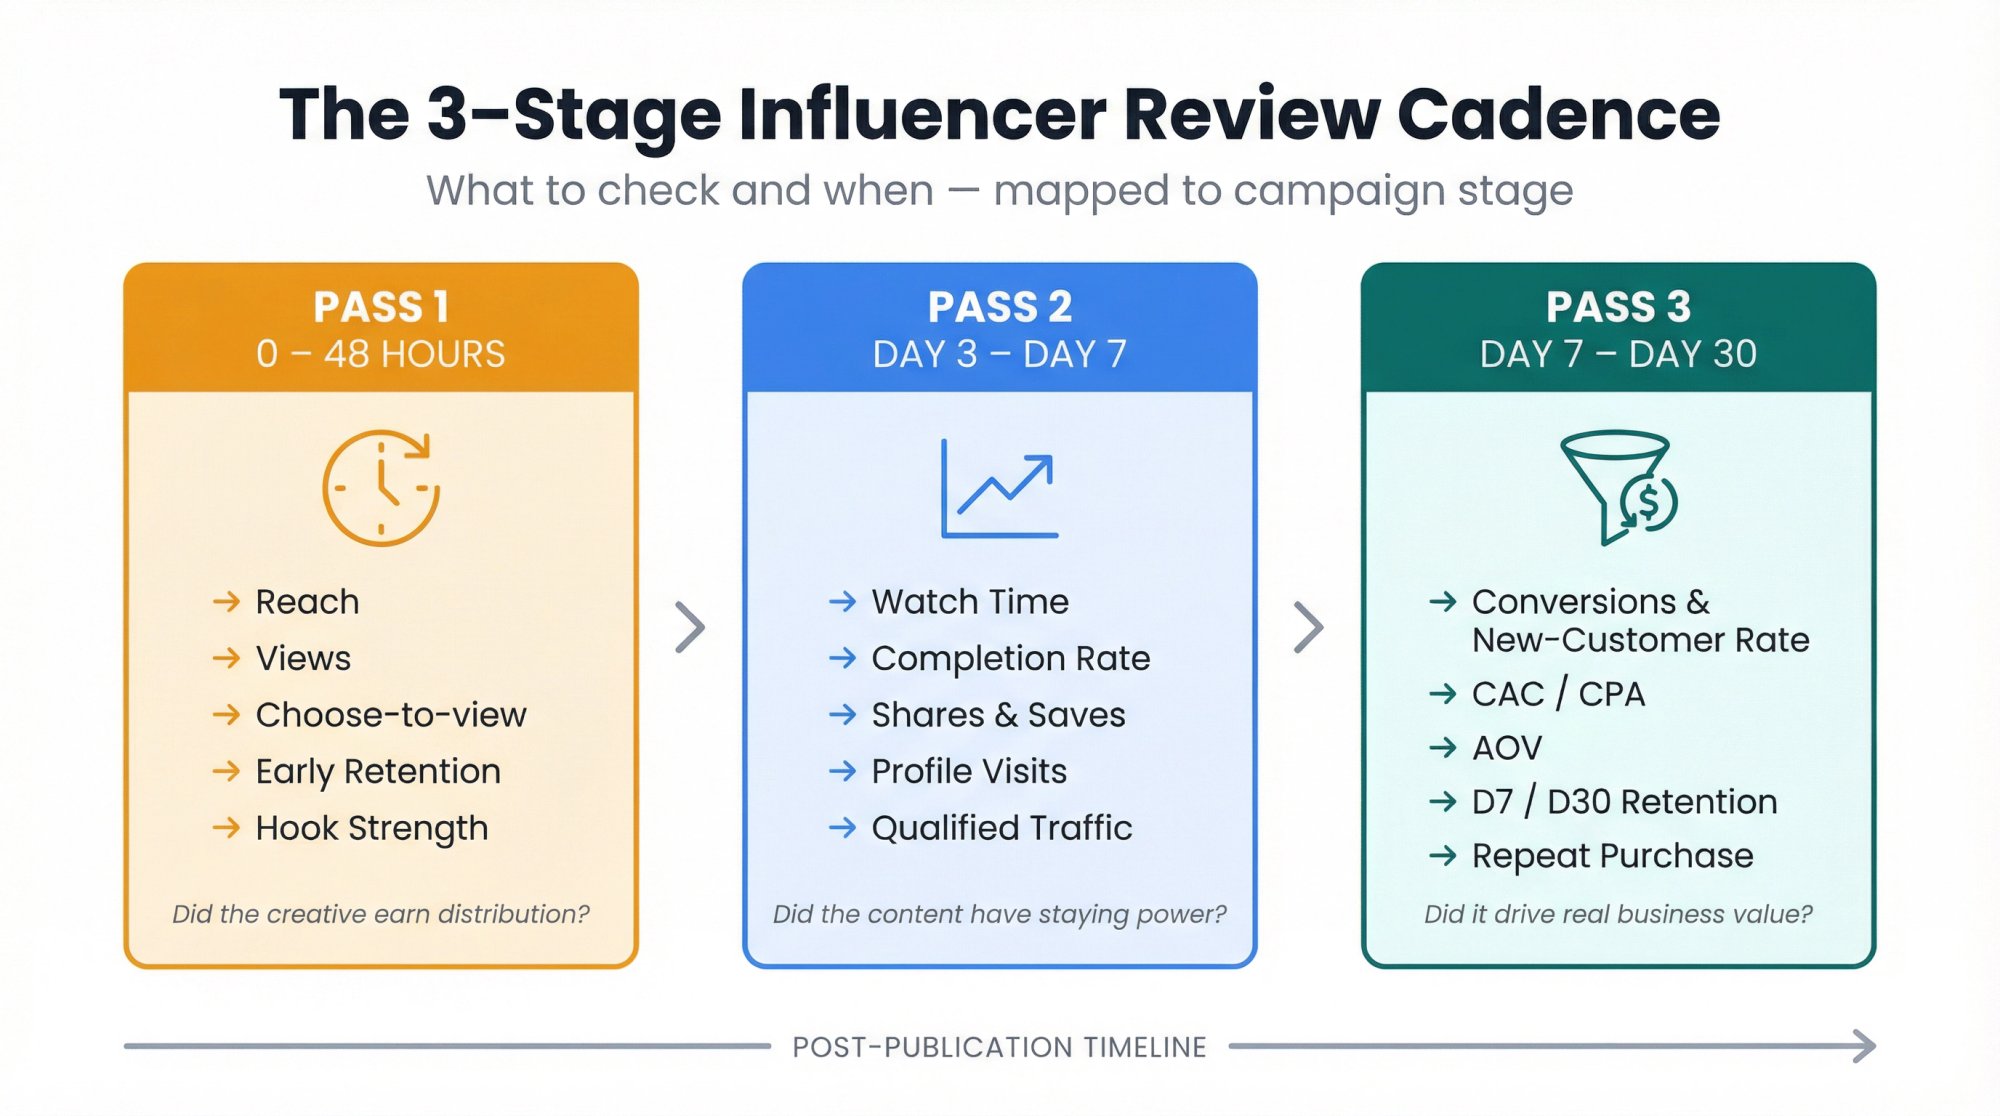
Pass 1: What to Check in the First 24 to 48 Hours
Focus on early distribution signals. This tells you whether the creative earned the right to keep getting distribution. If early retention is terrible, you know the hook failed. If views are strong but choose-to-view is low, the thumbnail or opening frame might be the problem. This is the window where quick iteration matters most.
→ Reach or initial distribution
→ Views
→ Choose-to-view or stayed-to-watch (where available)
→ Early retention
→ Hook strength
→ Comment quality
Pass 2: What to Analyze from Day 3 to Day 7
Shift to staying power and intent signals. High shares and saves at this stage are strong signals of content that's being referenced or bookmarked, not just passively consumed.
Watch time and average percentage viewed tell you whether the content had legs. Shares and saves confirm whether it actually meant something. Combine those with:
Completion rate
Profile visits and follows
Qualified traffic
Pass 3: How to Evaluate Business Outcomes at Day 7 to 30
Now look at business outcomes. This tells you whether the creator drove business value, not just social activity.
| Metric | What It Tells You |
|---|---|
| Conversions + new-customer rate | Did the creator bring in real buyers? |
| CAC or CPA | How efficiently did they acquire them? |
| AOV | What quality of buyer? |
| App activation rate + D7/D30 retention | Did those users stick around? |
| Repeat purchase + assisted conversions | Long-term value signal |
If you're tracking performance in Shortimize, you can see these trends across creators and platforms without rebuilding spreadsheets every week. For teams managing ongoing campaigns, our guide to how to spy on competitors' influencer strategy covers how to use this kind of cadence to benchmark your creators against the market without waiting for the final report.
How to Build an Influencer Scorecard Your Team Will Actually Use
A workable influencer scorecard doesn't need 40 fields. It needs a small number of weighted dimensions that match the campaign goal.
For a short-form acquisition campaign, a strong starting point:
| Dimension | Weight | What It Measures |
|---|---|---|
| Business Impact | 30% | Conversions, CAC, new-customer rate |
| Attention | 25% | Avg view duration, completion, engaged views |
| Resonance | 20% | Share rate, save rate, meaningful comments |
| Audience Fit | 15% | Geography, category fit, platform fit |
| Integrity | 10% | Disclosure, authenticity, organic vs paid clarity |
For awareness campaigns, shift more weight to exposure and attention. For app campaigns, shift more weight to activation and retention. For creator sourcing, shift more weight to consistency and audience fit.
The point isn't to create a fake-precise number. The point is to force your team to judge creators on the dimensions that actually matter for the job at hand. When everyone scores on the same rubric, conversations about "who performed" get a lot less subjective.
If you want to see how this plays out in practice across different platforms, our cross-platform influencer analysis guide walks through how to build a comparable scorecard when creators span TikTok, Reels, and Shorts simultaneously.
The Biggest Influencer Analysis Mistakes That Waste Your Budget
Follower count is not a KPI. It's a filtering variable and, at best, a rough pricing input. Platform ranking systems increasingly react to what viewers actually do, not just how big the creator's audience looks on paper. Instagram, TikTok, and YouTube all make that plain in their own ranking and recommendation guidance.

Other mistakes we see constantly:
Using one undefined engagement rate and pretending it's universal
Comparing TikTok, Instagram, and YouTube views as if they mean the same thing
Reporting averages without medians
Mixing organic results with paid amplification
Judging creators on surface engagement but not customer quality
Ignoring disclosure compliance and usage rights
Treating ROI as the only diagnostic metric
That last one deserves its own callout. Industry research makes a sharp point: "ROI" sounds clean but gets messy fast because teams define both return and investment differently. ROI or ROAS belongs in the board deck. But if you want to understand why performance changed, you need attention, resonance, conversion rate, and customer-quality metrics underneath it.
For deeper pattern recognition across creator programs, our influencer analytics tool guide covers how analytics-driven teams approach the metrics layer systematically. And if you're working with competitors or brands in a shared space, our social media competitive analysis guide shows how to use performance data to benchmark your programs against the market.
How to Analyze Influencer Metrics Across Platforms with Shortimize
If you're running short-form influencer programs across TikTok, Instagram, and YouTube, the hardest part usually isn't getting data. It's getting comparable data fast enough to make decisions.
That's the problem Shortimize was built to solve. Our influencer tracking product lets teams track public creator accounts and videos, compare performance across platforms, pull account and content-level metrics, surface median and virality patterns, organize creators into Collections, and export clean reports. We also sync data to tools like Amplitude, Mixpanel, and PostHog, and send Slack or Discord notifications when videos go viral.
Our recent guides emphasize the two analysis habits that matter most in practice: using median performance instead of getting fooled by outliers, and tying creator performance back to business outcomes with first-party tracking.
Shortimize is especially strong for three jobs:
① Pre-campaign vetting. Spot one-hit wonders, weak baselines, and platform mismatch before you spend a dollar. With cross-platform influencer analysis, you can see whether a creator's TikTok account performance actually translates to Reels or Shorts before you sign a deal.
② Live campaign monitoring. Compare creators side by side without living in screenshots and spreadsheets. Our social media monitoring capabilities let you track any public account continuously across Instagram Reels and YouTube Shorts, so you're never waiting on a creator to send a screenshot. Collections let you group creators by campaign, brand, or any other dimension that makes sense for your workflow.
③ Post-campaign reporting. Turn short-form performance into an executive-ready view of what scaled, what didn't, and where budget should move next. Our best influencer marketing tools guide explains how to structure your reporting for different stakeholder audiences.
If you want to see it in action, start a free 7-day trial.
FAQ
What Is the Single Most Important Influencer Metric?
There's no single best metric across every campaign. For awareness, the best primary KPI is usually qualified attention, not raw views. For performance campaigns, it's usually incremental conversions, CAC, or cost per activated user. For retention, it's cohort quality, not just first purchase. Our influencer tracking software guide and industry research both support this goal-first approach: pick your campaign's dominant job, then choose the metric that maps to it.
What Is a "Good" Engagement Rate for Influencers?
There's no universal answer because formulas differ. Various January 2026 benchmark reports, October 2025 Instagram benchmarks, and mid-2025 TikTok benchmarks all show different platform averages depending on denominator, sample, and account type. Use benchmark numbers directionally, not as law. Your real benchmark should be a matched cohort plus the creator's own median baseline. For TikTok-specific context, our guide to what is a good engagement rate on TikTok breaks down what strong numbers actually look like by niche.
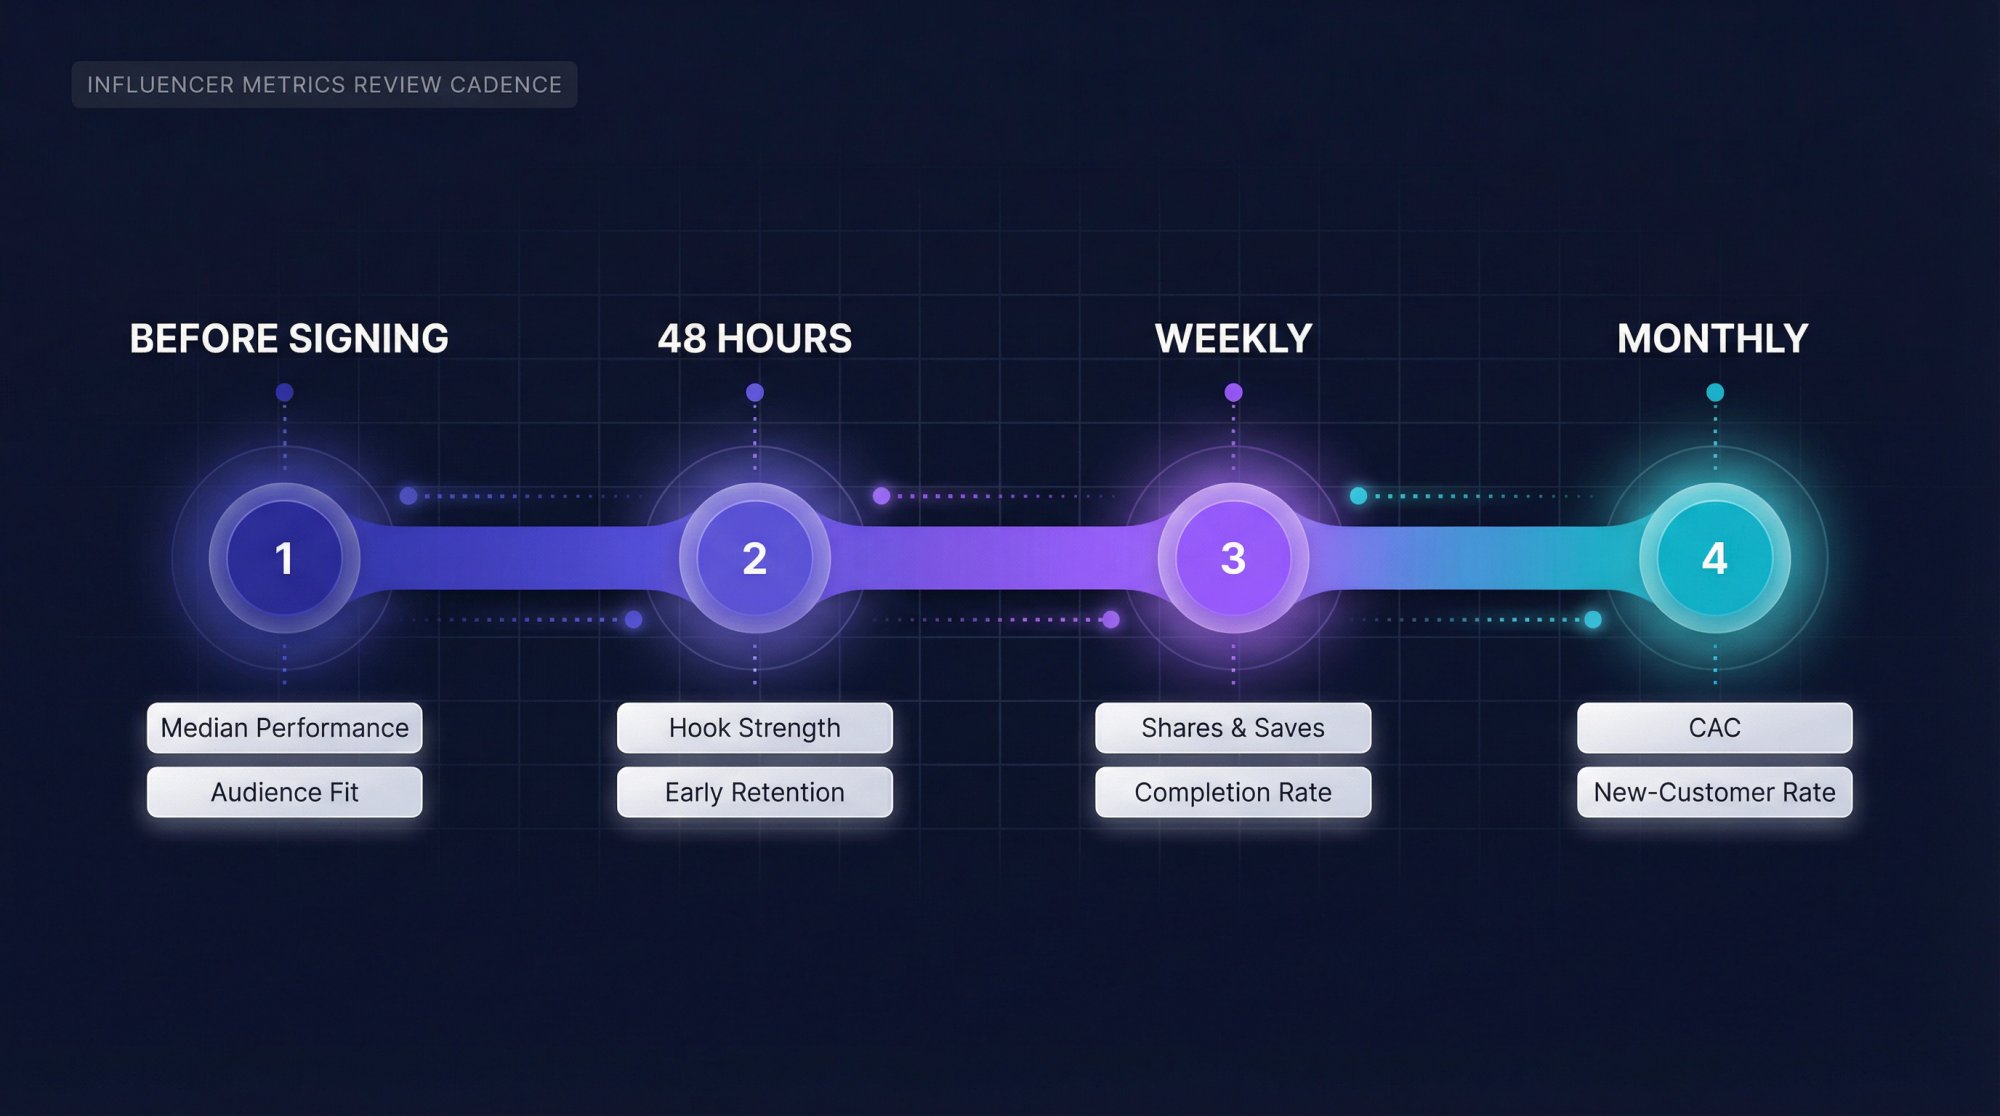
How Often Should You Review Influencer Metrics?
At minimum, review them at four moments: before signing the creator, within 48 hours of posting, weekly during the campaign, and monthly at the portfolio level. That gives you enough speed to react without confusing normal post-level volatility for a strategic problem. Tools like Shortimize make the weekly and monthly reviews dramatically faster because performance data across platforms is already consolidated. Our influencer tracking category has additional guides on building review cadences that scale as your creator roster grows.
What Great Influencer Analysis Actually Looks Like
The cleanest hierarchy for analyzing influencer metrics that matter is simple:
Exposure gets you a chance.
Attention earns the next impression.
Resonance proves the content mattered.
Action proves the business value.
Integrity keeps you from fooling yourself.
The teams that win in 2026 aren't the teams with the biggest creator roster. They're the teams that can tell, creator by creator and post by post, whether a piece of content got seen, held attention, moved behavior, and did it honestly. That's how you stop paying for clout and start buying results.
If you're ready to bring that level of clarity to your influencer programs, Shortimize is the fastest way to get cross-platform short-form analytics into one place. Start your free trial today.